SPY: Earnings Season Winners And Losers For Q1 2023

Summary
- With approximately 90% of S&P 500 Index companies reporting, it's clear this earnings season was a success. Yardeni Research reports a solid 7.2% earnings surprise quarter through May 9, 2023.
- However, results weren't positive across the board. This article evaluates S&P 500 sales and earnings surprises at the company and industry level, taking both a value- and equal-weighted approach.
- The biggest changes were seen among Utilities and Application Software stocks. Unlike last quarter, safe stocks lagged while riskier ones surprised to the upside, giving new hope to growth investors.
- In contrast, there may be significant upside for stocks in the Household Products and Restaurant industries. However, high P/Es are concerning.
- Generally, mega-cap stocks turned it around this quarter. I suggest holding SPY rather than taking short-term profits, as the positive earnings surprise scores support a bullish market.
- Looking for a portfolio of ideas like this one? Members of Hoya Capital Income Builder get exclusive access to our subscriber-only portfolios. Learn More »
Scott Olson/Getty Images News
Introduction: The Value of Earnings Surprises
Gauging market sentiment is crucial when deciding whether to tilt your portfolio toward value or growth stocks. One way I measure market sentiment is by evaluating quarterly earnings surprises. Yardeni Research tracks them in aggregate for S&P 500 Index constituents. As shown below, earnings surprise trends help explain the Great Financial Crisis and recoveries in 2008-2009, the rise in riskier, high P/E stocks in 2020-2021, and their subsequent fall in 2022. I like this approach because it's data-driven and simple to interpret. It's also logical because analysts are more likely to upgrade ratings on companies that routinely beat their expectations.
Yardeni Research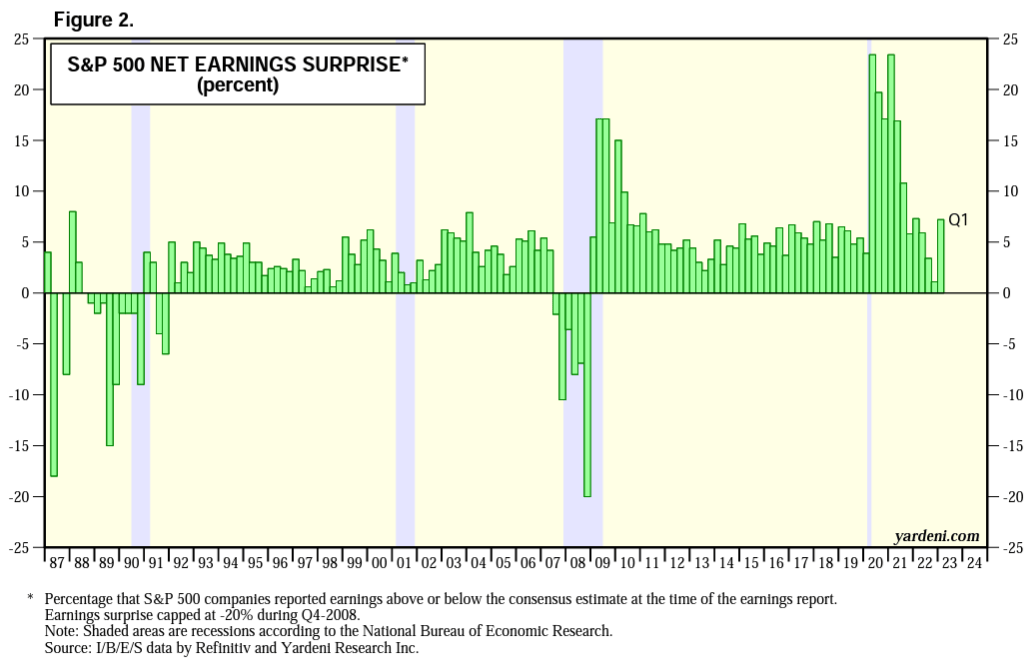
Understanding market sentiment is crucial. It's no coincidence that thematic ETFs like Cathie Wood's ARK Innovation ETF (ARKK) did so well in 2020 and crashed hard in 2022. It's the "theme," for lack of a better word, for these low-profitable portfolios. Consider how 12 thematic ETFs with poor profitability scores (derived using Seeking Alpha Factor Grades) did between 2019 and 2023 YTD through April.
The Sunday Investor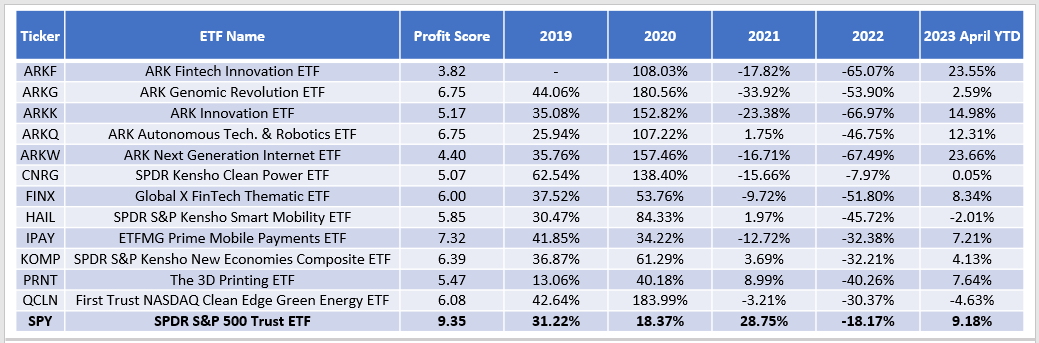
Except for the SPDR Kensho Clean Power ETF (CNRG), all outperformed in 2020, gave back some gains in 2021, then declined in 2022. However, many are outperforming the SPDR S&P 500 ETF (NYSEARCA:SPY) YTD. Look no further than the 7.2% earnings surprise figure posted for Q1 2023. It's the best result in a year, and although far off the 23.1% figure for Q1 2021, it gives speculative investors hope. One quarter isn't a trend, but maybe fundamentals won't matter much again soon.
Yardeni Research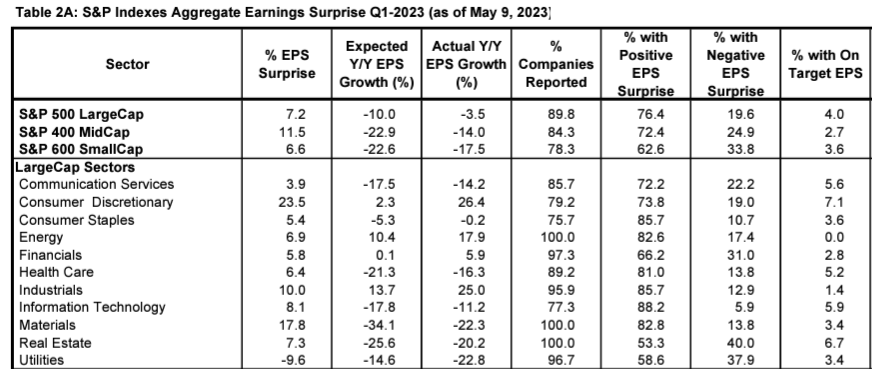
Positive aggregate earnings surprise figures are across all sectors except Utilities. Consumer Discretionary (23.5%), Materials (17.8%), and Industrials (10.0%) are leading, but the picture looked quite different one year ago. Here is a screengrab of the same report on May 20, 2022. Instead of Utilities lagging, it was leading alongside Real Estate. It's a big reason why I recommended the sector in Q1 2022.
Yardeni Research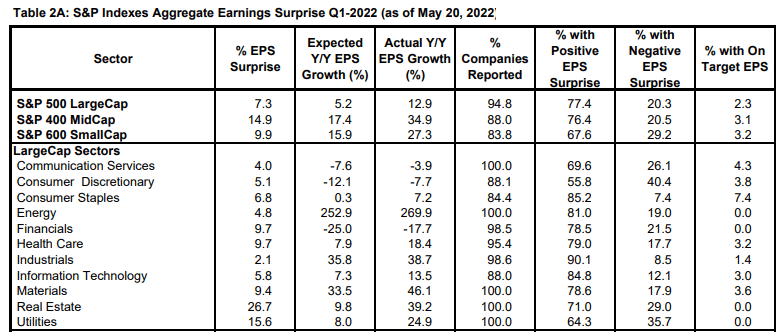
These changes suggest that what worked in 2022 likely won't work again in 2023. So let's dive deeper. Using Seeking Alpha data, I've created the following three tables:
1. A fundamental snapshot of SPY's top 25 holdings, including quarterly sales and earnings surprises, expected sales and earnings growth rates, price-earnings ratio, and Seeking Alpha's EPS Revision Grades (normalized on a ten-point scale).
2. Value-weighted sales and earnings surprise data for SPY's top 25 industries. A comparison with last quarter's figures is included to help identify which industries have turned things around.
3. Equal-weighted sales and earnings surprise data for RSP's top 25 industries.
Through the article, I'll list some ETFs that overweight the industries I've highlighted. With that said, let's get started.
SPY Fundamental Snapshot
The weighted-average earnings surprise for SPY's constituents last quarter was 8.45% compared to the 7.20% aggregate figure quoted earlier. A higher weighted-average figure indicates that mega-cap stocks like Apple (AAPL), Microsoft (MSFT), and Alphabet (GOOGL) are back in fashion, which the table below confirms. This quarter saw huge turnarounds for all the top mega-caps. Microsoft and Alphabet posted 9-10% earnings surprises, Amazon (AMZN) surprised to the upside by 43.26%, and Meta Platforms (META) rebounded from a 21.14% earnings miss the prior quarter to a 13.07% positive surprise on April 26, 2023.
Chart Source: The Sunday Investor; Data Source: Seeking Alpha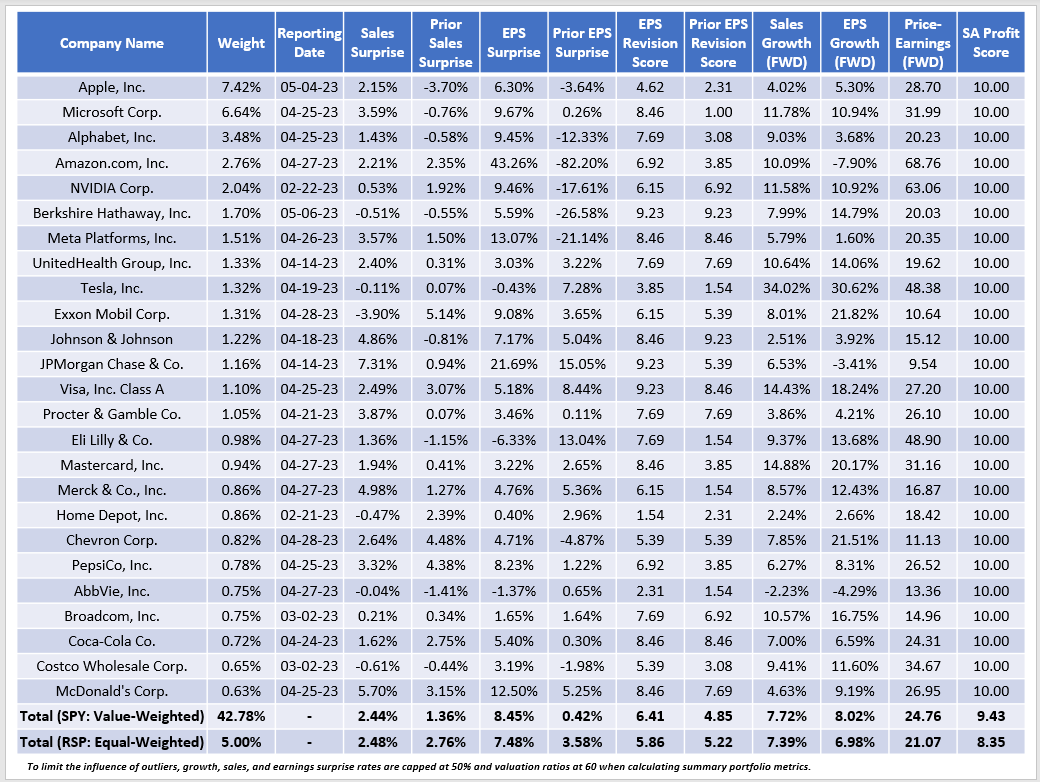
The prior column data is sourced from Seeking Alpha data as of February 28, 2023, and you can see how the equal-weighted S&P 500 Index had superior numbers. The Invesco S&P 500 Equal Weight ETF (RSP) had the edge on sales surprises (2.76% vs. 1.36%), earnings surprises (3.58% vs. 0.42%), and the EPS Revision Score (5.22/10 vs. 4.85/10), which reflects consensus Wall Street analyst estimate changes. We see these statistics reflected in the price charts of the two ETFs, too. RSP broke away from SPY in November, but SPY took the lead in March.
Seeking Alpha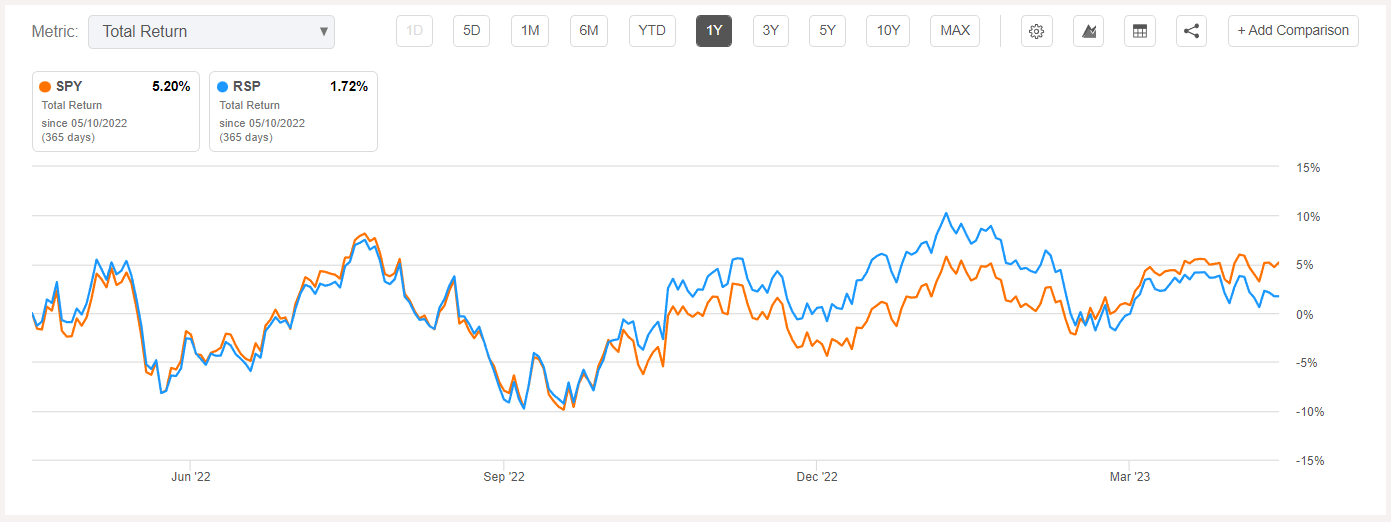
In short, advantage mega-caps. They're highly profitable and are generally excellent long-term holdings, especially if held in a diversified basket like SPY. I don't recommend selling because I think the mega-caps can ride this earnings momentum wave until the next earnings season begins.
Value-Weighted Sales and Earnings Surprises
Most analysts don't evaluate ETFs by industry, but it's a nice balance between company- and sector-level analysis. The reason is because there are often substantial differences between industries in the same sector. For example, most Financial Services stocks have low-single-digit return on asset ratios and above-average betas, like those in the regional and diversified banking industry. In contrast, lower-beta industries like Financial Exchanges & Data have ROAs closer to 8%. With the March changes to Global Industry Classification Standards, add Visa (V) and Mastercard (MA) (Transaction & Payment Processing Services) to that higher ROA group.
SPY's top 25 industries cover two-thirds of the fund. Therefore, it gives us a good idea of what we hold in an easy-to-digest format. The table below highlights the same fundamental metrics as before but includes the industry's five-year beta to help separate the risky and safer plays.
Chart Source: The Sunday Investor; Data Source: Seeking Alpha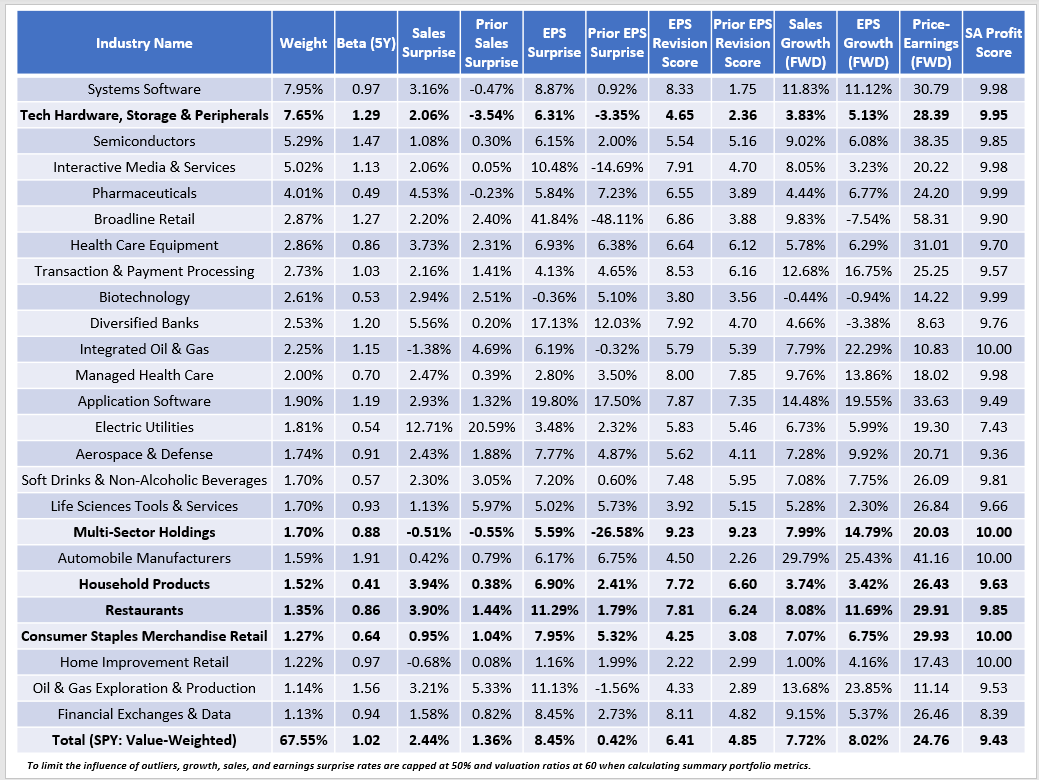
I've bolded the five industries with the biggest turnarounds in value-weighted sales and earnings surprises. Here are the critical stocks within each:
- Technology Hardware, Storage & Peripherals: Apple
- Multi-Sector Holdings: Berkshire Hathaway (BRK.B)
- Household Products: Procter & Gamble (PG), Colgate-Palmolive (CL)
- Restaurants: McDonald's (MCD), Starbucks (SBUX)
- Consumer Staples Merchandise Retail: Costco (COST), Walmart (WMT)
I like these types of stocks because they're all highly profitable. Berkshire Hathaway, McDonald's, and Starbucks all have double-digit expected earnings growth rates and betas below one, indicating below-average volatility. The key downside is a valuation approaching 30x forward earnings in most cases. Still, as discussed earlier, fundamentals matter less when market sentiment is positive. However, I require at least two consecutive quarters of above-average earnings surprises, so I'm only cautiously optimistic.
Equal-Weighted Sales and Earnings Surprises
You may feel uncomfortable with market-cap-weighted ETFs. Valuation ratios have crept back to uncomfortable levels in recent months, and we're still dealing with core inflation up 5.5% year-over-year after Wednesday's CPI release. RSP is one alternative, and I've calculated the same metrics as above for its top 25 industries, which total 48% of the fund.
Chart Source: The Sunday Investor; Data Source: Seeking Alpha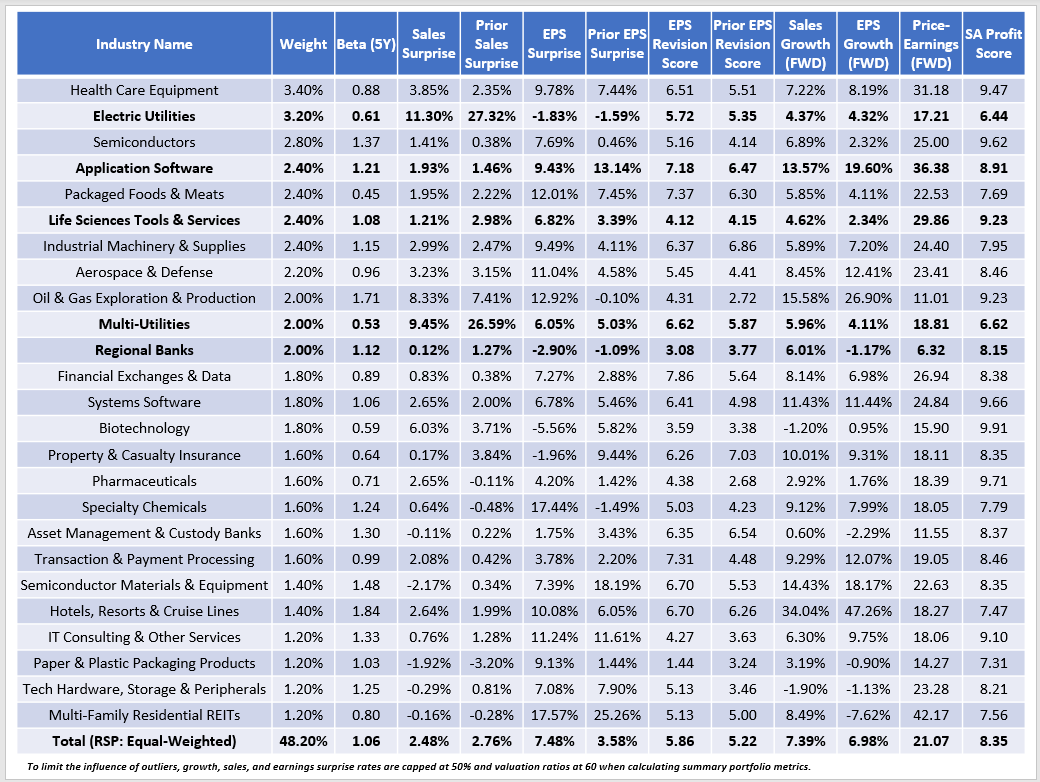
This time, I bolded the five industries with the most negative changes in sales and earnings surprises from the last quarter. Electric Utilities easily tops the list. All reported in late April or early May, with the following EPS surprises:
- NextEra Energy (NEE): 10.02%
- The Southern Company (SO): 11.62%
- Duke Energy (DUK): -4.90%
- American Electric Power Company (AEP): -0.82%
- Exelon (EXC): 6.03%
- Xcel Energy (XEL): 2.98%
- PG&E (PCG): 0.79%
- Edison International (EIX): 11.50%
- Eversource Energy (ES): 4.93%
- Entergy (ETR): -17.38%
- FirstEnergy (FE): -1.64%
- PPL Corporation (PPL): 5.58%
- Evergy (EVRG): 1.72%
- Alliant Energy (LNT): -7.90%
- Pinnacle West Capital (PNW): NM
- NRG Energy (NRG): -41.00%
In addition, Multi-Utilities suffered an enormous sales surprise decline from last quarter. The average sales surprise is still high at 9.45%, but the downward trend is concerning. For now, neither the value- nor equal-weighted RYU and XLU ETFs were impacted. However, I believe it's only a matter of time. Furthermore, I don't expect much downside protection either. As described in this article on the Invesco S&P 500 Low Volatility ETF (SPLV), the Utilities sector has a mixed history in recessions. The reason is that investors seek high-quality stocks in uncertain environments. The profitability scores for the Electric and Multi-Utilities industries listed in the table above indicate they don't fit the bill.
The Application Software industry is another one I bolded primarily for its declining earnings surprise trends (13.14% to 9.14%). Again, the earnings surprise figure is above-average, but the downward trend and the industry's 36.38x forward earnings valuation are red flags. Here are the earnings surprises for the 12 stocks in this industry:
- salesforce.com (CRM): 23.38%
- Intuit (INTU): 52.64% (Q4 2022)
- ServiceNow (NOW): 16.43%
- Cadence Design Systems (CDNS): 2.97%
- Roper Technologies (ROP): 1.25%
- Autodesk (ADSK): 2.64% (Q4 2022)
- ANSYS (ANSS): 14.85%
- Fair Isaac (FICO): -5.14%
- Tyler Technologies (TYL): 4.02%
- Paycom Software (PAYC): 4.20%
- PTC (PTC): 0.78%
- Ceridian HCM (CDAY): -2.19%
Once Intuit reports on May 23, 2023, I expect the average figure to decline to the low single digits. It may cause Wall Street analysts to re-evaluate how realistic their 13.57% and 19.60% estimated sales and earnings growth rates are and market participants to question why they're worth 36.38x forward earnings. Along with the industry's high 1.21 five-year beta, the Application Software industry is one I look to avoid. Many thematic ETFs like the ones presented earlier typically overweight these stocks. In addition, the First Trust NASDAQ-100-Tech ETF (QTEC) has about 20% exposure because it's an equal-weighted fund. Generally, the best way to limit exposure is to stick to plain-vanilla growth funds like VONG, SPYG, and MGK. I recently offered my thoughts on why VONG was excellent for long-term investors.
Life Sciences Tools & Services sales surprises declined by 1.77%, but earnings surprises improved by 3.43%, primarily because of Illumina (ILMN). To control for outliers, I limit the range of earnings surprises and growth rates between -50% and 50% when calculating summary statistics. I also cap valuation ratios at 60, similar to Morningstar's method.
Chart Source: The Sunday Investor; Data Source: Seeking Alpha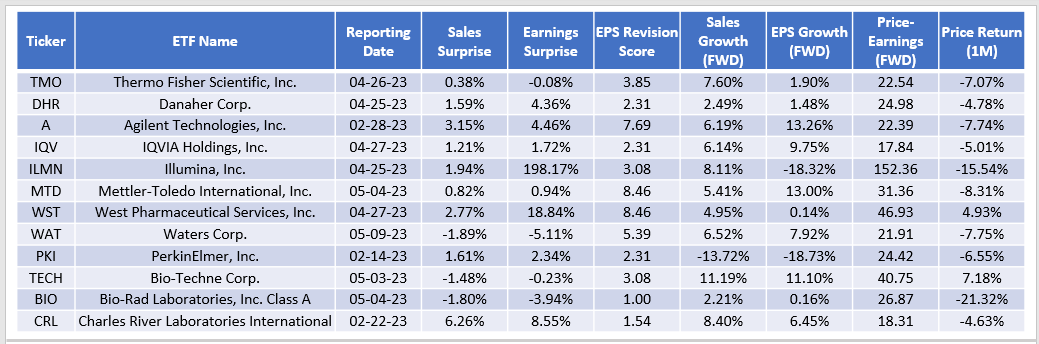
These stocks trade at 29.86x forward earnings and have low single-digit average growth rates, which isn't a great combination. All but two (WST, TECH) are down over the last month, and the industry's 4.12 average EPS Revision Score suggests a turnaround is not imminent. I found five ETFs with substantial exposure to this industry that you should avoid.
- iShares Nasdaq Biotechnology ETF (IBB)
- iShares U.S. Medical Devices ETF (IHI)
- First Trust NYSE Arca Biotechnology ETF (FBT)
- Invesco S&P 500 Equal Weight Health Care ETF (RYH)
- Pacer BioThreat Strategy ETF (VIRS)
Finally, poor results in the Regional Banking industry should be familiar to everyone. I recently covered the ALPS O'Shares U.S. Small-Cap Quality Dividend ETF (OUSM), and it uses a 100% ROA screen when selecting Financial Services stocks. As a result, the ETF avoided the mess and has outperformed most other small-cap value funds since.
Only ten qualified for the S&P 500 Index, and they all trade close to their 52-week low prices. The average ROA is currently 1.17%, slightly up from 1.13% on March 1, 2023. Most fall into the small- and mid-cap segments, and I recommend value investors check to see if their ETF has high exposure to this industry. Naturally, ETFs like the SPDR Regional Banking ETF (KRE) are heavily exposed. However, so are the following five value funds, some of which may surprise you:
- iShares Russell 2000 Value ETF (IWN)
- WisdomTree U.S. SmallCap Dividend ETF (DES)
- ProShares Russell 2000 Dividend Growers ETF (SMDV)
- Invesco S&P SmallCap Low Volatility ETF (XSLV)
- Invesco S&P 500 Equal Weight Financials ETF (RYF)
It's one instance where alternative weighting schemes weren't helpful. SPY has just 0.52% exposure, so if you stick mainly with plain vanilla funds, you likely weren't impacted. Some investors run into trouble when they buy "value" funds without considering profitability. Seeking Alpha provides profitability grades for nearly all U.S. equities, so it's a simple check you can do to determine quality.
Summary
Tracking earnings surprise trends is an excellent way to gauge market sentiment. Low-profitable speculative stocks tend to outperform when earnings surprises are abnormally high, like in 2020-2021. In contrast, fundamentally strong companies do better when surprises trend downward. It's why many value- and dividend-focused ETFs outperformed last year, but SPY's aggregate 7.2% surprise in Q1 2023 is the best result in a year. It makes sense that markets reacted positively, but I prefer waiting an additional quarter to confirm the trend has reversed.
Equal-weight ETFs like RSP are a solution, but they may do more harm than good. Generally, assigning more weight to smaller companies means a lower profitability score, which is not helpful in a recession. One key finding is how earnings surprises for Electric and Multi-Utility stocks reversed course compared to last year. I doubt they will do well in a market downturn. Other industries with red flags include Application Software, Life Sciences Tools & Services, and Regional Banks. In contrast, stocks in the Household Products and Restaurant industries turned things around this quarter and have high EPS Revision Scores. Therefore, I expect them to outperform moving forward.
Thank you for reading, and if you enjoyed this article or are interested in seeing this analysis each quarter, please let me know in the comments section below.
The Sunday Investor Joins Income Builder
The Sunday Investor has teamed up with Hoya Capital to launch the premier income-focused investing service on Seeking Alpha. Members receive complete early access to our articles along with exclusive income-focused model portfolios and a comprehensive suite of tools and models to help build sustainable portfolio income targeting premium dividend yields of up to 10%.
Whether your focus is High Yield or Dividend Growth, we’ve got you covered with actionable investment research focusing on real income-producing asset classes that offer potential diversification, monthly income, capital appreciation, and inflation hedging. Start A Free 2-Week Trial Today!

This article was written by

I perform independent fundamental analysis for over 850 U.S. Equity ETFs and aim to provide you with the most comprehensive ETF coverage on Seeking Alpha. My insights into how ETFs are constructed at the industry level are unique rather than surface-level reviews that’s standard on other investment platforms. My deep-dive articles always include a set of alternative funds, and I am active in the comments section and ready to answer your questions about the ETFs you own or are considering.
My qualifications include a Certificate in Advanced Investment Advice from the Canadian Securities Institute, the completion of all educational requirements for the Chartered Investment Manager (CIM) designation, and a Bachelor of Commerce degree with a major in Accounting. In addition, I passed the CFA Level 1 Exam and am on track to become licensed to advise on options and derivatives in 2023. In November 2021, I became a contributor for the Hoya Capital Income Builder Marketplace Service and manage the "Active Equity ETF Model Portfolio", which as a total return objective. Sign up for a free trial today! Hoya Capital Income Builder.
Analyst’s Disclosure: I/we have a beneficial long position in the shares of SPY, MSFT, WMT, BRK.B either through stock ownership, options, or other derivatives. I wrote this article myself, and it expresses my own opinions. I am not receiving compensation for it (other than from Seeking Alpha). I have no business relationship with any company whose stock is mentioned in this article.
Seeking Alpha's Disclosure: Past performance is no guarantee of future results. No recommendation or advice is being given as to whether any investment is suitable for a particular investor. Any views or opinions expressed above may not reflect those of Seeking Alpha as a whole. Seeking Alpha is not a licensed securities dealer, broker or US investment adviser or investment bank. Our analysts are third party authors that include both professional investors and individual investors who may not be licensed or certified by any institute or regulatory body.