Horizon Kinetics - AMD: A Business Model Input/Output Review

Summary
- In the past several years, AMD has been the best performing major technology stock.
- What is the basis for the AMD extraordinary share performance in the past several years?
- AMD is an exemplar for how important the fundamental financial characteristics of the business model are to a rationally expected long-term return.
JHVEPhoto
The following segment was excerpted from this fund letter.
Advanced Micro Devices (NASDAQ:AMD): Isn’t It Wonderful! (Isn’t it?)…
Here’s what people see, remember and act upon. In the past several years, AMD has been the best performing major technology stock. It’s outperformed Apple (AAPL), Amazon (AMZN), Google (GOOG, GOOGL) , META (Facebook) and Nvidia (NVDA).
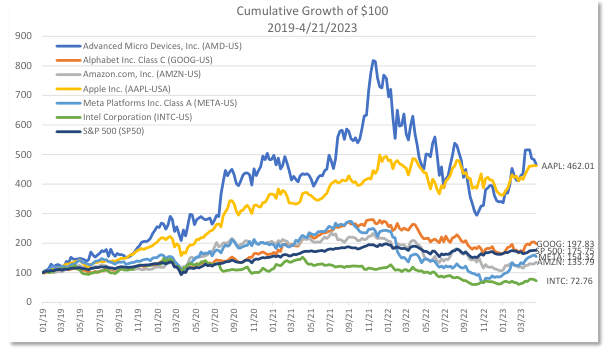
Source: Factset
It’s even—FINALLY—beat the pants off Intel. At least in share price performance, market cap and S&P 500 weight.
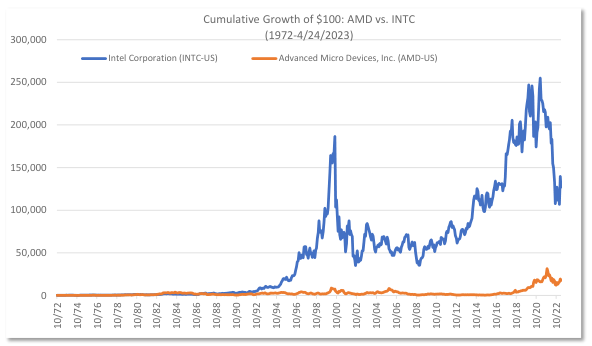
Source: Factset
You’d never want to buy it, though. At least not if you want any reasoned confidence in earning an acceptable long-term return. At least I wouldn’t. You can make up your own mind with this simple listing of historic facts. As these facts are recited, the internal question might be – as if you didn’t know the name of the company or its industry – would you wish to commit long-term investment capital to this business? You won’t find these facts listed on your favoured financial news website or accompanying any earnings estimates.
- Over the course of 30 years, from 1991 to 2021, AMD produced $150 billion of revenues.
- Its cumulative free cash flow over the three decades was a negative $(4.7) billion. Keep that last number in mind for a moment.
- The company’s market cap 30 years ago, at the beginning of the period, was $1.7 billion. Even at the peak of the dotcom bubble in 2000, its $5.2 billion market valuation was only slightly above its cumulative losses. Its market value 20 years later, in 2011, was $4.0 billion, still less than its cumulative losses.
- Free cash flow losses were experienced in 12 out of the last 30 years, 40% of the time, meaning that’s the norm for this business.
- In the most recent 10 years, there was actually $3.0 billion of net free cash from operations. However, it all came in just one year, $3.2 bill in 2021, which offset cumulative losses in the prior nine years.
How does a business like that that even work?
- Of the $150 billion of revenues over three decades, AMD used $33 billion for R&D and $17 billion for capital expenditures. That totals $50 billion of expenditures, which is one-third of revenues, even before paying salaries and other operating expenses.
- Looked at from another angle, the company’s basic operating margin averaged 1.2%. That’s before capital expenditures, but this is a highly capital-intensive business that requires continual upgrading of the manufacturing facilities just to stay in business.
- Therefore, on a structural basis, the company must periodically secure significant external funding, or it could not continue to operate.
But why would investors fund such a business?
- Presumably, they believe that the investment in R&D and capital expenditures will produce a sufficient financial return – from newer, faster semiconductor chips, and all that. Under that presumption, the extremely volatile business results and share price could be viewed in a positive light, that it’s ok to pay for optionality.
- As to the external funding, the company conducted two stock offerings during this period:
- In a $496 million offering in Jan 2006, 14 million shares were sold at $35.20.
- Three years later, at year-end 2008, the share price was $2.15, and AMD’s market cap was only $1.3 billion, even though it had raised almost $500 million.
- Ten years after the offering, at year-end 2015, the shares were still only $2.87, 92% lower than the offering price.
- The annualized stock price appreciation from that 2006 offering to today's $75 price, over 16 years, is 4.6%/year.
- In a $690 million offering in September 2016, 115 million shares were sold at $6.00 each, increasing the share count by 14%. In this case, the annualized share price return from the offering to year-end 2021 was indeed a spectacular 81%.
- Another source of earnings dilution was from stock compensation. As of year-end 2021, unrecognized compensation expense related to time-based restricted stock units (that is, not including other stock-based compensation) was $704 million, to be recognized over about two years. This may be compared with the company’s aggregate free cash flow in the prior two years, 2020 and 2019, which totalled $1,564 million. Between external equity funding and stock compensation, the share count increased 6.4x over the 30-year period, which equates to 6.4%/year. That required 6.4% annualized earnings growth merely to avoid shareholder dilution and maintain a financial return of zero.
- In a $496 million offering in Jan 2006, 14 million shares were sold at $35.20.
- Then, what is the basis for the AMD extraordinary share performance in the past several years?
- Annual sales growth shifted from -28% in 2015, to positive, reaching 45% in 2020 and 68% in 2021.
- The operating margin rose from two negative years, –8.7% and –10.9%, to positive, reaching 14.0 and 22.1% in 2020 and 2021.
- The Price/Sales valuation multiple expanded from 0.4x in 2015 to 10.8x.
- The multiplicative result was a stock market cap that rose from $2.25 billion to $177 billion. Perhaps these figures demonstrate that AMD is finally a sustainable growth company. They are strikingly similar, though, to what occurred 20 years ago, between 2002 and 2005, the last time the shares peaked:
- At that time, revenue growth rose from –30.7% to positive 42.1%.
The essence of the share price returns and popularity of AMD stock in the past several years is that the valuation multiple expanded 27x, from 0.4x revenue in 2015, to 10.8x in 2021. Which is to say that the return really came from people’s behaviour, not from the business.
Even today, with the share price down 45% from year-end 2021, AMD trades at 5.6x trailing revenue, The 30-year average valuation is less than half that: 2.1x.
- The AMD market cap expanded by 16.8%/year over 30 years, but per-share revenue at only a 2.3% rate.
- The share price appreciated by 6.3%/year, but most of that came in the past four years or so. For the 26 years through year-end 2018, the figure was only 1.1%.
- Some would assert that, as an important technology company, irrespective of these figures, there were periods when AMD nevertheless provided a more than adequate return. A question in response: what proportion of investors during the past 30 years would have held the shares long enough so as to see that return? Here are some statistics that might suggest an answer.
- There were nine calendar years of stock price declines of more than 30%, and three of those were sequential. Twenty-four years after the start of this period, the shares were two-thirds lower than at the beginning.
- There are trading statistics. In 1991, at the beginning of this period, and before high-frequency trading came to dominate volumes, AMD’s share turnover was 175% for the year. In 2001, annual turnover was 467%. It’s higher than that now.
There might in fact be some exceedingly marginal proportion of investors who would have held the shares, who didn’t sell them after some dramatic decline, after 10 or 20 years of flat or negative return, or opportunistically at some interim peak. But, that simply means that the balance of the AMD shareholders—meaning virtually all of them—could not have achieved any compounding from AMD. They would have had to wait for the final two of the 30 years.
AMD Business Model Review
- There are many ways to invest, and there must surely be investors who can repeatedly trade profitably in the AMD shares, but AMD is NOT a growth company - nothing like it. It's not even a profitable business. Going strictly by the numbers, it’s a vehicle to take in permanent capital on the stock optionality of a couple of good operational years, but the business turns the capital into a financial loss. Without billions of dollars of capital infusions to finance those losses, it would not have been able to stay in business.
- Because it does not produce a repetitive positive financial return, its intrinsic value cannot compound over time. Persistent compounding is one of the most powerful financial forces – both as a wealth builder and as a wealth destroyer. After all, inflation’s corrosive impact is generated by persistent long-term compounding: a 7% annual increase in the price of a $5,000/month apartment rental doesn’t become becomes, linearly, $12,000 after 20 years, but $19,350, which is 60% greater.
- But compounding requires a very long unbroken holding period, so as to allow the process to occur. Trading out of it and back in means the compounding period must start over.
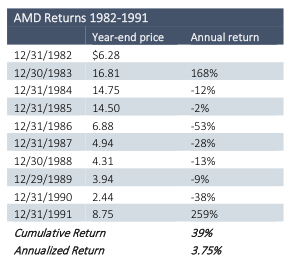
- One more note about AMD before we turn to the longest-lived business model. It’s not as if investors in 1991 couldn’t know that AMD was a financial loss-making business model. Here are the company’s summary returns for the decade before 1991. They are almost numerically identical to all that followed in the ensuing 30 years.
- Aaaand, to complete the central thought, this exercise was not about AMD. It could have been about an equally famous retailer or auto manufacturer that has been in existence for generations and is therefore deemed to be successful. AMD was merely an exemplar for how important the fundamental financial characteristics of the business model are to a rationally expected long-term return. That will probably be more important in the next decade or two than in the past few.
This proposition can be somewhat generalized in the form of the iShares U.S. Technology ETF (IYW).
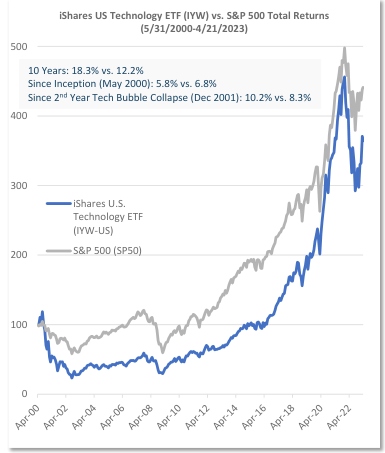
Most people probably think of technology sector profitability as exemplified by the 18.3% 10-year annualized return of this index. But its almost 23-year rate of return, since its May 2000 inception, is only 5.8%. IYW did no better than the S&P 500. The starting point might be a bit harsh, though, since May 2000 was near the moment when the Technology Bubble began its collapse. A more generous start would be at the end of the 2nd year of the Technology Bubble collapse, year-end 2021, by which time IYW had fallen 54%. The return from that point to now, 21+ years, is an annualized 10.0%. That 10% includes the very influential impact of IT companies that did demonstrate remarkably high, and sustainably high, profitability business models: Apple, Microsoft and Alphabet (Google) comprise 46% of the iShares U.S. Technology ETF. The only reason for belabouring this is because high, chronic inflation is very, very likely before us, and what makes it such a powerful destroyer of wealth is that it is a continual, persistent price level compounder. One of the tools for fighting it is in-kind, to own continual, persistent value compounders.
IMPORTANT RISK DISCLOSURES:The charts in this material are for illustrative purposes only and are not indicative of what will occur in the future. In general, they are intended to show how investors view performance over differing time periods. Past performance is not indicative of future results. The information contained herein is subject to explanation during a presentation. Certain of the material herein is intended to portray the general nature of investor communications provided by Horizon Kinetics from time to time to existing clients. None of the investments or strategies referenced should be construed as investment advice and just because one investment is appropriate for one account does not necessarily mean it is appropriate for another. No investments should be made without the analysis of, among other things, an investor’s specific investment objectives, which considers their overall portfolio and any income requirements. The accounts referenced herein pursue an unconstrained strategy – meaning they are not limited by capitalization, geographic region, or investment techniques. They generally primarily seek capital appreciation with a secondary objecti of income. Note that indices are unmanaged, and the figures shown herein do not reflect any investment management fee or transaction costs. Investors cannot directly invest in an index. References to market or composite indices or other measures of relative market performance (a “Benchmark”) over a specific period are provided for your information only. Reference to a Benchmark may not reflect the manner in which a portfolio is constructed in relation to expected or achieved returns, portfolio guidelines, correlation, concentrations, volatility or tracking error targets, all of which are subject to change over time. This material references cryptocurrencies, including bitcoin. Horizon Kinetics’ subsidiaries manage products that seek to provide exposure to bitcoin and other cryptocurrencies. The value of bitcoins is determined by the supply of and demand for bitcoins in the global market for the trading of bitcoins, which consists of transactions on electronic bitcoin exchanges (“Bitcoin Exchanges”). Pricing on Bitcoin Exchanges and other venues can be volatile and can adversely affect the value of the bitcoin. Currently, there is relatively small use of bitcoins in the retail and commercial marketplace in comparison to the relatively large use of bitcoins by speculators, thus contributing to price volatility that could adversely affect a portfolio’s direct or indirect investments in bitcoin. Bitcoin transactions are irrevocable, and stolen or incorrectly transferred bitcoins may be irretrievable. As a result, any incorrectly executed bitcoin transactions could adversely affect the value of a portfolio’s direct or indirect investment in bitcoin. Only investors who can appreciate the risks associated with an investment should invest in cryptocurrencies or products that offer cryptocurrency exposure. As with all investments, investors should consult with their investment, legal and tax professionals before investing, as you may lose money. The S&P 500 Index (SPX) is a broadbandd index widely considered as a proxy for overall market performance. It is the property of Standard & Poor’s ®. This is not an offer to sell or a solicitation to invest. Opinions and estimates offered constitute the judgment of Horizon Kinetics LLC (“Horizon Kinetics”) and are subject to change without notice, as are statements of financial market trends, which are based on current market conditions. Under no circumstances does the information contained within represent a recommendation to buy, hold or sell any security, and it should not be assumed that the securities transactions or holdings discussed were or will prove to be profitable. Subsidiaries of Horizon Kinetics LLC manage separate accounts and pooled products that may hold certain of the individual securities mentioned herein. For more information on Horizon Kinetics, you may visit our website at www.horizonkinetics.com. The Core Value and Small Cap separate account strategies are managed by Horizon Asset Management LLC. Not all investors will experience the same holdings, returns or weightings as the corresponding composite. No part of the research analysts’ compensation was, is, or will be, directly or indirectly, related to the specific recommendatis or views expressed by the research analysts in this report. No part of this material may be copied, photocopied, or duplicated in any form, by any means, or redistributed without Horizon Kinetics’ prior written consent. ©2023 Horizon Kinetics LLC ® All rights reserved |
Editor's Note: The summary bullets for this article were chosen by Seeking Alpha editors.
This article was written by
