Robert Half: 20% To 30% Downside Risk In Recession

Summary
- The Bureau of Labor Statistics reported better-than-expected payrolls for April, but there are troubling signs in temporary staffing and revision trends.
- The U.S. labor market was red-hot in 2020-21 and is only just beginning to cool.
- RHI derives most of its revenues from temporary staffing services, which is a cyclical business that sees revenue decline in recessions.
- Wall Street isn't yet factoring in a likely recession or weakening labor market in RHI revenue estimates.
- Based on prior recession cycles and conservative estimates for RHI revenue declines, I see 20% to 30% downside risk in the stock this year.
SrdjanPav/E+ via Getty Images
At first glance, the April Employment Situation report from the U.S. Bureau of Labor Statistics (BLS) released on Friday May 5th looked strong.
The U.S. added 253,000 jobs in the month of April against the 185,000 Wall Street had expected while the unemployment rate fell to 3.4%, the lowest since the late 1960's.
However, look a bit harder at the data and the U.S. labor market is showing clear signs of weakening:
Revisions to Payroll Estimates (Bloomberg, Bureau of Labor Statistics)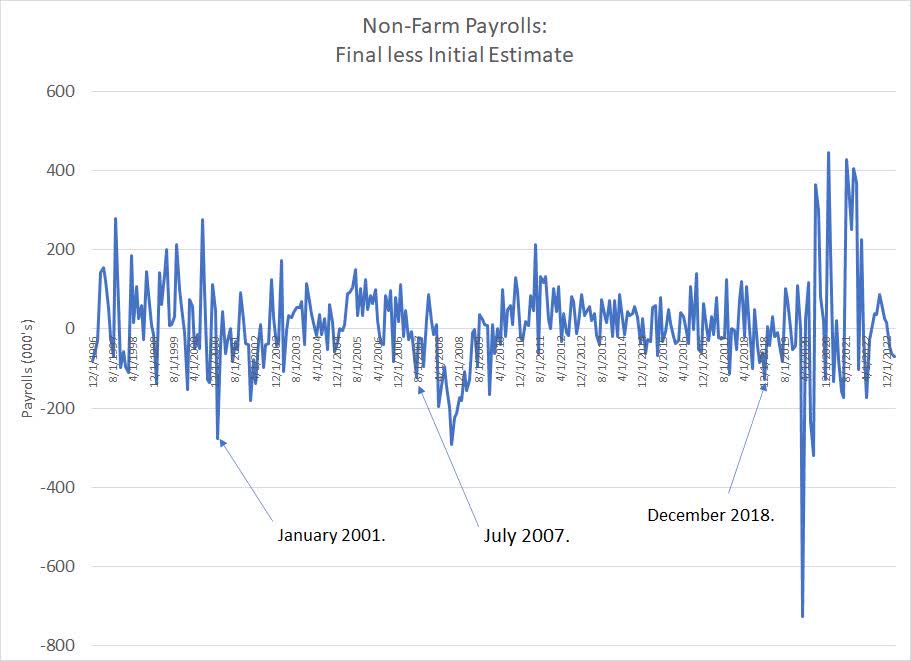
This chart shows BLS revisions to monthly changes in nonfarm payrolls since December 1996 - a positive number on this chart shows BLS ultimately revised its estimate for jobs growth higher while a negative number indicates a downside revision.
BLS usually releases its initial estimate for non-farm payrolls on the first Friday of each month and revises that initial estimate higher or lower in subsequent months. Each year, BLS also undertakes an annual benchmarking exercise that can result in significant revisions to monthly data for the prior year; that revision is released in February.
This chart shows the final estimate or most recent revision to each month's employment report less the initial estimate released in real time.
The biggest revisions in history occurred in 2020-21 amid coronavirus economic lockdowns and movement restrictions and subsequent economic reopening.
BLS monthly estimates are based on two surveys, the Household Survey of about 60,000 U.S. households and the Establishment Survey covering roughly 120,000 U.S. businesses. During lockdowns and subsequent reopening, BLS struggled with data collection and response rates to both surveys dropped sharply, reducing sample size and estimate reliability.
However, if you ignore the COVID distortions on the chart you can see that some of the biggest downside revisions to payrolls reports have tended to come just before and after the start of a U.S. recession. The list includes big downside revisions in late 2000 and early 2001 just ahead of the start of the 2001 recession; the National Bureau of Economic Research (NBER) dates that recession as starting in March 2001 and ending in November of the same year.
You can also clearly see major downside revisions to jobs numbers starting in the summer of 2007 with the scale of revisions growing significantly more negative in early 2008. That corresponds to the start of the December 2007 to June 2009 recession.
In Friday's better-than-expected release, BLS also announced a total of 149,000 in downside revisions to the prior two monthly reports. In total, the bureau has now revised estimates for every month through the first quarter of 2023 lower with the total estimate for Q1 2023 jobs growth seeing downside revisions of 179,000 from initial estimates.
These consistent, sequential downward revisions are characteristic of prior U.S. recession cycles visible and labeled on my chart. It's also consistent with the tendency for economic models - really models of any phenomenon based on a limited sample size - to be most wrong at key turning points.
Here's a second worrying trend:
Total Payrolls and Temporary Staffing (Bloomberg, Bureau of Labor Statistics)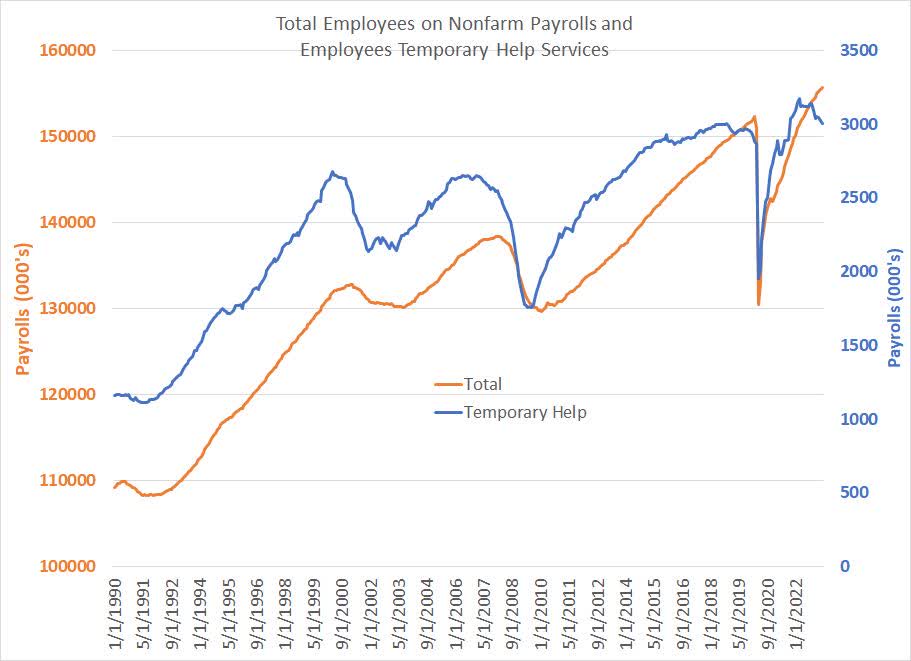
This chart shows total U.S. nonfarm payrolls since January 1990 (orange line, left-hand scale) and total U.S. employees of temporary help services (blue line, right-hand scale).
There are only a little over 3 million people employed through temporary help services in the U.S. out of a total of 155.673 million total payrolls, so it's a small part of the U.S. labor market. Note that to compare trends in these two series, I'm utilizing two scales - the left-hand scale for total payrolls and the right-hand scale for temporary help.
You can clearly see temporary employment tends to weaken and roll over ahead of trends in total U.S. payrolls.
That's logical because hiring or laying off full-time workers entails considerable costs finding suitable candidates, onboarding and training new employees, and ultimately paying severance costs. Thus, employers are loathe to turn to significant layoffs at the first signs of weakening demand and economic softness as a cost-cutting lever.
It's easier, and much cheaper, to adjust temporary payrolls to meet current demand conditions - scaling up temporary staffing in periods of higher demand and letting go of temps to cut costs as the economy softens and slumps into recession.
However, if weakness persists, employers are generally forced to pursue more draconian layoffs in an effort to cut costs.
You can see this trend in the 1999/2000 period - temporary staffing peaked at 2.681 million in April 2000 and declined almost 150,000 to 2.533 million in February 2001 even as overall U.S. payrolls rose by over 900,000 over a similar time period.
Only after the recession started in March 2001 did the U.S. begin to shed significant jobs - total payrolls fell by over 2.06 million from March 2001 to March 2002.
A similar trend is evident in 2007-08 when total temporary payrolls peaked in January 2007, followed a year later in January 2008 by total payrolls at which time the U.S. was already in recession according to NBER.
In the current cycle, temporary staffing peaked at a record 3.177 million payrolls in March 2022 and has declined by more than 174,000 jobs since that time even as the U.S. has added almost 4.25 million jobs overall according to BLS.
The bulk of the decline in temporary staffing has evidenced since October of last year and, if the traditional relationship holds, we should be looking for more meaningful weakness in overall payrolls by this autumn, roughly a year after temporary staffing began to weaken notably.
Regardless, it's crucial to remember the labor market is only just starting to weaken following a period of extraordinary strength:
The Great COVID Labor Shortage
As I noted earlier, the U.S. unemployment rate is at 3.4% the lowest since the late 1960s:
US Unemployment Rate (Bloomberg, Bureau of Labor Statistics)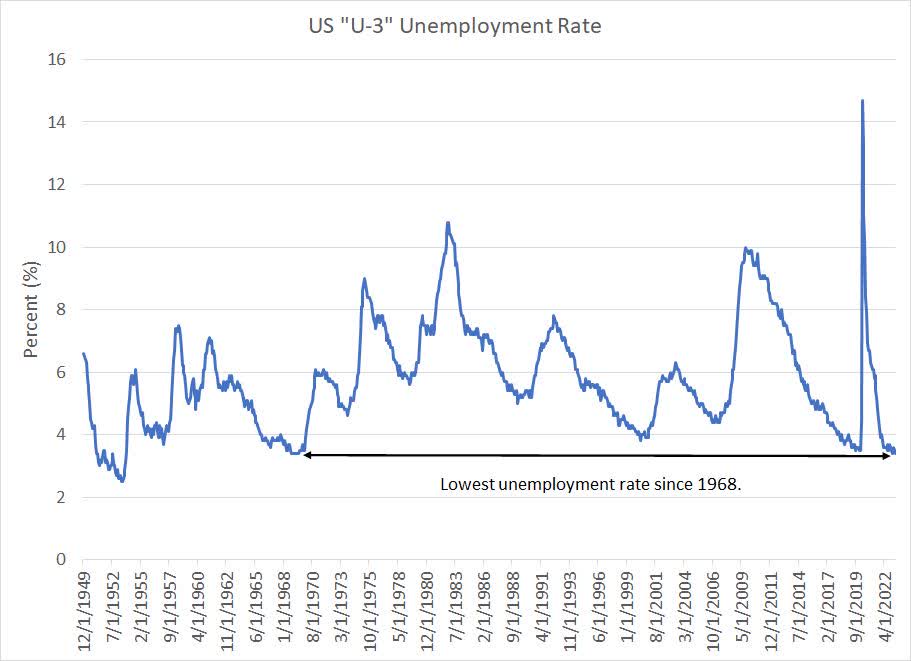
Historically the unemployment rate only begins to rise significantly after the start of a U.S. recession; however, the current level of 3.4% is the lowest since 1968. The low for unemployment in 2020 was 3.5% just ahead of COVID lockdowns, in 2000 it was 3.8% and in 2006-07 it was 4.4%.
With the pool of unemployed workers so small, businesses, particularly small employers, struggled to find qualified labor:
NFIB Job Opening Hard to Fill (Bloomberg, National Federation of Independent Business)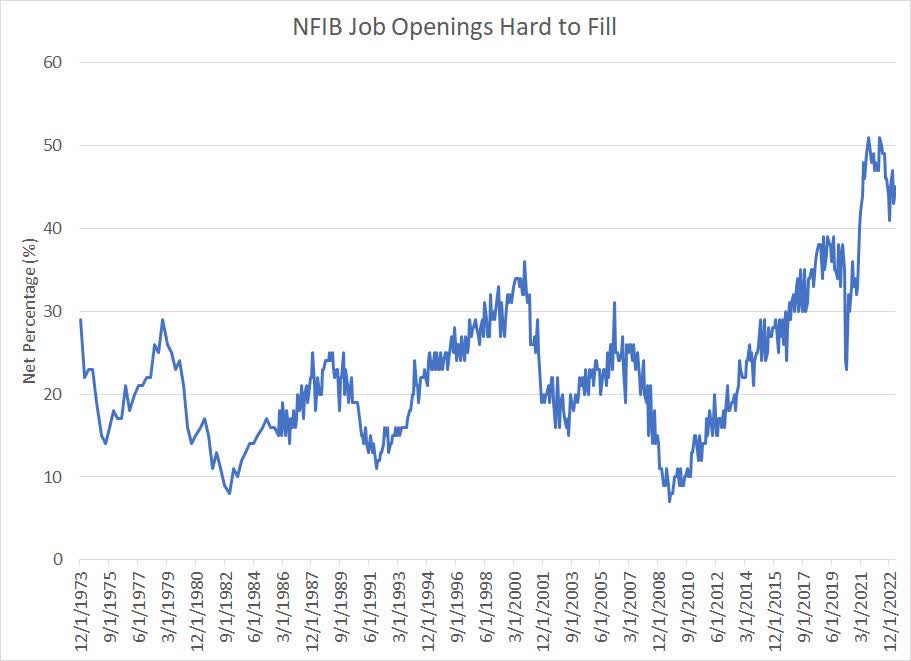
This data series is part of a monthly survey of small businesses conducted by the National Federation of Independent Business (NFIB) showing the net percentage of respondents reporting that it's difficult to fill job openings. In late 2021 and early 2022 this series hit levels of around 51%, the highest on record stretching back to the end of 1973.
While there has been some weakening in small businesses reporting positions are hard to fill, the current reading of 45.0 remains well above the peak levels of prior cycles in 2000, 2006-07 and 2019-20.
The monthly Job Openings and Labor Turnover Survey (JOLTS) release from BLS paints a similar picture:
Total US Job Openings (Bureau of Labor Statistics)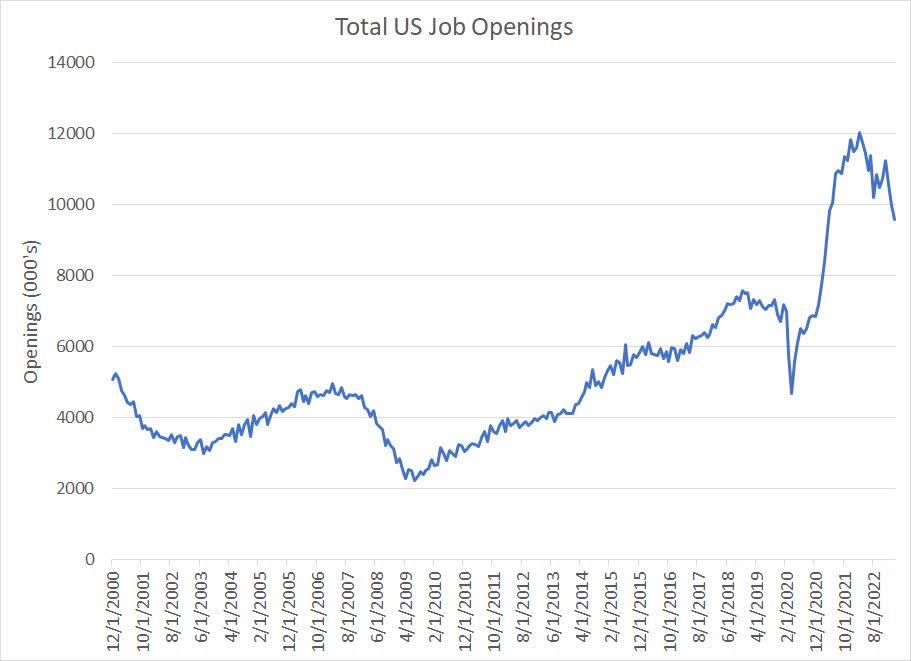
At the peak in March 2022, BLS reports there were more than 12 million job vacancies in the US, a record since BLS began collecting data in 2000. In the same month, there were only 5.972 million unemployed workers, meaning that there were more than 2 open jobs for every unemployed person in the country.
As of the latest JOLTS report, covering the jobs market as of March 2023, there were still 9.59 million unfilled job openings in the US, and some 1.65 jobs for every unemployed worker in the US. That's still well above prior peaks for the economy in cycles since 2000.
This has all been great news for staffing giant Robert Half International (NYSE:RHI).
Temporary and Permanent
Robert Half operates through three main business segments: Contract talent solutions, permanent placement talent and consulting business Protiviti.
Contract talent solutions is the company's largest business, accounting for just under 63% of 2022 revenues and about 58% of gross profit last year. This is the familiar temporary staffing business - RHI employs personnel in fields like finance and accounting, marketing, customer service and technology and pays them directly, contracting them out to customers on a temporary basis.
Customers of RHI pay the company a fixed rate based on the number of hours the temporary employee works.
The permanent placement services division chipped in an additional 10% of 2022 revenues and 23% of profit last year. RHI earns a fee for every candidate it places with an employer; the entire fee is paid by the employer and is based on the new employee's annual compensation.
Finally, Protiviti is RHI's consulting business, which generated more than 27% of revenues and roughly 18% of gross profit last year. This division helps customers with internal audit work, legal and technology consulting, and risk management.
The U.S. is RHI's largest market accounting for 79% of revenues last year with continental Europe accounting for about 9% of revenues, Canada at 4% and the United Kingdom at 2%.
The majority of the company's clients are small and mid-sized businesses (SMBs), which tend to have smaller in-house staffing and human resource departments and are underserved relative to larger businesses. This is also an enormous market:
Employment by Company Size (ADP National Employment Report)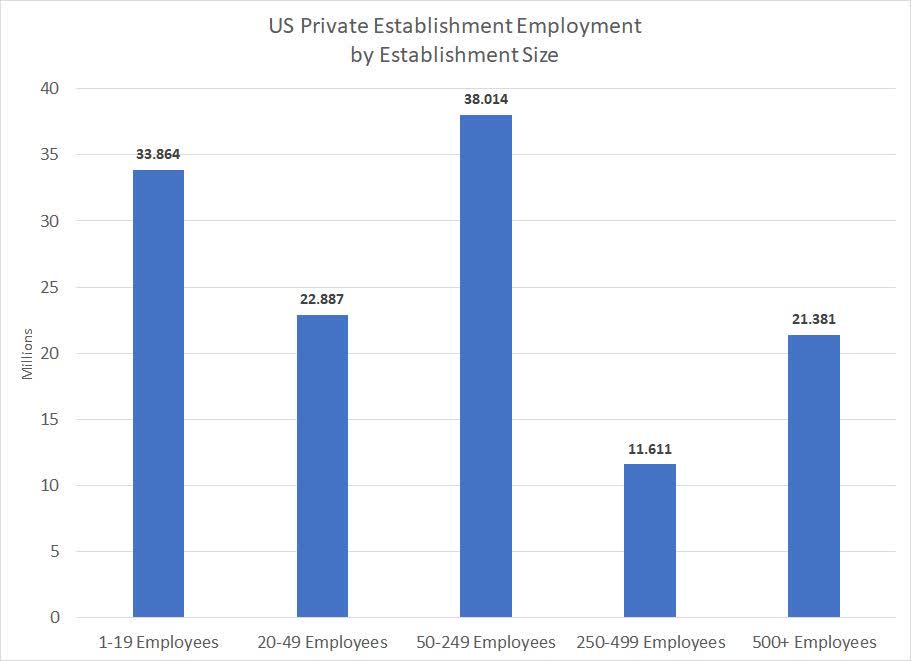
According to ADP, companies with less than 50 employees accounted for more than 44% of all private employment in the U.S. compared to less than 17% of total U.S. employment in establishments with more than 500 employees.
However, as you can imagine, RHI's core staffing businesses are also highly cyclical - when the economy is booming and businesses are hiring, the company can place more employees with jobs and charge higher hourly fees and wages to their customers.
Here's a look at staffing trends through the past several economic cycles:
Robert Half Staffing Revenues (Robert Half)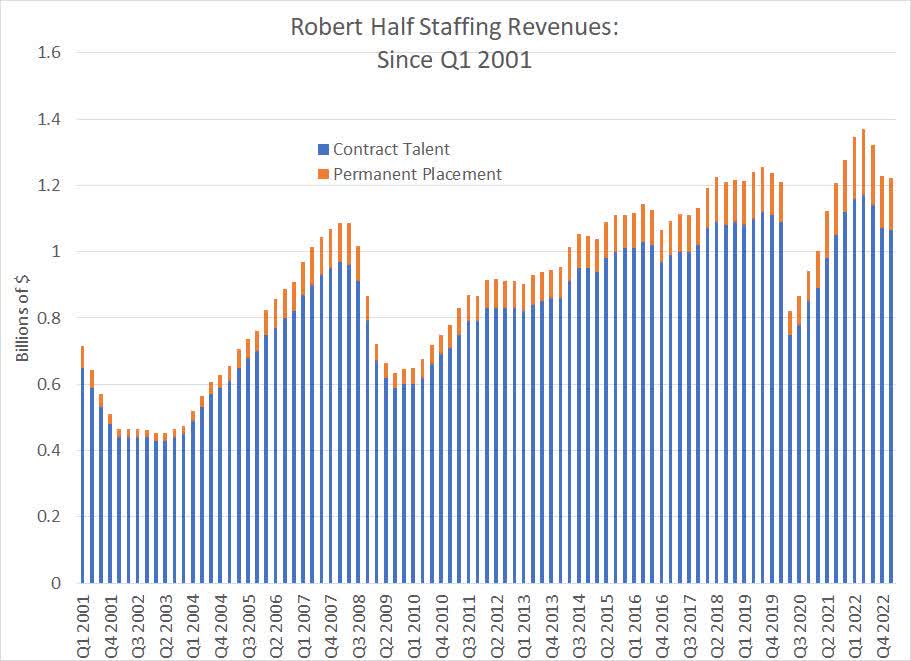
This chart shows quarterly revenues from RHI's two staffing businesses - contract/temporary placement in blue and permanent staffing in orange - since 2001.
Two points to note.
First, you can clearly see the cyclicality here with staffing revenues declining 36.8% between Q1 2001 and Q1 2003 amid the recession of 2001 and 41.8% between Q2 2008 and Q3 2009 amid the recession of 2007-09.
The 2020 recession is the shortest in U.S. history; however, RHI's staffing revenues still slumped 34.6% from a cycle peak of about $1.255 billion in Q3 2019 to a cycle low of $821 million in Q2 2020.
You can also see the cyclicality on the upside. In particular, the slow healing of the U.S. labor market coming out of the severe 2007-09 "Great Recession" and financial crisis led to a more subdued recovery in RHI revenues compared to the rapid rebounds following the 2001 and 2020 downturns.
And, the very tight labor market in 2021-22 drove a boom in RHI revenues, particularly in the permanent staffing business where revenues jumped 163.4% from the Q2 2020 nadir to the Q1 2022 cycle peak.
At the peak in Q1 2022, permanent staffing revenues were almost one-third higher that at the peak of the pre-COVID economic cycle in Q2 2019.
And that brings me to the second point - permanent staffing is a high margin, cyclical business. In a good year for the U.S. labor market such as 2006, 2015 or 2022 the operating profit margin for the company's permanent staffing business segment can approach or exceed 20%, roughly double the peak margins in the contract staffing business segment in the 10% to 11% range.
The lows are also lower for permanent staffing - in 2002 and 2009, RHI lost money in this segment and in 2020 their segment margin was 7.8%.
Protiviti Looks Less Cyclical
Protiviti, RHI's internal audit and consulting business, has been less cyclical than staffing over the last several cycles.
Take a look:
Protiviti Segment Revenues (Robert Half)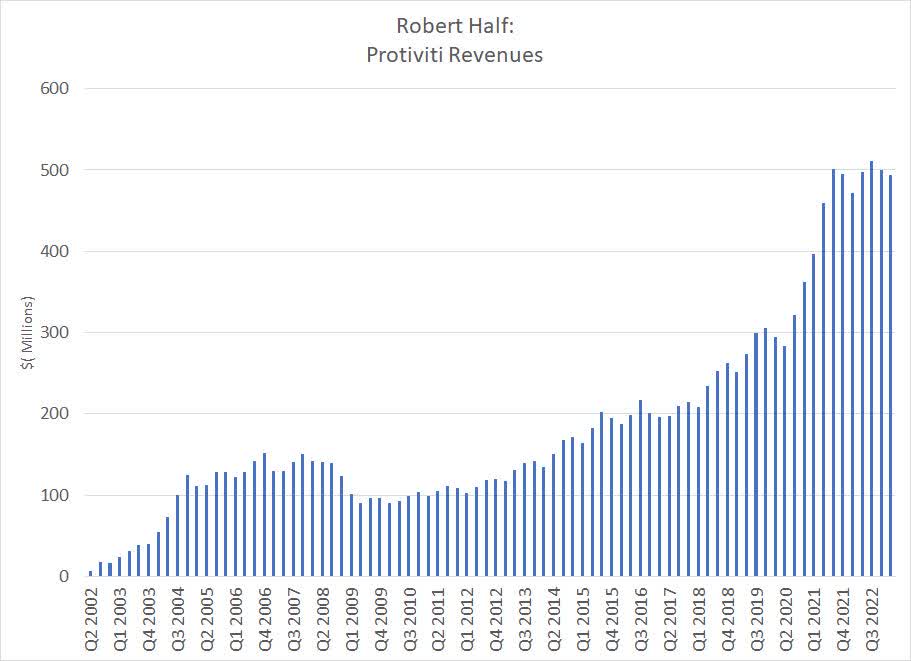
Protiviti was a relatively small segment of RHI's business during the 2007-09 recession and revenues did decline a little over 38% from high to low in that downturn.
However, since 2009 Protiviti has been a steady grower and barely saw a dip in revenues amid the 2020 recession while enjoying parabolic growth coming out of that downturn.
In Q1 2023, Protiviti accounted for $494.1 million in revenues, 28.8% of RHI's total sales compared to just $252.3 million in revenues, 17.2% of the total in Q1 2019 near the peak of the last cycle.
All Together Now
Historically, the scale of RHI's staffing segments - particularly its temporary staffing unit - has overwhelmed Protiviti during recessions.
That's left overall RHI revenue growth trends closely correlated to trends in U.S. temporary staffing payrolls:
Robert Half Revenue Growth and Temp Staffing Payrolls (Bloomberg, Bureau of Labor Statistics)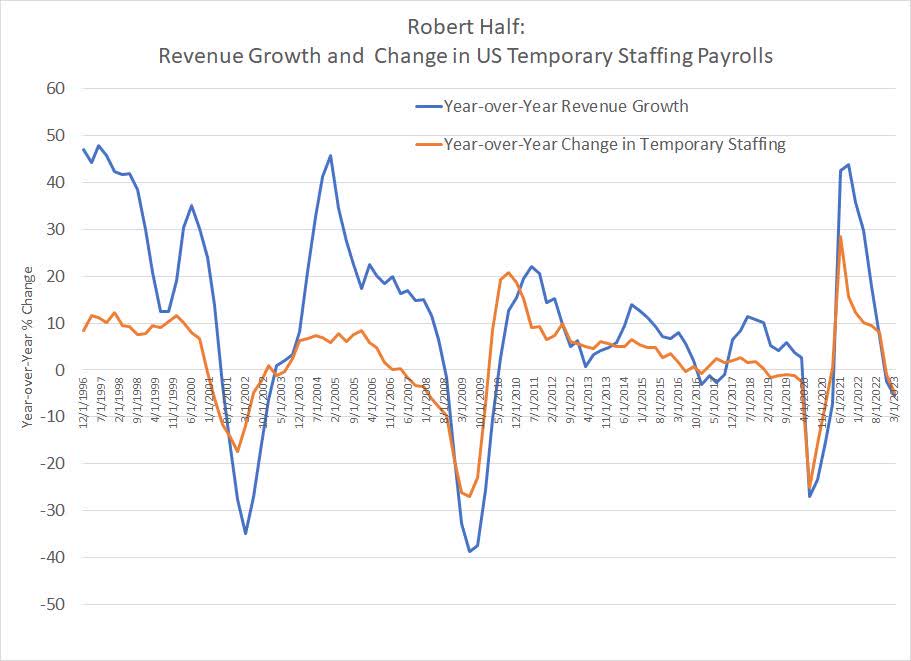
This chart compares the year-over-year change in RHI revenues compared to the year-over-year change in temporary staffing payrolls as reported by the Bureau of Labor Statistics (BLS).
RHI's revenues are more volatile than temporary staffing payrolls, but directionally these two series are closely correlated. Note that declines - or slowing year-over-year growth -- in temporary staffing payrolls reported by BLS appear to lead declines in RHI revenues by 1 to 2 quarters over the period covered by my chart (since December 1996).
Given the weakening in the U.S. labor market and temporary staffing payrolls I outlined earlier in this piece, it should come as little surprise that overall RHI revenues have started shrinking on a year-over-year basis. And, the history of prior U.S. economic downturns suggests we can expect these trends to continue for at least a few more quarters and worsen significantly as the U.S. economy enters recession.
Let's look at the history of trailing 12-month sales for RHI since 1996:
Trailing 12-Month Sales for Robert Half (Bloomberg)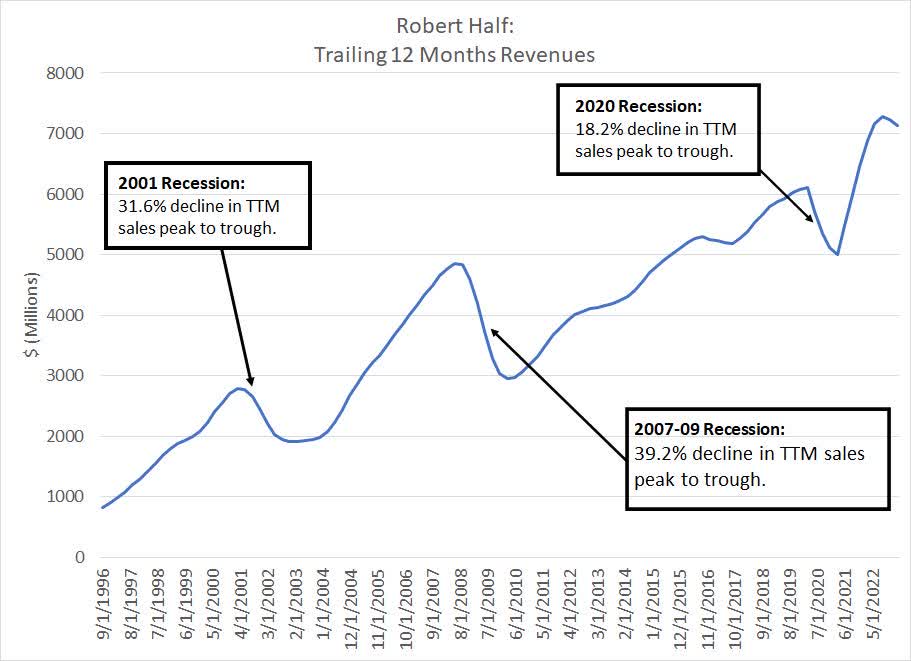
As I've labeled, RHI revenues on this basis declined 31.6% from peak to trough in the 2001 recession, 39.2% in the 2007-09 recession and 18.2% in the 2020 recession.
So far, trailing 12-month revenues are off less than 2% from the peak in Q3 2022 representing sales over the period from Q4 2021 through Q3 2022 inclusive.
The 2001 recession was relatively mild and short-lived while the 2007-09 recession was severe and among of the longest since the 1930s. The 2020 downturn was highly unusual in that it was deep but the shortest in U.S. financial history, lasting just two months from peak-to-trough. Further, in 2020 the U.S. government applied record, coordinated fiscal and monetary stimulus, which resulted in a rapid recovery for the economy and the strongest jobs market since the late 1960s as I outlined earlier.
Downside Risks to Wall Street Estimates
Even though RHI revenues are already beginning to roll over, Wall Street remains sanguine about the future:
Sales Estimates for RHI (Bloomberg)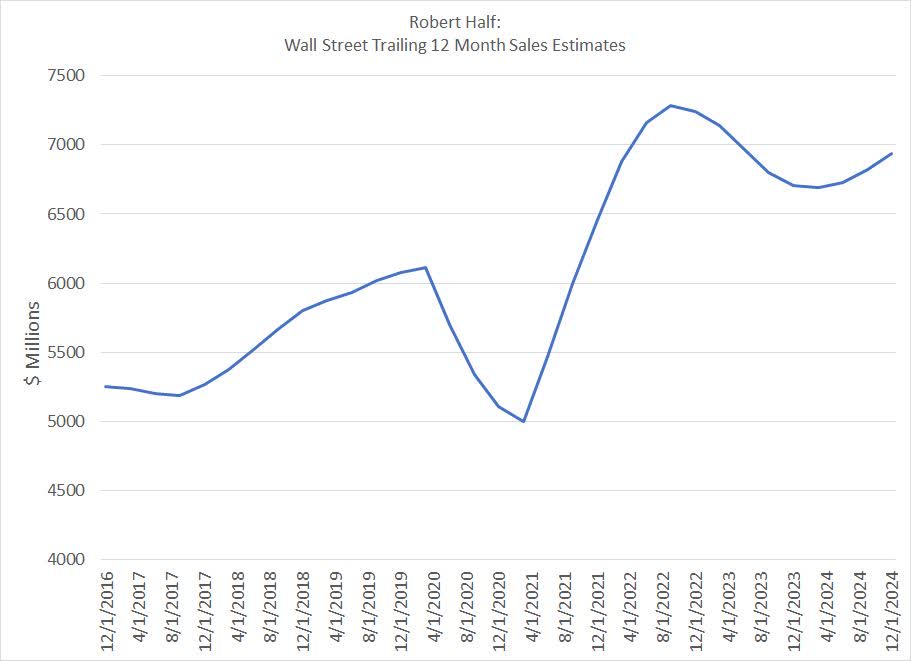
This chart shows trailing one-year sales for RHI since Q4 2016 plus quarterly consensus Wall Street estimates through the end of 2024 (next year).
As you can see, Wall Street is pricing in a relatively shallow dip in RHI revenues that bottoms out in Q4 2023 and resumes growth next year. The total peak-to-trough decline in trailing 12-month sales is just over 8% based on these estimates, far smaller than any recession cycle over the past quarter century.
There are two main reasons for this sanguine outlook I can identify.
First, given the increased size of the more stable Protiviti business relative to prior cycles like 2007-09, more stable sales there might offset declines in staffing revenues in a mild recession.
Second, there's an old saw that holds the most expensive words in financial markets are "This time it's different." The very words uttered by Fed Chair Jerome Powell at the press conference following last week's Fed meeting:
I'll just say I continue to think that it's possible that this time is really different. And the reason is there's just so much excess demand, really, in the labor market. It's interesting as, you know, we've raised rates by 5 percentage points in 14 months, and the unemployment rate is 3 1/2 percent, pretty much where it was, even lower than where it was when we started. So job openings are still very, very high. We see by surveys and much, much evidence that conditions are cooling gradually. But it's -- it really is different. You know, it wasn't supposed to be possible for job openings to decline by as much of the -- as they've declined without unemployment going up. Well, that's what we've seen. So we -- there are no promises in this. But it just seems that -- to me that it's possible that we can continue to have a cooling in the labor market without having the big increases in unemployment that have gone with many, you know, prior episodes. Now, that would be against history. I fully appreciate that. That would be against the pattern.
Source: Federal Reserve May 3, 2023 Press Conference with Chair Powell
In short, if the U.S. avoids recession in 2023, or unemployment doesn't rise significantly amid the coming recession then RHI revenues could see a mild decline this cycle more akin to the mild slowdown and soft patch in the U.S. economy back in the 2015-16 period rather than a true economic contraction.
However, I don't buy either of these optimistic scenarios.
Protiviti is a great business and it probably is less cyclical than staffing for RHI. However, as I outlined earlier, it's worth noting that Protiviti saw a parabolic surge in revenues coming out of the 2020 downturn due, in part, to a rapid recovery in revenues and profits for smaller and mid-sized U.S. businesses. That was due, in part, to direct fiscal support for small businesses, RHI's core customer, back in 2020-21.
So, I suspect that some of the boom in Protiviti revenues coming out of that downturn was unique to the 2020 cycle.
Today smaller and mid-sized businesses appear to be struggling more than the large firms in the S&P 500. According to the latest data from Bloomberg almost 89% of S&P 500 companies have reported calendar Q1 2023 earnings to date with 77.8% beating earnings estimates and 68.3% beating on the top line.
However, around two-thirds of the Russell 2000 index of small-cap stocks have reported results to date with only 59.3% beating earnings estimates and 59.6% beating sales estimates.
And, Protiviti actually disappointed Wall Street expectations in Q1 2023:
Analyst Question: So, when you guide second quarter Protiviti revenues to be up 2% to 5%, it's about the same as the first quarter that we just saw at 4%. My question is what's holding back higher growth at Protiviti? Would you consider the economy weighing on Protiviti's growth here?
CEO Keith Waddell Answer: Well, I'd say, first of all, Protiviti is still growing. First quarter, frankly, it had a normal seasonal quarter. We had expected a somewhat better than normal seasonal quarter. For the second quarter, the expectation in part because they were a little light in the first quarter, for the second quarter the expectation is a little below trend. So, whereas first quarter expectation was a little above trend, second quarter expectation a little below trend.
I'd say, if you look across at solution areas, regulatory risk and compliance is going extremely well. If anything, they're more talent constrained than they are demand constrained, technology consulting also going well. Internal audit was clearly the most impacted yet still growing, but clients are a bit slower to sign contracts, they're delaying some projects. There was a very small impact from regional banks for information about 10% to 12% of Protiviti's FSI practice is with regional banks, and FSI is about 40% of Protiviti's total, so translated only 4% or 5% of Protiviti revenues relate to regional banks, but there was a little softness there.
And further, in Europe, there was a very large project that downsized quite abruptly that impacted their rates. The good news is they almost immediately replaced that with a project of an even larger size, which should be good for Q2. So Q2 guidance, I think, is a bit more conservative with Protiviti than was Q1 guidance. Internal audit is seeing some impact from client slowness/delays. That said, there is still an expectation that it grows both sequentially and year-on-year, and that in regulatory compliance and in technology consulting the growth be even stronger. So overall, we feel good about Protiviti's pipeline. We feel good about where it is, the fact that it's growing notwithstanding the environment. And hopefully, Q2 guidance will end up being more conservative.
Source: Robert Half Q1 2023 Earnings Results and Conference Call April 26, 2023
CEO Keith Waddell sounded an optimistic note on Protiviti, but described Q1 2023 results as "a little light." And, he went on to note that this segment did have some exposure to troubled U.S. regional banks, lost a major contract in Europe and saw some slowness/delays in signing contracts for its internal audit business.
Bottom Line
Protiviti probably is less cyclical than staffing; however, it's clearly not entirely immune to the economic cycle and a potential more severe downturn for small and mid-sized U.S. and European clients. And, even with its larger share of revenues relative to 2007-09, it's unlikely to be able to be able to offset a decline in the much-larger staffing business amid a recession.
Even less convincing is the second "this time it's different" argument. Early on in this article, I took a closer look at recent BLS data on the U.S. labor market. And, while the headline numbers are holding up reasonably well, there are some cracks beneath the surface including a clear rollover in temporary staffing - the core of RHI's business - and a pattern of BLS revisions consistent with prior recession cycles.
And even as Chair Powell noted that his personal view is that the U.S. may avoid a major rise in unemployment as inflation glides back to target, that's not the view of most at the Fed or the central bank's staff economists.
The Fed's summary of economic projections, released on March 22nd, projects a rise in the unemployment rate from 3.4% in April to 4.5% by the end of 2023 and 4.6% in 2024. Given the U.S. labor force of over 161 million strong, a 1.2% rise in the unemployment rate implies the loss of about 1.93 million payrolls and, historically, the decline in temporary employment is larger in percentage terms than the overall decline in payrolls.
It's hard to envision a scenario where U.S. inflation trends back to the Fed's 2% target without labor market conditions loosening considerably. After all, a major driver of inflation is wages and based on last week's BLS report, U.S. average hourly earnings are growing at 4.4% year over year, more than double the Fed's annual inflation target.
Target, Valuations and Risks
In a normal market environment earnings - and ratios like price-to-earnings (P/E) -- are a reasonable metric to use when valuing companies. However, for cyclical companies amid an economic downturn, P/E's are of limited utility in assessing a trough valuation.
After all, at the depths of recession profits - the denominator of the P/E ratio -- are typically depressed, which artificially inflates P/E valuations. Thus, cyclical companies like RHI often appear most expensive on a P/E basis right at the lows when the buying opportunity is greatest.
Instead, to assess trough valuations I prefer to look higher on the income statement to the somewhat more stable revenue line:
RHI Price-to-Sales Since 2005 (Bloomberg)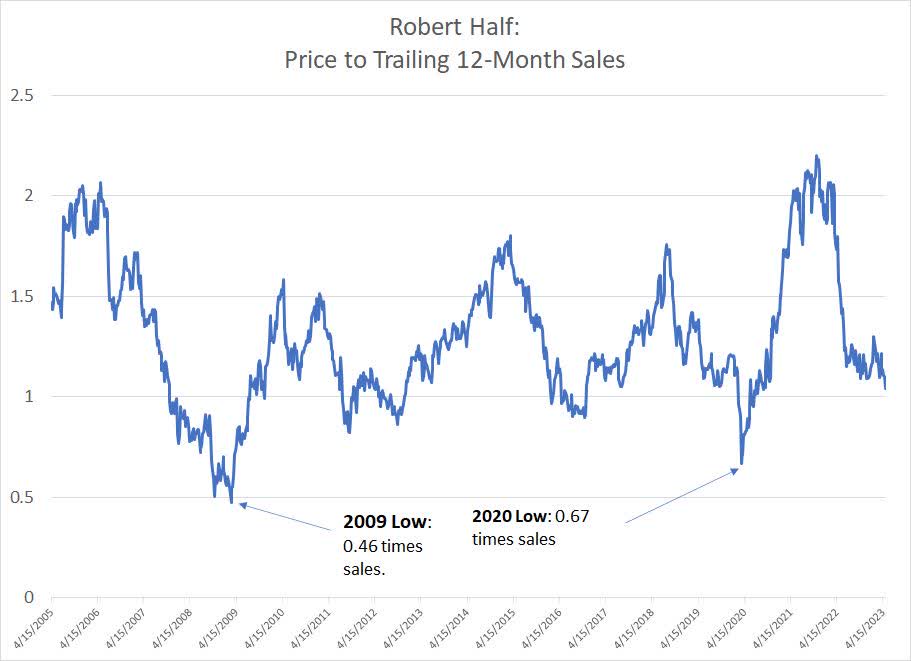
This chart shows the weekly price-to-sales ratio for RHI since 2005 using trailing 12-month sales as the denominator of the ratio. As you can see, the stock bottomed out under 0.5 times in March 2009 and around 0.67 times in 2020 at the lows.
Even though there was no U.S. recession in 2011-2012 or 2016-2017, RHI traded down to a ratio of between 0.80- and 0.90-times trailing sales amid a more modest weakening in the U.S. labor market.
Despite the more than 45% decline in the stock from its early 2022 highs, RHI is still trading at roughly 1.05 times trailing sales.
It's tough to assess the severity of a potential U.S. recession ahead of time; however, the consensus is currently looking for a relatively mild downturn similar to 2001 rather than the more severe 2007-09 and 2020 cycles. And given the recent weakening in the U.S. labor and temporary staffing cycles, I'm penciling in a 15% peak-to-trough decline in RHI sales on this basis. I view that as conservative given that it's about half the trailing 12 month decline in revenues in the mild 2001 recession and a smaller decline than in 2020 when RHI's small and mid-sized client base was directly supported by record-setting fiscal and monetary stimulus.
Applying a 0.90 price-to-sales multiple - above historic trough multiples -- to those projected trailing sales estimates yields a value of about $5.57 billion or around $53 per share, down about 20% from the current quote. Using a more typical recession trough multiple of 0.80 would yield a value closer to $46 to $47, down around 30% from the current price.
I see these downside targets for the stock as on the conservative side given the potential for a much more severe decline in revenues from inflated levels amid the labor market boom of the past 3 years.
From a technical perspective, RHI recently broke down below support at around $70, a signal the market may be revaluing the stock based on a more typical recessionary decline in revenues and profits rather than merely a soft patch following a period of elevated growth.
Of course, there are risks to my downside targets.
The two most prominent are those I discussed earlier - the potential for the U.S. economy to avoid recession this cycle and the potential for stable Protiviti revenues to offset declines in the core staffing business. However, as I outlined earlier, I believe the probability of those more bullish outcomes is low and declining.
The third major upside risk for the stock relative to my estimates is that RHI is a quality company with a clean balance sheet and a net cash position. That puts it in a good position to manage its way through any economic weakness while continuing to return some capital to shareholders via its $0.48 quarterly dividend (a 2.9% yield) and ongoing share repurchases.
However, while RHI is a solid company today, it's also been on solid financial footing in prior recession cycles. Historically, the decline in the company's cyclical base business overwhelms tailwinds from the dividend and buybacks when the economic backdrop turns hostile.
I also believe there's significant downside risk to my targets. The biggest risk on that side of the equation is the labor market of the past 3 years represents a sort of "sugar high" for sales and profitability driven by government stimulus efforts coming out of the 2020 recession and COVID lockdowns that powered a simultaneous boom in labor demand and shrinking labor supply (a drop in the labor force).
As that boom eases, a necessary step to reducing wage and overall inflation, then RHI could actually experience a more pronounced decline in staffing revenues in percentage terms than in a normal economic cycle. Alternatively, the recovery from any decline could be less robust than normal given less slack in the labor market.
In such a scenario, the sales decline could be a more normal 30%+ for RHI and the consequent trough valuation targets significantly lower than I'm estimating.
This article was written by

Analyst’s Disclosure: I/we have no stock, option or similar derivative position in any of the companies mentioned, and no plans to initiate any such positions within the next 72 hours. I wrote this article myself, and it expresses my own opinions. I am not receiving compensation for it (other than from Seeking Alpha). I have no business relationship with any company whose stock is mentioned in this article.
Seeking Alpha's Disclosure: Past performance is no guarantee of future results. No recommendation or advice is being given as to whether any investment is suitable for a particular investor. Any views or opinions expressed above may not reflect those of Seeking Alpha as a whole. Seeking Alpha is not a licensed securities dealer, broker or US investment adviser or investment bank. Our analysts are third party authors that include both professional investors and individual investors who may not be licensed or certified by any institute or regulatory body.