BIZD: Structural Flaws Lead To Consistent Underperformance For This BDC ETF

Summary
- We take a look at the passive BDC ETF BIZD.
- BIZD has a number of structural problems that create a consistent underperformance drag relative to the sector.
- The BDC sector lends itself much more to direct investing and the presence of passive funds like BIZD allows direct investors to generate higher returns.
- Systematic Income members get exclusive access to our real-world portfolio. See all our investments here »
Darren415
This article was first released to Systematic Income subscribers and free trials on May. 1
In this article we take a closer look at the ETF VanEck BDC Income ETF (NYSEARCA:BIZD). In our BDC coverage, the fund came up in discussion of whether it's a decent option for BDC "tracker" exposure.
Our main takeaway is that for investors who can spare a little bit of time, direct exposure to the sector is likely to be more successful. For this reason we would avoid BIZD.
A Look At BIZD
BIZD tracks the MVIS US Business Development Companies Index which is a market cap-weighted index of the BDC sector. The fund uses additional market cap and trading volume floors.
The BDC sector is a very top heavy sector as the following net asset chart shows. A handful of larger companies hold around half of the assets in the sector.
Systematic Income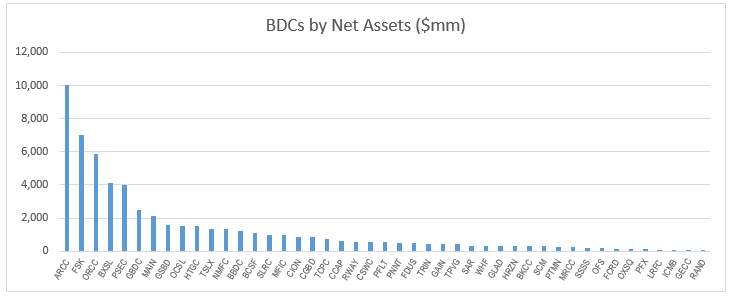
What this means is that a market-cap allocation approach leads to a highly undiversified portfolio. The top holding ARCC is 20% of the portfolio, top 2 holdings - ARCC and FSK - are more than a third of the portfolio and top 3 holdings - ARCC, FSK and ORCC - are nearly half of the portfolio.
The other difficulty with a market-cap approach is that it will tend to buy high and sell low. Specifically, it buys more of BDCs that are getting more expensive and sells BDCs that are getting less expensive.
For example, imagine, MAIN outperforms the sector and increases its valuation by 10% whereas the broader sector remains roughly flat. In this case, the fund will buy more of MAIN and sell other BDCs to make room for it. And vice-versa, imagine ARCC valuation underperforms the sector. The fund will be selling ARCC (because its market cap fell relative to the rest of the sector, all else equal) and will be buying more of the rest of the sector. In short, BIZD is an anti-value investor.
We illustrate this trading dynamic below using BXSL.
Systematic Income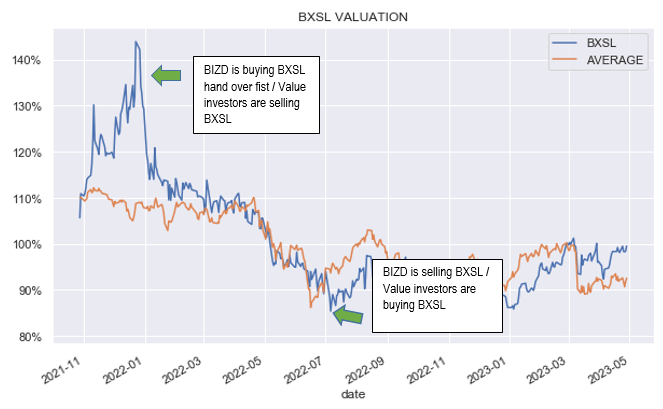
As the chart highlights, BIZD behavior is precisely the opposite of what BDC investors tend to do. BDC investors like to buy more of a given BDC at cheaper valuations and sell / buy less at more expensive valuations. In other words, an investor who has ARCC on their watchlist will likely buy more of ARCC if its valuation underperforms the sector and vice-versa.
Maybe investors would be happy to overlook these two obvious problems. However, the fund's longer-term returns aren't great relative to the sector. Over the last 10 years, BIZD underperforms the sector by more than 1% per annum. Over the last 5 years it does only slightly better with an underperformance of a bit less than 1% per annum relative to the sector.
Systematic Income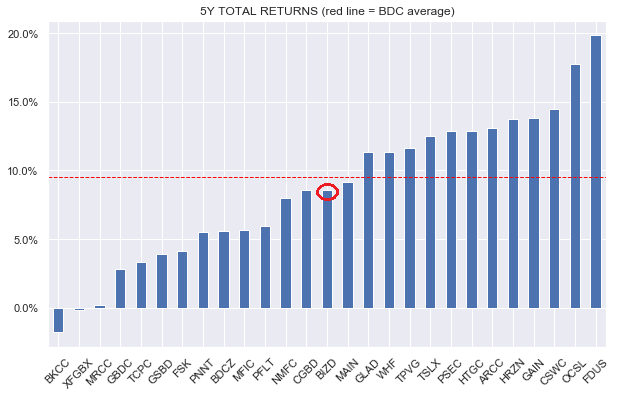
This underperformance is about 0.6% above its fee of 0.4%. In other words, the fund's underperformance is not just due to its fee but goes above the level of the fee. This is important because if BIZD underperformed by its fee, it might be more defensible to say that investors can own the sector and only face a drag of the fund's expenses for convenience. However, because its underperformance exceeds its expenses, the argument for actually holding the sector directly is much stronger. In other words, it wouldn't be correct to say that BIZD gives investors BDC exposure, it's more correct to say that BIZD gives investors BDC exposure less 1% per annum.
An important question is whether this underperformance is a one-off fluke or is a consistent feature of the fund. If we take a look at the annual performance of the fund we see that it underperforms fairly consistently. Out of the past 9 full years since inception, it outperformed only once - in 2019. This 11% hit rate suggests that its underperformance is structural and investors should expect a roughly 1% drag relative to the sector over time.
Systematic Income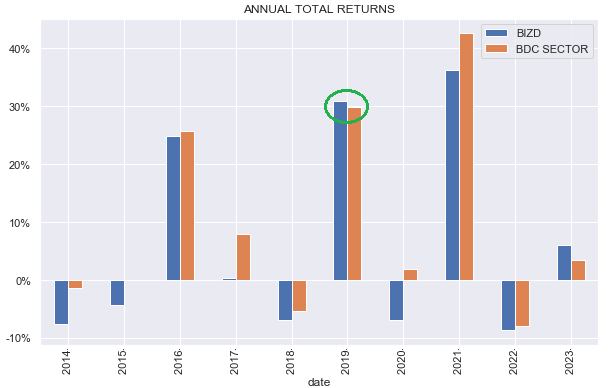
BIZD is obviously a passive fund and this creates a couple of other problems. One is that it makes it difficult for investors to understand whether there is value in the sector or not. Specifically, BIZD ignores the broader sector valuation and will be fully invested regardless of whether BDCs are good or not so good value.
As many investors who allocate directly to BDCs know full well, the valuation of the sector (i.e. the average price-NAV ratio of BDCs) oscillates in a wide range. Historically, it has paid to start adding to BDC exposure when valuation moves below a level of around 85% and to start reducing exposure above a level of around 110%. These figures are not set in stone and, in fact, we recently reduced our BDC exposure at around a sector valuation of 100% (before the March bank tantrum which pushed valuations lower by 7-10%) because in our view there was less margin of safety given the direction of the economy.
Systematic Income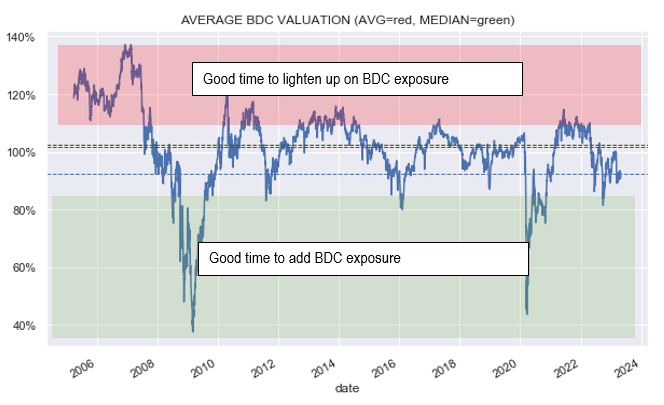
Some investors view this as timing the market and that's OK. If Buffett does it (i.e. pays attention to valuation in capital allocation decisions), we don't care what it's called. BIZD, of course, doesn't know if the sector is expensive or not so will ignore this dynamic.
The second problem with a passive approach is that it ignores the serial correlation in BDC performance. In other words, higher-quality BDCs tend to deliver strong results fairly consistently while lower-quality BDCs tend to deliver poor results fairly consistently. The main reason for this has to do, in our view, with the underwriting approach. A less than ideal underwriting approach seeds the portfolio with low quality assets for the long-term and vice-versa.
The MidCap Financial Investment Corp. (MFIC), formerly AINV, has consistently underperformed as the following chart shows (blue bars tend to run below red bars). It's far from the only example.
Systematic Income BDC Tool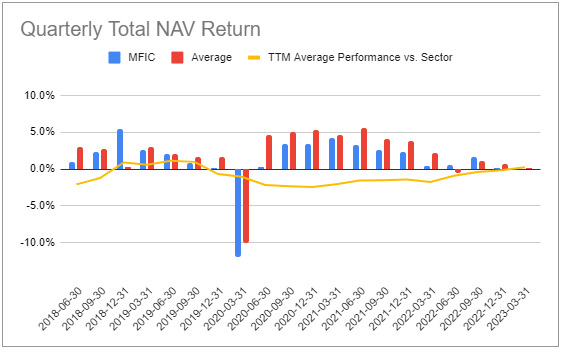
On the other side of the ledger you have something like TSLX which has consistently outperformed the sector.
Systematic Income BDC Tool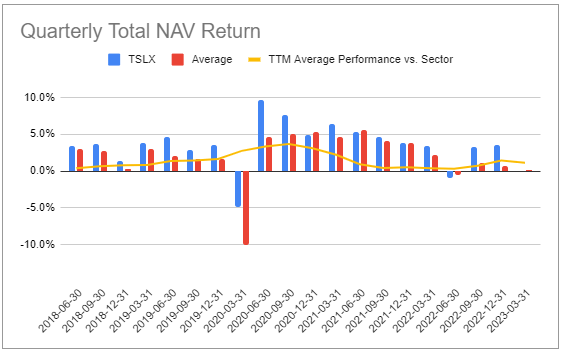
One would think that the market has fully priced in this kind of relative performance but that's incorrect. It's true that MFIC trades at a lower than average valuation and TSLX trades at a higher than average valuation but these valuation differentials are not nearly wide enough given historic performance i.e. they don't fully take into account the actual performance differential.
The final problem with a passive approach is that it doesn't allow investors to tailor their risk profile. For example, much commentary behind the "pitch" for passive exposure to BDCs is that BDCs are synonymous with senior secured loans. However, it might surprise some investors in BIZD that if we just go by the top three BIZD holdings which add up to around 45% of the portfolio, their average allocation to senior secured loans is only around 61%. In other words, for the first 45% of the portfolio, investors are only holding 27% of senior secured loans with the rest being allocated to second-lien debt, subordinated loans, unsecured debt, preferreds, warrants and common shares. Investors who allocate directly to the sector can easily tilt to BDCs with a higher senior secured loan profile.
A final word of warning for investors who are judging whether or not to hold BIZD by comparing its performance to something like the S&P 500. If we look over the last 3 years, BIZD performance looks fantastic. It beats S&P 500 by 6%. Stronger total returns and a higher yield - who can ask for anything better?
Portfolio Visualizer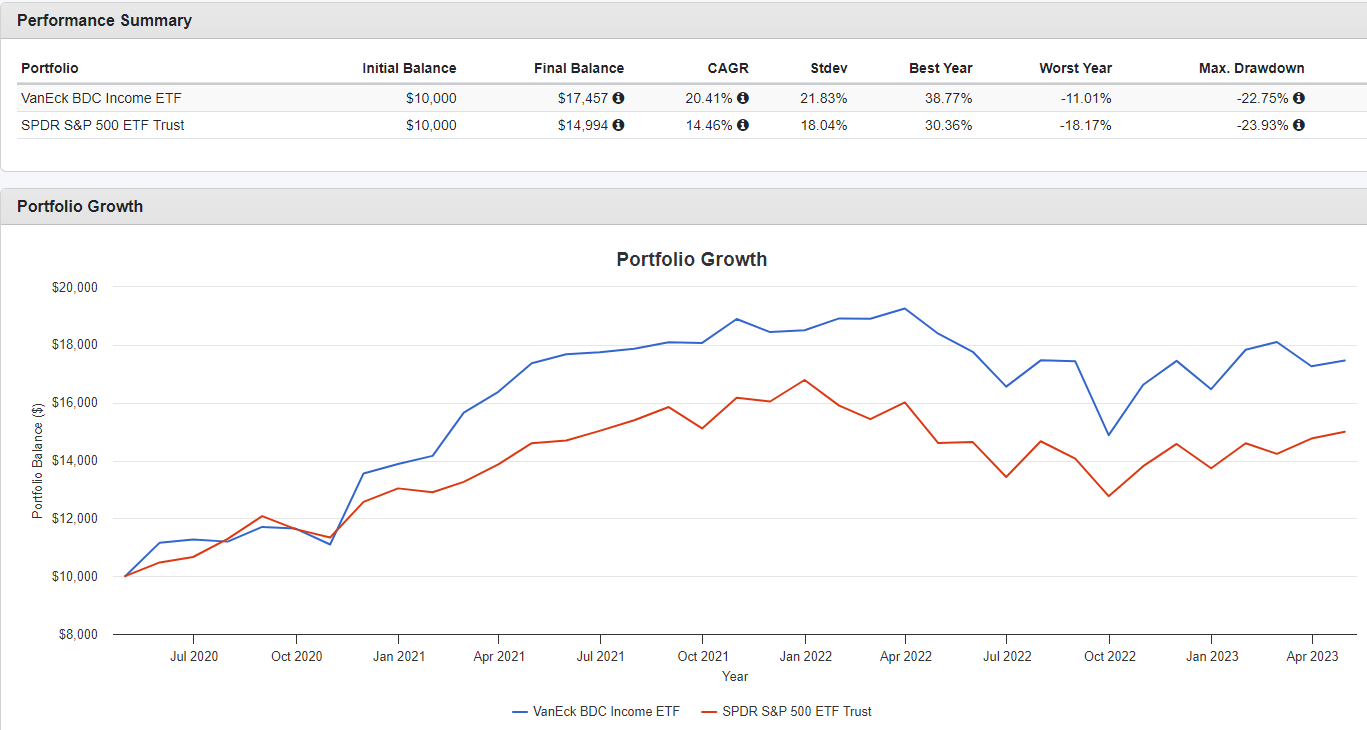
However, this "have-your-cake-and-eat-it-too" story does not have a happy ending (few do). Over any other time frame, BIZD looks worse. Over the longest possible time frame, it underperforms the S&P 500 by 6.8% per year.
Portfolio Visualizer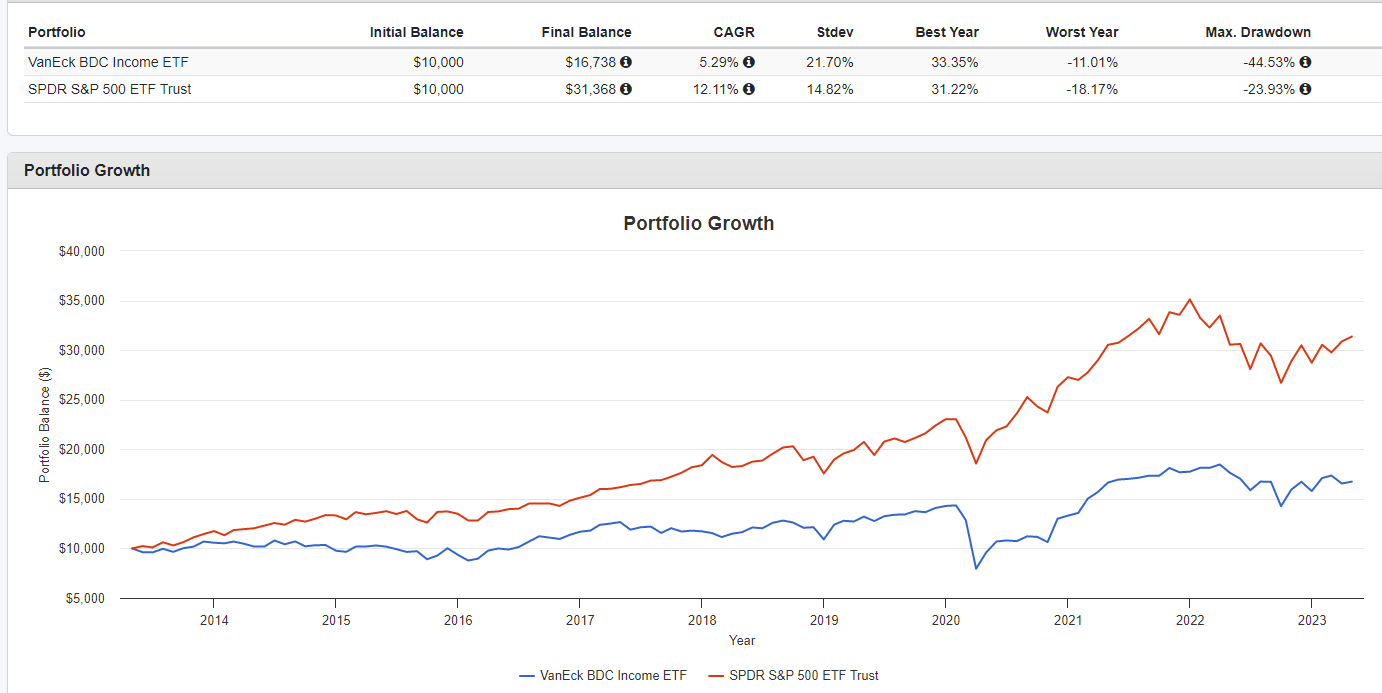
Why does BIZD look great over the last 3 years and terrible over the last decade (or any other non-cherry-picked time frame). Anyone who follows the BDC market knows full well that 3 years ago we were still climbing out of the COVID crash. BDC valuations were very depressed, in large part because investors expected BDCs to take portfolio losses which did not occur (in large part due to fiscal support and a quick macro bounceback).
As we see below, sector valuation rose from about 73% to about 90% - a huge pick-up of 17%. This kind of performance boost happens once in a blue moon and the last thing investors should expect is for it to repeat. Valuations are at much more reasonable levels now though they are below the historic average.
Systematic Income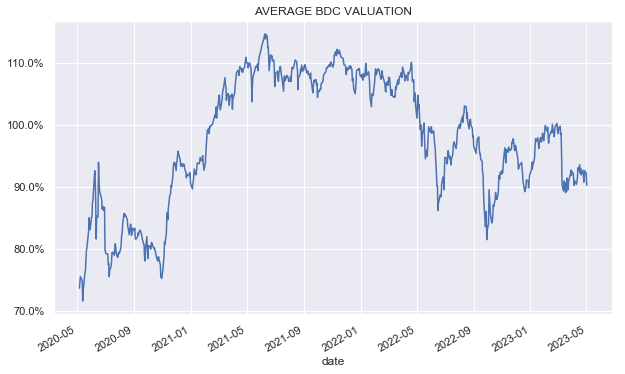
Takeaways
BDCs remain attractive assets for income investors. In our view a direct approach to BDC allocation is more likely to be successful. A direct approach is also more in tune with how most income investors think about allocation as it aligns with the principles of value investing. A passive approach to BDCs, while convenient, suffers from a number of flaws. These include ignoring valuation, buying high / selling low and holding a highly undiversified portfolio, among others. In our view, investors can do better with direct allocation and that's our own approach on the service.
Check out Systematic Income and explore our Income Portfolios, engineered with both yield and risk management considerations.
Use our powerful Interactive Investor Tools to navigate the BDC, CEF, OEF, preferred and baby bond markets.
Read our Investor Guides: to CEFs, Preferreds and PIMCO CEFs.
Check us out on a no-risk basis - sign up for a 2-week free trial!

This article was written by

At Systematic Income our aim is to build robust Income Portfolios with mid-to-high single digit yields and provide investors with unique Interactive Tools to cut through the wealth of different investment options across BDCs, CEFs, ETFs, mutual funds, preferred stocks and more. Join us on our Marketplace service Systematic Income.
Our background is in research and trading at several bulge-bracket global investment banks along with technical savvy which helps to round out our service.
Analyst’s Disclosure: I/we have a beneficial long position in the shares of TSLX either through stock ownership, options, or other derivatives. I wrote this article myself, and it expresses my own opinions. I am not receiving compensation for it (other than from Seeking Alpha). I have no business relationship with any company whose stock is mentioned in this article.
Seeking Alpha's Disclosure: Past performance is no guarantee of future results. No recommendation or advice is being given as to whether any investment is suitable for a particular investor. Any views or opinions expressed above may not reflect those of Seeking Alpha as a whole. Seeking Alpha is not a licensed securities dealer, broker or US investment adviser or investment bank. Our analysts are third party authors that include both professional investors and individual investors who may not be licensed or certified by any institute or regulatory body.