WTV: A Shareholder Yield ETF With Great Valuation

Summary
- WisdomTree U.S. Value Fund ETF is an actively managed fund focused on dividends, buybacks and quality.
- It is well-diversified across sectors and holdings.
- The portfolio is greatly superior to the benchmark in valuation, and to a lesser extent in quality.
- It has lagged its competitor Cambria Shareholder Yield ETF.
- Quantitative Risk & Value members get exclusive access to our real-world portfolio. See all our investments here »
utah778
This article series aims at evaluating ETFs (exchanged-traded funds) regarding the relative past performance of their strategies and quality metrics of their current portfolios. Holdings change over time and reviews are updated when necessary.
WTV strategy and portfolio
WisdomTree U.S. Value Fund ETF (NYSEARCA:WTV) is an actively managed fund implementing a strategy based on shareholder yield, a concept combining dividends and buybacks. It has 122 holdings, a 12-month distribution yield of 2.01%, and a cheap total expense ratio of 0.12%. Distributions are paid quarterly.
The official inception date is 02/23/2007, but the fund has changed strategies, names and tickers, making it complicated to analyze historical data. This happens when the legal structure of an old ETF (an Open Ended Investment Company) is reused and re-branded in a new one for administrative cost or marketing purposes. According to WisdomTree, “The Fund’s objective changed effective December 18, 2017.” Before that date, it was tracking the WisdomTree U.S. LargeCap Value Index. Moreover, it was rebranded in January 2022: it was formerly named WisdomTree U.S. Quality Shareholder Yield Fund, with another ticker (QSY). Changing names doesn’t impact the relevance of price and distribution history, but changing strategies does. Therefore, I will take into account data from 12/18/2017.
As an actively managed fund, WTV doesn’t have an underlying index: it offers a lot of flexibility to managers, but it also makes the strategy less transparent. However, WisdomTree describes quite clearly its principles:
The WisdomTree U.S. Value Fund (WTV) seeks income and capital appreciation. WTV is a quantitative actively managed strategy that invests primarily in large- and mid-capitalization U.S. companies with high total shareholder yield and favorable quality characteristics, such as return on equity (ROE) and return on assets (ROA). To avoid companies that finance share buybacks by issuing debt, the strategy ranks stocks based on both metrics and applies a qualitative risk management overlay. The Fund’s portfolio is reconstituted and rebalanced on an annual basis, although a more active approach may be taken depending on market conditions and investment opportunities.
The next chart shows that shareholder shield and quality metrics are considered in equal weight in the ranking process (“50/50”).
WTV strategy description (WisdomTree)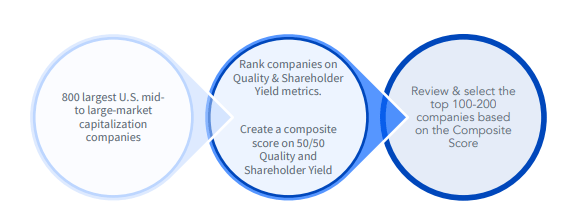
WisdomTree describes shareholder yield as “the combination of dividend yield and buyback yield.” In fact, it doesn’t correspond to the widely accepted definition of shareholder yield, which includes a third element besides dividends and buybacks: debt reduction. WTV seems to ignore debt reduction (at least in the strategy description), but it seeks to filter out companies issuing new debt to fund buybacks.
The fund invests exclusively in U.S. companies. The top sectors are consumer discretionary (about 16% of asset value) and financials (14%). Compared to the S&P 500 (SP500), WTV massively underweights technology and consumer staples. It overweights mostly materials, consumer discretionary, and energy. It results in a better diversification across sectors.
Sector breakdown (chart: author, data: WisdomTree, SSGA)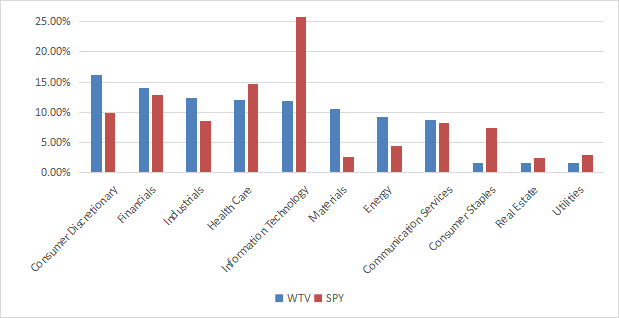
The next table lists the top 10 holdings with their weights and some fundamental ratios. They represent 15% of asset value and the heaviest ones weigh about 2%, so the fund is well-diversified and risks related to individual stocks is low.
Ticker | Name | weight% | EPS growth %ttm | P/E ttm | P/E fwd | Yield% |
HCA Healthcare, Inc. | 2.04% | -6.14 | 13.94 | 15.57 | 0.86 | |
Meta Platforms, Inc. | 1.99% | -39.04 | 28.87 | 20.02 | 0 | |
Cardinal Health, Inc. | 1.73% | 149.20 | 47.64 | 14.68 | 2.38 | |
Builders FirstSource, Inc. | 1.63% | 37.89 | 7.18 | 11.99 | 0 | |
Laboratory Corp. of America Holdings | 1.52% | -49.48 | 20.34 | 13.19 | 1.29 | |
Zillow Group, Inc. | 1.31% | 73.69 | N/A | 46.89 | 0 | |
Quest Diagnostics, Inc. | 1.30% | -54.90 | 20.17 | 15.63 | 2.08 | |
McKesson Corp. | 1.16% | 145.29 | 16.78 | 14.10 | 0.59 | |
Amgen, Inc. | 1.14% | 44.96 | 16.07 | 13.11 | 3.60 | |
Bristol Myers Squibb Co. | 1.13% | 21.79 | 19.86 | 8.49 | 3.35 |
Ratios from Portfolio123.
Modelling shareholder yield
Price history is too short to assess the long-term potential of the strategy. I did a simulation using a shareholder yield metric:
(dividends paid + equity purchase - equity issued) / Market cap
This is just a proof of concept. It may be different from the metric used by WTV and it ignores quality factors. Stocks in a universe of about 3000 stocks are ranked with this metric, then classified in 10 subsets of equal size. Subsets are reconstituted with constituents in equal weight every year between January 2000 and January 2023. Annualized returns are calculated for every subset. The chart below plots them with increasing shareholder yield from the left to the right. The red bar on the left doesn’t stand for a subset, but for a benchmark, SPDR® S&P 500 ETF Trust (SPY).
Shareholder yield performance, from low to high (Chart by Portfolio123.)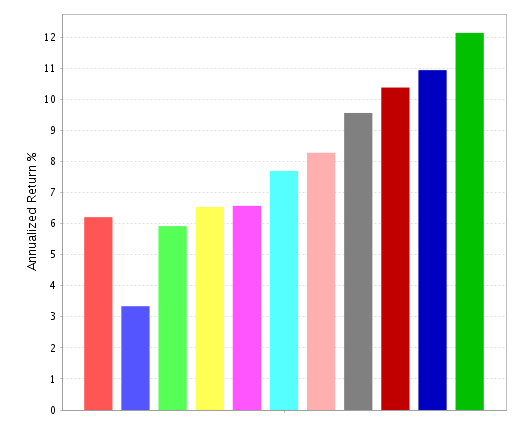
On a 23-year look-back period, higher returns are clearly skewed toward higher shareholder yields. It is not a guarantee of future return, but it proves that the concept of shareholder yield makes a lot of sense.
Performance and competitors
The next chart compares total returns since 12/18/2017 of WTV and two other funds implementing a shareholder yield strategy:
- iShares Core Dividend ETF (DIVB), reviewed here,
- Cambria Shareholder Yield ETF (SYLD).
The latter is managed by Meb Faber, author of a book on shareholder yield.
WTV vs SPY, DIVB, SYLD (Seeking Alpha)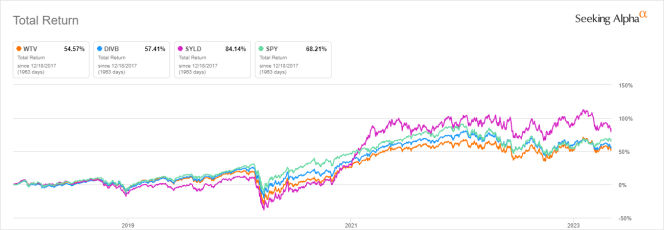
WTV is almost on par with DIVB, but it underperforms the S&P 500 and Cambria’s fund.
In previous articles, I have shown how three factors may help cut the risk in a dividend portfolio: Return on Assets, Piotroski F-score, and Altman Z-score.
The next table compares WTV since 12/18/2017 with a subset of the S&P 500: stocks with an above-average dividend yield, an above-average ROA, a good Altman Z-score, a good Piotroski F-score and a sustainable payout ratio. The subset is rebalanced annually to make it comparable with a passive index.
Total Return | Annual Return | Drawdown | Sharpe ratio | Volatility | |
WTV | 54.57% | 8.42% | -42.18% | 0.43 | 21.68% |
Dividend & quality subset | 63.65% | 9.58% | -36.53% | 0.52 | 18.72% |
Past performance is not a guarantee of future returns. Data Source: Portfolio123.
WTV underperforms the dividend quality subset by 9% in total return. However, ETF performance is real and the subset is simulated. My core portfolio holds 14 stocks selected in this subset (more info at the end of this post).
The fund's annualized distributions went up from $0.72 to $1.19 per share between 2018 and 2022. It is an increase of 65.3%, whereas the cumulative inflation has been about 18% in the same time (based on CPI). The annualized dividend growth rate of 13.4% is excellent.
Distribution history (Seeking Alpha)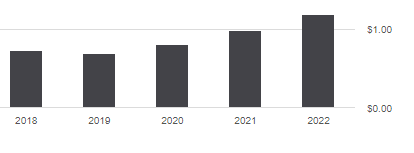
Scanning WTV portfolio
WTV is much cheaper than the S&P 500 regarding the usual valuation ratios (see next table).
WTV | SPY | |
Price/Earnings TTM | 8.77 | 20.68 |
Price/Book | 2.08 | 3.78 |
Price/Sales | 0.86 | 2.4 |
Price/Cash Flow | 6.61 | 15.44 |
I have scanned holdings with the quality metrics described in the previous paragraph. I consider that risky stocks are companies with at least 2 red flags among: bad Piotroski score, negative ROA, unsustainable payout ratio, bad or dubious Altman Z-score, excluding financials and real estate where these metrics are unreliable. With these assumptions, there are 15 risky stocks among 122 holdings, and they weigh about 12% of asset value. This is good, albeit not excellent.
Based on my calculation, the aggregate return on assets and Piotroski F-score are a bit above the S&P 500 values (see next table). These metrics point to a portfolio quality slightly superior to the benchmark.
WTV | SPY | |
Altman Z-score | 3.34 | 3.39 |
Piotroski F-score | 5.86 | 5.53 |
ROA % TTM | 9.71 | 7.36 |
Takeaway
WisdomTree U.S. Value Fund ETF is an actively managed fund selecting over 100 mid- and large cap stocks based on dividend, buyback and quality metrics. It is well-diversified across sectors and holdings. Backtesting a simple ranking factor based on shareholder yield points to outperformance on the long-term.
WisdomTree U.S. Value Fund ETF has lagged its competitor Cambria Shareholder Yield ETF. The current portfolio is greatly superior to the benchmark in valuation, and to a lesser extent in quality. Buybacks are less popular than dividends, but they are a flexible and tax-efficient way to pay shareholders.
My only criticism is that I would prefer a methodology giving a better place to smaller companies. This is likely why SYLD does better, and maybe also because debt reduction is taken into account.
Editor's Note: This article discusses one or more securities that do not trade on a major U.S. exchange. Please be aware of the risks associated with these stocks.
Quantitative Risk & Value (QRV) features data-driven strategies in stocks and closed-end funds outperforming their benchmarks since inception. Get started with a two-week free trial now.

This article was written by

Step up your investing experience: try Quantitative Risk & Value for free now (limited offer).
I am an individual investor and an IT professional, not a finance professional. My writings are data analysis and opinions, not investment advice. They may contain inaccurate information, despite all the effort I put in them. Readers are responsible for all consequences of using information included in my work, and are encouraged to do their own research from various sources.
Analyst’s Disclosure: I/we have a beneficial long position in the shares of META either through stock ownership, options, or other derivatives. I wrote this article myself, and it expresses my own opinions. I am not receiving compensation for it (other than from Seeking Alpha). I have no business relationship with any company whose stock is mentioned in this article.
Seeking Alpha's Disclosure: Past performance is no guarantee of future results. No recommendation or advice is being given as to whether any investment is suitable for a particular investor. Any views or opinions expressed above may not reflect those of Seeking Alpha as a whole. Seeking Alpha is not a licensed securities dealer, broker or US investment adviser or investment bank. Our analysts are third party authors that include both professional investors and individual investors who may not be licensed or certified by any institute or regulatory body.