
 Yahoo Finance
 The Return Trends At B&M European Value Retail (LON:BME) Look Promising
- Oops!Something went wrong.Please try again later.
- BMRRY
To find a multi-bagger stock, what are the underlying trends we should look for in a business? Firstly, we'd want to identify a growing return on capital employed (ROCE) and then alongside that, an ever-increasing base of capital employed. Basically this means that a company has profitable initiatives that it can continue to reinvest in, which is a trait of a compounding machine. So on that note, B&M European Value Retail (LON:BME) looks quite promising in regards to its trends of return on capital.
Understanding Return On Capital Employed (ROCE)
Just to clarify if you're unsure, ROCE is a metric for evaluating how much pre-tax income (in percentage terms) a company earns on the capital invested in its business. The formula for this calculation on B&M European Value Retail is:
Return on Capital Employed = Earnings Before Interest and Tax (EBIT) ÷ (Total Assets - Current Liabilities)
0.19 = UK£576m ÷ (UK£3.8b - UK£778m) (Based on the trailing twelve months to September 2022).
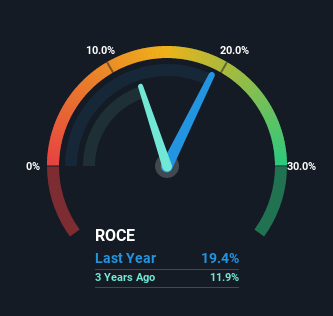
Thus, B&M European Value Retail has an ROCE of 19%. In absolute terms, that's a satisfactory return, but compared to the Multiline Retail industry average of 11% it's much better.
View our latest analysis for B&M European Value Retail
In the above chart we have measured B&M European Value Retail's prior ROCE against its prior performance, but the future is arguably more important. If you're interested, you can view the analysts predictions in our free report on analyst forecasts for the company.
So How Is B&M European Value Retail's ROCE Trending?
We like the trends that we're seeing from B&M European Value Retail. The numbers show that in the last five years, the returns generated on capital employed have grown considerably to 19%. The amount of capital employed has increased too, by 93%. This can indicate that there's plenty of opportunities to invest capital internally and at ever higher rates, a combination that's common among multi-baggers.
The Bottom Line
In summary, it's great to see that B&M European Value Retail can compound returns by consistently reinvesting capital at increasing rates of return, because these are some of the key ingredients of those highly sought after multi-baggers. And investors seem to expect more of this going forward, since the stock has rewarded shareholders with a 86% return over the last five years. So given the stock has proven it has promising trends, it's worth researching the company further to see if these trends are likely to persist.
On a separate note, we've found 2 warning signs for B&M European Value Retail you'll probably want to know about.
If you want to search for solid companies with great earnings, check out this free list of companies with good balance sheets and impressive returns on equity.
Have feedback on this article? Concerned about the content? Get in touch with us directly. Alternatively, email editorial-team (at) simplywallst.com.
This article by Simply Wall St is general in nature. We provide commentary based on historical data and analyst forecasts only using an unbiased methodology and our articles are not intended to be financial advice. It does not constitute a recommendation to buy or sell any stock, and does not take account of your objectives, or your financial situation. We aim to bring you long-term focused analysis driven by fundamental data. Note that our analysis may not factor in the latest price-sensitive company announcements or qualitative material. Simply Wall St has no position in any stocks mentioned.
Join A Paid User Research Session
You’ll receive a US$30 Amazon Gift card for 1 hour of your time while helping us build better investing tools for the individual investors like yourself. Sign up here