TDV: Technology Aristocrats With Attractive Valuation

Summary
- ProShares S&P Technology Dividend Aristocrats ETF follows a dividend-growth, equal-weight strategy in technology.
- It is much cheaper than the sector benchmark regarding valuation ratios.
- The underlying index has underperformed the sector benchmark.
- Quantitative Risk & Value members get exclusive access to our real-world portfolio. See all our investments here »
Talaj
This article series aims at evaluating ETFs (exchange-traded funds) regarding the relative past performance of their strategies and quality metrics of their current portfolios. As holdings change over time, updated reviews are posted when necessary.
TDV strategy and portfolio
ProShares S&P Technology Dividend Aristocrats ETF (BATS:TDV) has been tracking the S&P Technology Dividend Aristocrats Index since 11/05/2019. It has 40 holdings, a 12-month distribution yield of 1.54% and a total expense ratio of 0.45%. Distributions are paid quarterly.
As described by S&P Dow Jones Indices, eligible companies must be in the GICS Information Technology sector or in one of three Internet industries classified in the Communication Services sector. They must have increased dividends every year for at least seven consecutive years and have a 6-month median daily volume above $1 million. The number of years of dividend increase may be reduced if less than 25 companies are eligible. The index is reconstituted annually and rebalanced quarterly with constituents in equal weight.
The fund invests exclusively in U.S. companies of all sizes: about 57% of asset value is in large companies, 22% in mid-caps, and 20% in small and micro-caps. The fund is heavy in semiconductors and IT services. The next chart details the industry breakdown at GICS level 3.
TDV industries (chart: author; data: Proshares)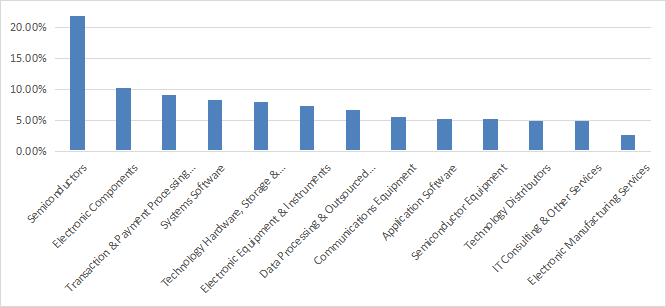
Positions are reset in equal weight at every rebalancing, but they may drift with price action. The current top 10 holdings are listed in the next table with fundamental ratios. These are the constituents with the highest momentum since the last rebalancing. They represent 27.9% of asset value and the largest one weighs about 3%, so risks related to individual companies are moderate.
Ticker | Name | Weight% | EPS growth %TTM | P/E TTM | P/E fwd | Yield% |
Badger Meter, Inc. | 3.04% | 16.25 | 57.20 | 51.50 | 0.65 | |
Lam Research Corp. | 2.84% | 12.29 | 14.75 | 15.96 | 1.30 | |
Microsoft Corp. | 2.83% | -3.75 | 33.67 | 32.38 | 0.88 | |
KLA Corp. | 2.81% | 19.00 | 15.72 | 15.48 | 1.35 | |
Broadridge Financial Solutions, Inc. | 2.78% | 0.18 | 32.75 | 22.09 | 1.90 | |
Littelfuse, Inc. | 2.76% | 0.05 | 19.10 | 19.58 | 0.91 | |
Apple Inc. | 2.72% | -4.33 | 29.49 | 29.08 | 0.55 | |
Roper Technologies, Inc. | 2.72% | 4.94 | 41.90 | 28.12 | 0.60 | |
Mastercard Incorporated | 2.71% | 4.13 | 38.43 | 31.30 | 0.59 | |
POWI | Power Integrations, Inc. | 2.71% | -18.85 | 34.90 | 39.11 | 0.96 |
Historical performance
Price history is short: the index was launched in October 2019 and the ETF about one month later. S&P Dow Jones Indices provides historical data from 1/31/2014. The next chart compares the underlying index (in blue) with the S&P 500 (SP500) and the index of the Technology Select Sector SPDR Fund (XLK), in the last 5 years.
TDV, SPY and XLK underlying indexes, last 5 years (chart: author; data: S&P Dow Jones Indices)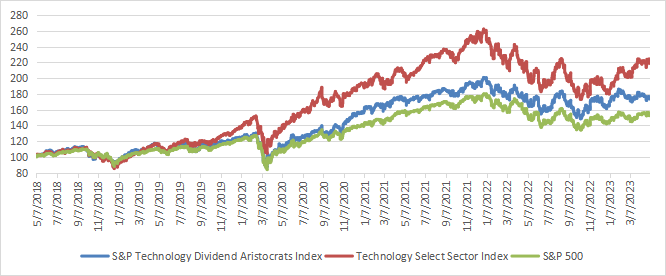
Based on these data, TDV strategy has underperformed the sector benchmark and outperformed the broad market.
The next chart compares total returns since inception of TDV, XLK, SPY and a broad dividend aristocrat fund: ProShares S&P 500 Dividend Aristocrats ETF (NOBL). TDV outperforms the two multi-sector funds, but still lags the technology benchmark.
TDV vs XLK, SPY, NOBL (Seeking Alpha)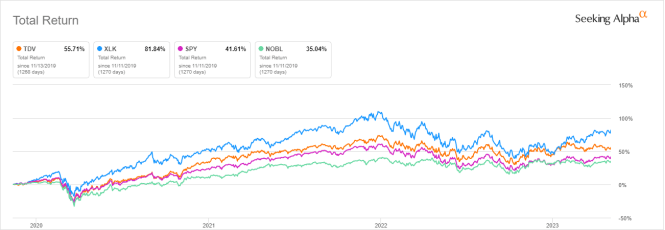
TDV annual distributions have increased from $0.58 to $0.92 per share between 2020 and 2022. This is a growth rate of 58.6% in two years, whereas the cumulative inflation has been about 14% in the same time (based on CPI). It is amazing, but it is unlikely to represent the fund’s long term dividend growth.
Scanning the portfolio
TDV is much cheaper than the sector benchmark regarding the usual aggregate valuation metrics, reported in the next table. The difference in price/sales ratio is especially impressive.
TDV | XLK | |
Price / Earnings TTM | 20.3 | 28.83 |
Price / Book | 5.12 | 7.99 |
Price / Sales | 2.38 | 5.76 |
Price / Cash Flow | 18.08 | 21.46 |
I have scanned TDV holdings with my preferred quality metrics. In my ETF reviews, risky stocks are companies with at least 2 red flags among: bad Piotroski score, negative ROA, unsustainable payout ratio, bad or dubious Altman Z-score. With these assumptions, there is no risky stock in the portfolio. Based on my calculation of aggregate metrics (reported in the next table), TDV has a slightly lower Piotroski F-score than XLK, and a slightly higher return on assets. The difference in Altman Z-score is not significant. These metrics point to a portfolio quality close to the benchmark.
TDV | XLK | |
Altman Z-score | 6.66 | 7.5 |
Piotroski F-score | 5.62 | 5.86 |
ROA % TTM | 11.98 | 11.02 |
Takeaway
ProShares S&P Technology Dividend Aristocrats ETF implements a dividend-growth strategy in technology. It has 38 holdings and follows an equal-weight methodology. the fund is quite concentrated in semiconductors and IT services.
ProShares S&P Technology Dividend Aristocrats ETF is much cheaper than the sector benchmark regarding aggregate valuation ratios, and quality is similar. The underlying index has underperformed the sector benchmark in the last 5 years. A note of caution: ProShares S&P Technology Dividend Aristocrats ETF may be a long-term investment, but it is inappropriate for short-term trading: the average trading volume is only 25k shares/day.
Quantitative Risk & Value (QRV) features data-driven strategies in stocks and closed-end funds outperforming their benchmarks since inception. Get started with a two-week free trial now.

This article was written by

Step up your investing experience: try Quantitative Risk & Value for free now (limited offer).
I am an individual investor and an IT professional, not a finance professional. My writings are data analysis and opinions, not investment advice. They may contain inaccurate information, despite all the effort I put in them. Readers are responsible for all consequences of using information included in my work, and are encouraged to do their own research from various sources.
Analyst’s Disclosure: I/we have no stock, option or similar derivative position in any of the companies mentioned, and no plans to initiate any such positions within the next 72 hours. I wrote this article myself, and it expresses my own opinions. I am not receiving compensation for it (other than from Seeking Alpha). I have no business relationship with any company whose stock is mentioned in this article.
Seeking Alpha's Disclosure: Past performance is no guarantee of future results. No recommendation or advice is being given as to whether any investment is suitable for a particular investor. Any views or opinions expressed above may not reflect those of Seeking Alpha as a whole. Seeking Alpha is not a licensed securities dealer, broker or US investment adviser or investment bank. Our analysts are third party authors that include both professional investors and individual investors who may not be licensed or certified by any institute or regulatory body.