SPLV: Can This Low-Volatility ETF Outperform In A Recession?

Summary
- SPLV tracks the S&P 500 Low Volatility Index, selecting 100 securities based on trailing twelve-month standard deviation. Its expense ratio is 0.25% and the ETF has $10 billion in AUM.
- SPLV underperformed the MSCI USA Minimum Volatility Factor ETF in 9/12 years between 2012-2023. SPLV's compounded returns lag by 0.70% per year and risk-adjusted returns are worse.
- SPLV also holds low-profitable stocks, particularly in the Utilities sector. The sector performs inconsistently in market downturns and is not one you should rely on to protect your capital.
- USMV is a superior choice based on its long-term track record and better fundamentals. I don't recommend readers buy SPLV.
- This idea was discussed in more depth with members of my private investing community, Hoya Capital Income Builder. Learn More »
Panuwat Dangsungnoen/iStock via Getty Images
Investment Thesis
The Invesco S&P 500 Low Volatility ETF (NYSEARCA:SPLV) will likely provide some downside protection when the next recession hits, but not enough to justify an investment today. The reason is that SPLV is 24% Utilities and holds too many low-profitable stocks that don't do well in market downturns. USMV, a cheaper alternative with a slightly higher five-year beta, is the better pick. It's outperformed SPLV in 9/12 years since 2012, is much better diversified at the sector and industry levels, and has more robust sales and earnings growth rates when downside protection isn't needed. I don't recommend readers buy SPLV, and I look forward to explaining why in further detail below.
SPLV Overview
Strategy Discussion
SPLV tracks the S&P 500 Low Volatility Index, selecting and inversely weighting the 100 least volatile stocks in the S&P 500 Index. The measure of volatility is the standard deviation of its price returns over the previous 252 trading days (one year). The primary investment objective is downside protection, and for long-term holders, this protection will offset underperformance in bullish markets. SPLV's expense ratio is 0.25%, and the fund manages $10.27 billion in assets.
The Index is straightforward, a positive feature for many investors. However, it's not an integrated approach. Low-volatility stocks typically are in three defensive sectors: Consumer Staples, Health Care, and Utilities. The system does not consider how well these securities interact with each other to reduce risk, and therefore, Index returns may be poor if these sectors fall out of favor.
Sector Exposures and Top Ten Holdings
The following table highlights sector exposures for SPLV, the iShares MSCI USA Minimum Volatility Factor ETF (USMV), and the SPDR S&P 500 ETF (SPY). I recently highlighted USMV as "U.S. recession insurance on sale," Part of this analysis explains why I think it's a better choice than SPLV.
Morningstar
USMV's sector exposures play an essential role. It's more diversified than SPLV, with Consumer Staples, Health Care, and Utilities accounting for 42% of the portfolio compared to 66% for SPLV. Unlike SPLV, USMV uses a model to optimize the Index, an integrated approach I favor.
SPLV's top ten holdings are listed below. As these are S&P 500 Index companies, most are recognizable. PepsiCo (PEP) and Mondelez (MDLZ) represent the Consumer Staples sector, while Johnson & Johnson (JNJ) and Merck & Co. (MRK) are the leading Health Care stocks. There are also 23 Utility stocks in the ETF, led by Consolidated Edison (ED) at #14.
Invesco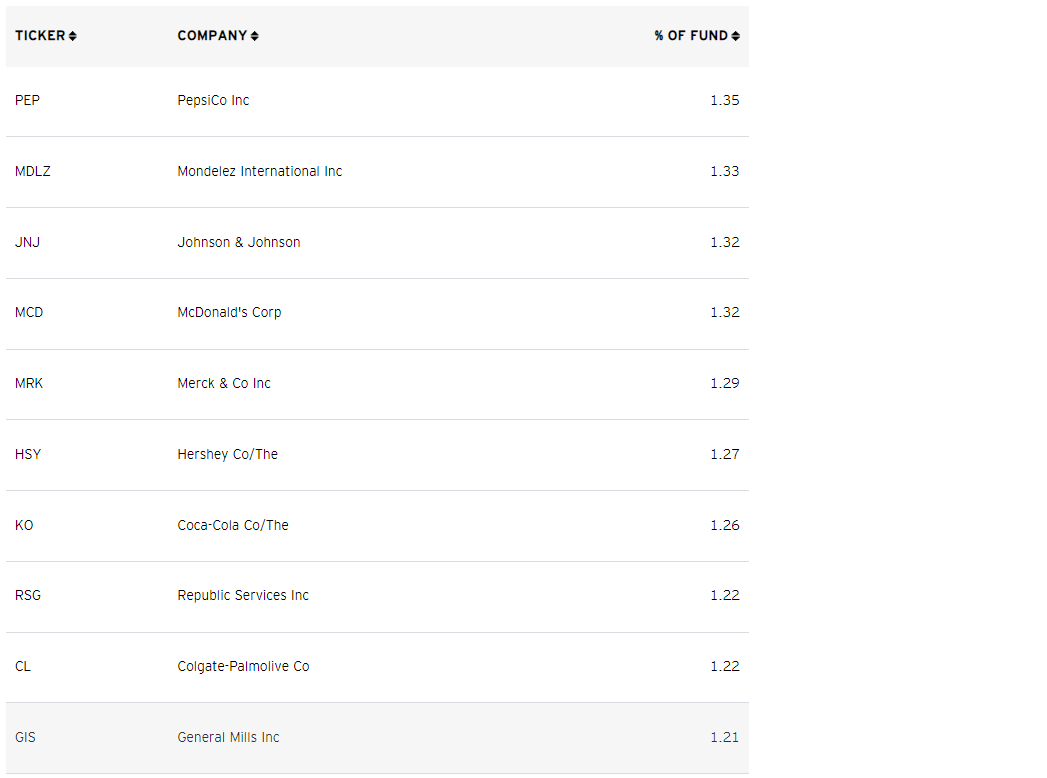
Performance
SPLV and USMV are the two oldest low-volatility ETFs with 2011 launch dates. Since then, over two dozen ETFs have been created, including some combining the high dividend and low volatility factors. I've included these funds' annual returns and relative rankings in the table below.
The Sunday Investor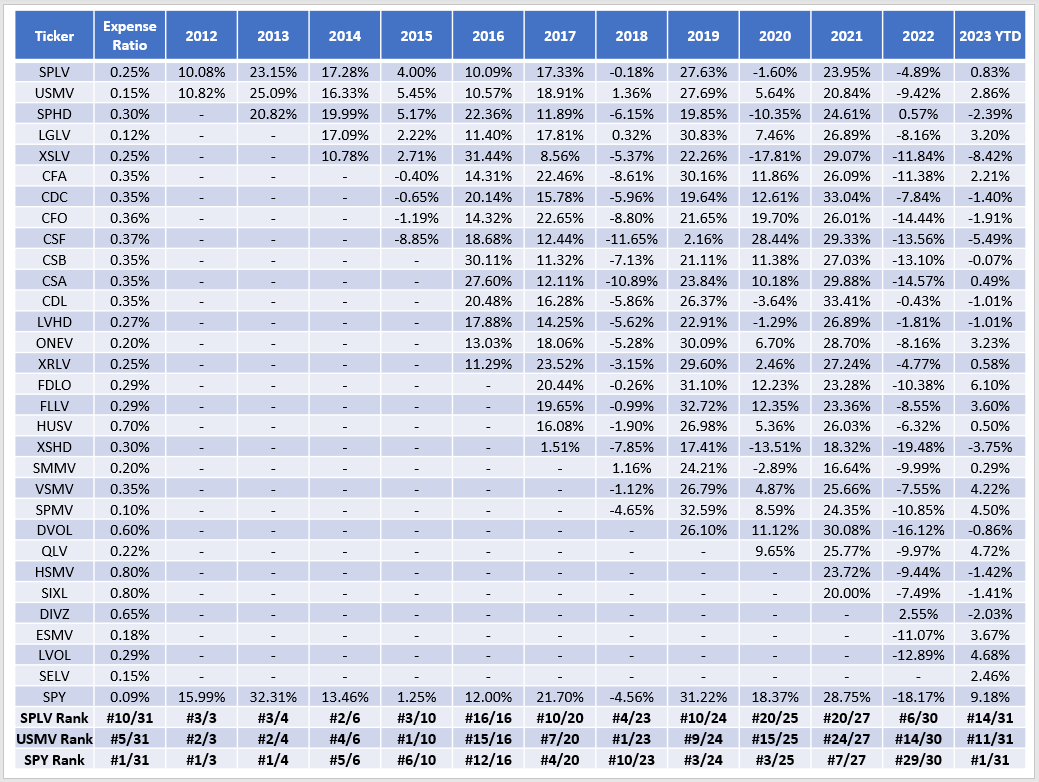
It's notable how all low-volatility ETFs have higher expense ratios than SPY. SPLV's 0.25% expense ratio ranks #10, and the category average is 0.34%. Fees will have to decline before the strategy becomes popular, and the relative rankings don't provide much confidence the method works long-term. For now, the top three (SPLV, USMV, SPHD) dominate the space, accounting for roughly 80% of the assets under management.
SPLV outperformed SPY in just four years (2014, 2015, 2018, and 2022). Except for 2014, it functioned as intended. When the broader market was flat or declined, SPLV outperformed. However, USMV topped SPLV nine times, including YTD through April. It also has a lower 0.15% expense ratio.
The following chart combines the annual return data from above. The data source is Portfolio Visualizer and assumes dividends you reinvest dividends. SPLV's annualized 10.64% was 0.76% less than USMV's. SPLV had a slightly worse maximum drawdown in February and March 2020 and lower risk-adjusted returns (Sharpe and Sortino Ratios) over the entire period.
Portfolio Visualizer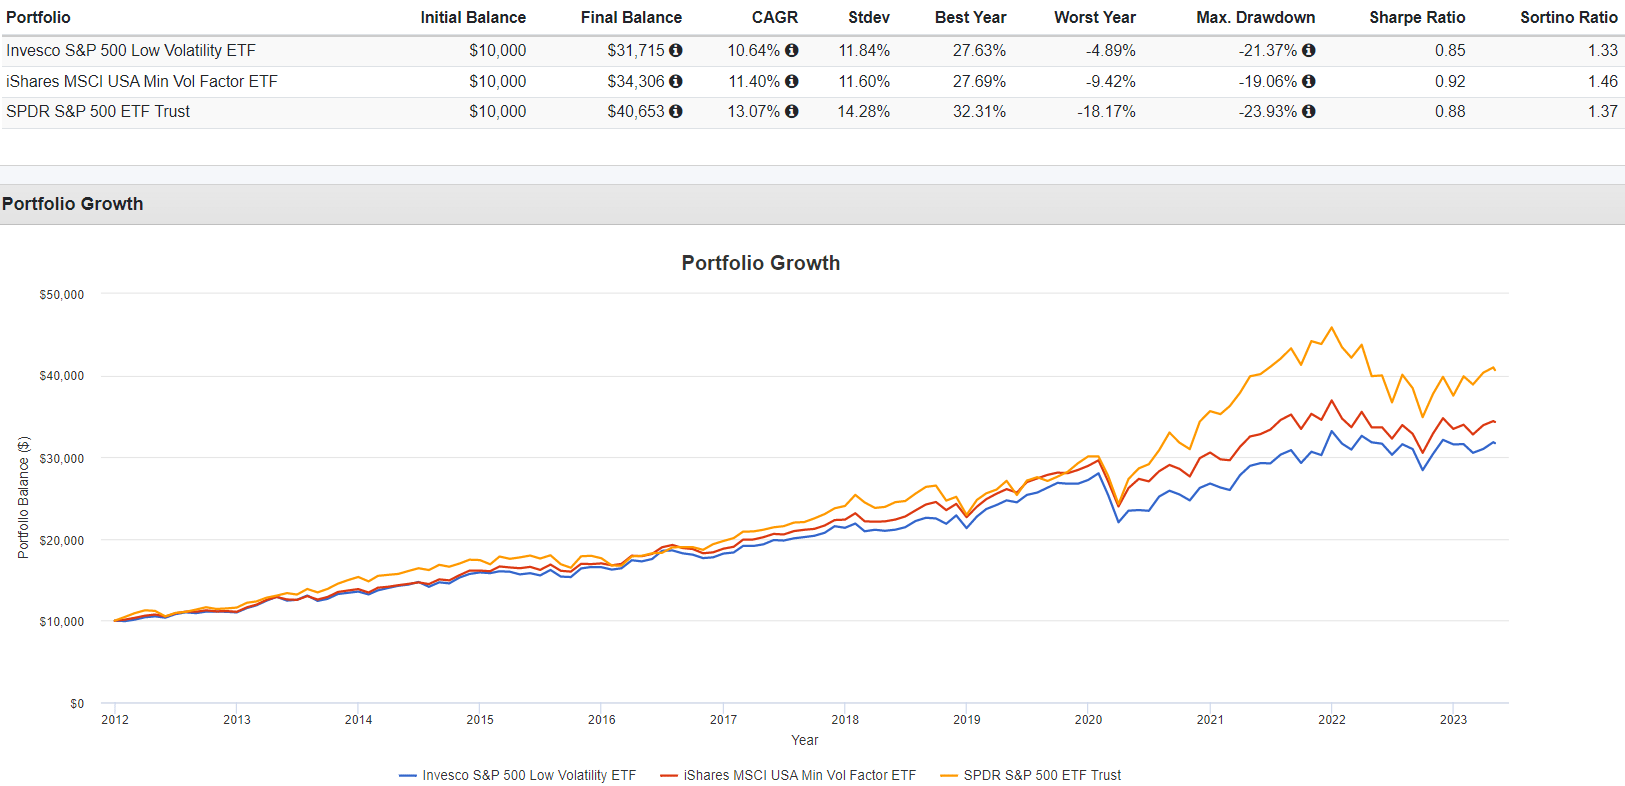
SPLV Analysis: Fundamentals and Profitability
While USMV has the long-term performance edge, it's essential to evaluate from a fundamentals perspective, as each has demonstrated they can substantially lag the broader market. We buy low-volatility ETFs for protection in slowdowns, but since we don't know when that will happen, it's best to select a balanced fund that scores well on several factors. Here are selected metrics for SPLV's top 25 industries. Summary metrics for SPLV, USMV, and SPY are in the final rows.
The Sunday Investor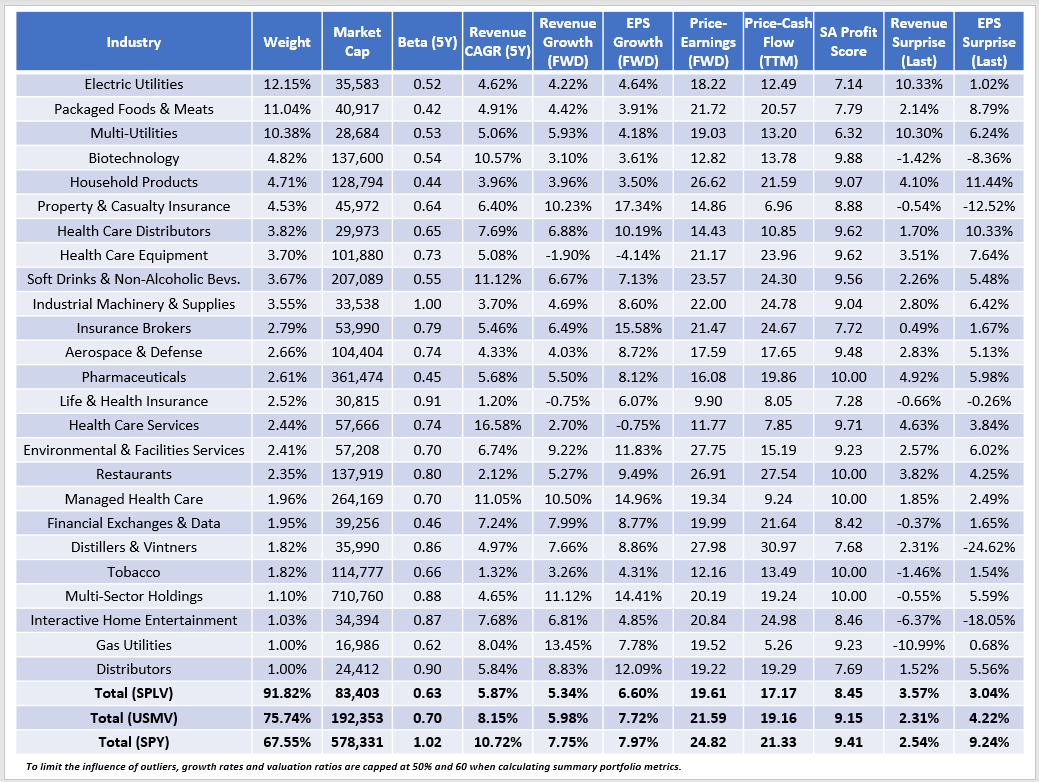
SPLV holds 100 stocks and is nearly an equal-weight fund. However, 92% of assets are in the top 25 industries. In contrast, USMV is better diversified at 76%, while SPY provides the most at 68%. In uncertain environments, there are benefits to selecting stocks from several sectors and industries because, short of exiting equities altogether, there are always risks. To illustrate, consider how the Utilities Select Sector SPDR ETF (XLU) performed in the previous market declines:
- 2001: -13% (SPY: -12%)
- 2002: -29% (SPY: -22%)
- 2008: -29% (SPY: -37%)
- 2018: 4% (SPY: -5%)
- 2022: 2% (SPY: -18%)
I discussed the complexities of investing in the Utilities sector in my buy recommendation from March 2022. In the article, I observed how higher interest rates and tightening yield spreads vs. U.S. Treasuries were not reasons to avoid the sector. In contrast, other factors, including outsized earnings surprises and higher authorized ROEs from Public Utility Commissions, would lead to outperformance, and this proved correct. Now, the opposite is true. Yardeni Research reports small earnings surprise figures this quarter, and some Utility rate increase requests are on hold now as consumers feel the pinch. As a reminder, SPLV is 24% Utilities. It's not a sector I would rely on, even though it's the reason for SPLV's low 0.63 five-year beta.
In particular, Electric Utilities are struggling. SPLV holds 13 of them whose share prices have declined on average 1.48% YTD and are just 0.70% above their 200-day moving average prices. The Southern Company (SO) is the exception, posting a $0.08 per share earnings beat on a $0.71 estimate this quarter. All others, including Duke Energy (DUK), Xcel Energy (XEL), and Pinnacle West Capital (PNW), were low-single-digits or worse.
SPLV has a valuation advantage, trading at 17.17x forward earnings compared to USMV's 19.16x. However, not only is USMV better balanced, but it has a:
- higher expected sales and earnings growth rates
- higher last quarter earnings surprise (4.22% vs. 3.04%)
- higher profitability score (9.15/10 vs. 8.45/10)
The higher growth rate is important because we don't know when the next downturn will occur. The better earnings surprise figure is one gauge of market sentiment and indicates analysts now have more reason to be bullish on USMV over SPLV. Finally, profitability is a good proxy for quality. The Ken French Data Library model portfolios demonstrate how highly profitable "robust" large-caps consistently outperform in downturns. Consider the average equal-weighted returns for these portfolios vs. neutral and weak portfolios:
Chart: The Sunday Investor; Data: Ken French Data Library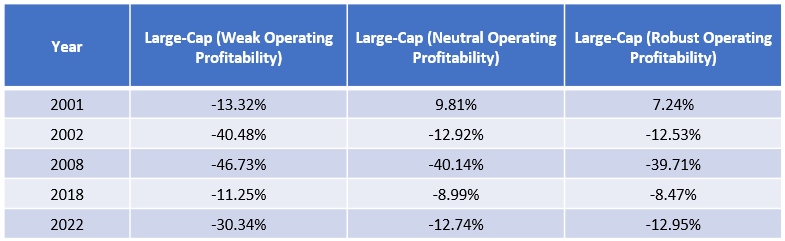
The data is mixed for the neutral and robust portfolios. However, it's evident how low-profitable portfolios do poorly in recessions. It's difficult to say if SPLV qualifies as neutral or robust. However, 24% of the portfolio has a Seeking Alpha Profitability Grade of "B" or worse vs. 9% for USMV. If you're looking for recession protection, start with this metric, which Seeking Alpha provides for nearly all U.S. equities.
Investment Recommendation
I don't recommend readers buy SPLV for three reasons:
1. SPLV's track record against USMV is poor. SPLV underperformed in 9/12 years. Its long-term track record (compounded returns) is also lower.
2. SPLV's 24% exposure to the Utilities sector is a risk. Utilities do not always provide good protection in recessions and, in some cases, have underperformed. Their relationship with interest rates is complex, and relatively weak earnings surprises will lead to underperformance.
3. SPLV holds too many low-profitable stocks. Model portfolios at the Ken French Data Library demonstrate how high-quality large-cap stocks typically outperform in down years. SPLV's weaker profitability score compared to USMV's (8.45/10 vs. 9.15/10) is a headwind.
Feel free to read my article on USMV here, and I look forward to answering any questions in the comments section below. Thank you for reading.
The Sunday Investor Joins Income Builder
The Sunday Investor has teamed up with Hoya Capital to launch the premier income-focused investing service on Seeking Alpha. Members receive complete early access to our articles along with exclusive income-focused model portfolios and a comprehensive suite of tools and models to help build sustainable portfolio income targeting premium dividend yields of up to 10%.
Whether your focus is High Yield or Dividend Growth, we’ve got you covered with actionable investment research focusing on real income-producing asset classes that offer potential diversification, monthly income, capital appreciation, and inflation hedging. Start A Free 2-Week Trial Today!

This article was written by

I perform independent fundamental analysis for over 850 U.S. Equity ETFs and aim to provide you with the most comprehensive ETF coverage on Seeking Alpha. My insights into how ETFs are constructed at the industry level are unique rather than surface-level reviews that’s standard on other investment platforms. My deep-dive articles always include a set of alternative funds, and I am active in the comments section and ready to answer your questions about the ETFs you own or are considering.
My qualifications include a Certificate in Advanced Investment Advice from the Canadian Securities Institute, the completion of all educational requirements for the Chartered Investment Manager (CIM) designation, and a Bachelor of Commerce degree with a major in Accounting. In addition, I passed the CFA Level 1 Exam and am on track to become licensed to advise on options and derivatives in 2023. In November 2021, I became a contributor for the Hoya Capital Income Builder Marketplace Service and manage the "Active Equity ETF Model Portfolio", which as a total return objective. Sign up for a free trial today! Hoya Capital Income Builder.
Analyst’s Disclosure: I/we have a beneficial long position in the shares of SPY either through stock ownership, options, or other derivatives. I wrote this article myself, and it expresses my own opinions. I am not receiving compensation for it (other than from Seeking Alpha). I have no business relationship with any company whose stock is mentioned in this article.
Seeking Alpha's Disclosure: Past performance is no guarantee of future results. No recommendation or advice is being given as to whether any investment is suitable for a particular investor. Any views or opinions expressed above may not reflect those of Seeking Alpha as a whole. Seeking Alpha is not a licensed securities dealer, broker or US investment adviser or investment bank. Our analysts are third party authors that include both professional investors and individual investors who may not be licensed or certified by any institute or regulatory body.