The Market According To Elliot Waves With Avi Gilburt (The Market Pinball Wizard)

Summary
- Our guest this week is Elliot Wave Leader, Avi Gilbert.
- Today's podcast is a jam-packed episode - a crash course in Elliot Wave Theory and a look at key market projections in the S&P 500 in the years ahead.
- We also take an exclusive look into the metal and oil sectors for traders looking to take positions.
Just_Super
Editor's Note: This is the transcript version of the previously recorded show. Due to time and audio constraints, the transcription may not be perfect.
We encourage you to listen to the podcast embedded above or on the go via Apple Podcasts or Spotify.
This episode was recorded on May 3, 2023.
Relevant Links:
Timecodes:
(01:04) - What is Avi’s market secret?
(01:45) - What is Elliot Wave Theory?
(02:45) - Where is the market headed from here?
(05:48) - Devils advocate on Elliot Wave Theory in today’s markets
(09:32) - Are we still in a bear market?
(16:09) - What does a long-term top in the market look like?
(17:44) - What should people do with their funds?
(23:51) - What about metals and commodities?


Transcript
Daniel Snyder: Welcome back to Investing Experts Podcast. I'm Daniel Snyder.
This is a special episode listener. I am joined today by Avi Gilburt, the Elliott Wave theory specialist who has been contributing his content to Seeking Alpha since 2011. So it's safe to say that he is a legend with a great community because the numbers definitely back it up. In this episode, we're getting into his charts, which are shared on the Investing Experts Show Notes page on Seeking Alpha in case you want to check him out, highlighting what his projections are for the S&P 500 (SP500), oil market, and gold market for the years ahead. I really hope you enjoy this episode because I know I sure did.
If you're enjoying the show, this episode, the guest let us know. You can follow, Investing Experts on Seeking Alpha, leave ratings on your podcast app of choice and engage in the comments section of the show notes page. We love hearing from you, but I know our guests do as well. And if you don't believe me, just check out the show notes page on Seeking Alpha, where our guests love to jump in to the discussions. Now, let's get to the interview.
Alright, Avi Gilburt, the man, the myth, the legend, as I mentioned, you've been contributing to Seeking Alpha since 2011. What is your secret?
Avi Gilburt: Well, we utilize Elliott Wave analysis as our primary methodology. Of course, we do technical analysis overlaid on top of that, but our primary methodology is Elliott Wave analysis.
Daniel Snyder: And what areas of the market are you covering within your Elliott Wave analysis?
Avi Gilburt: We have 16 and -- I'm sorry. We have 23 analysts that cover markets all over the world. So we're literally covering markets all over the world utilizing Elliott Wave analysis.
Daniel Snyder: So, for the people that don't know what Elliott Wave analysis is, can you give us just like a quick beginner's crash course?
Avi Gilburt: Sure. Back in the 1930s, a gentleman named Ralph Nelson Elliott, identified that the markets were fractal in nature. What does that mean? Well, it means that they are variably self-similar at all different degrees. And I know that also sounds complex. But basically, what he identified was that the markets move in basic patterns, and these patterns repeat over and over and over again.
And they're all literally directed through Fibonacci mathematics to identify their turning points in the market. What he specifically found was that the markets move in a primary trend within a 5 wave structure, and then they move within a corrective trend in 3 wave. So, you know, effectively, that is Elliott Wave in a nutshell.
Daniel Snyder: So you have this massively successful investing group on Seeking Alpha, under the Market Pinball Wizard, and you're using this Elliott Wave theory methodology. So you probably have an idea of where the markets are headed from here. Do you or do you not?
Avi Gilburt: The answer is not always. Most of the time, the market will provide to us very clear perspective no matter what timeframe we're looking on. But sometimes when you're dealing with corrective structures, there are number of paths that it could take. So we won't always have a very clear perspective, but when we don't, we will, of course, let our clients know and we give them the parameters as to what we're looking for. But we're upfront and honest about the limitations of what we can foresee going into the future.
Daniel Snyder: So if somebody was to say, I want to check out your research. I want to see what this Elliott Wave trading is? Where would you start them off?
Avi Gilburt: Well, the bible was actually written by Robert Prechter called the Elliott Wave Principle. But I will tell you that it is a very, very difficult read. It literally took me about 5 or 6 reads before the light bulb went on. I wish I had what we do for people today, and that is we have people who train on a daily basis how to learn and understand Elliott Wave.
We have some of my -- that's what -- I have one specific analyst that is dedicated to that, and we have 3 or 4 analysts that will do several times a week, live videos where they'll take you through the Elliott Wave basics, and we also have written materials and so on and so forth, but it's not the easiest of methodologies to learn. Which is why very, very few people in the world are able to do it properly. Unfortunately, there are many people that claim that they do Elliott Wave analysis, but I call them more -- they're more like wave slappers. They'll throw numbers and letters onto a chart, the way it looks or to support the buyers that they may have coming into that [chart] perspective.
But what we do is, we have to identify because I said the market is fractal in nature. So all the different degrees have to line up mathematically. That takes a lot of work. So it really isn't for everybody, but if somebody wants to learn a new methodology that they'll find extraordinarily helpful when they look at the markets. This is the one I would suggest. I mean, I can -- I thank God, I can no longer count? How many of our members have told us how much we have changed their lives. And that's why I've been doing this for as long as I have.
Daniel Snyder: Avi, let's say there's a listener right now saying, there's no way that this structure holds everything to the market. Right? We're talking about the FOMC meeting that just happened with interest rate hikes, wars that happen, credit tightening. Are you actually saying that this all falls within that? The overall structure?
Avi Gilburt: The answer is, yes. And oftentimes, you will see very, very weird results. I'll give you a great example for our -- let's go back to October of 2022. And if we remember, the market was approaching the 3,500 region. On the downside, we had a very large decline. And we were approaching that 3,500 number, and I was looking for a turn up. I was looking for the market to exhaust itself to the downside based upon our analysis and to turn up in a very strong way off that 3,500 region.
Now, what was very interesting thing about it was, most people were coming out with prognostications that if the market was to -- if the CPI report that came out the day we hit the low, if that CPI report was going to be worse than expected, then we were going to see a very, very strong continuation lower, some people claiming we were even going to drop another 5% to 10% lower. But we -- I actually put out an update to my members, night before.
And I said, look, I'm looking for one more spike down and a reversal. And that was before the CPI report came out. And then we -- the CPI report came out the next day. It was worse, much worse than expected. And as we were hitting the lows that morning, within half an hour hitting that low, I said, now is where I'm expect -- we have to fight down. And I said, now I'm expecting the rally to begin. My initial target on the rally was the 4,100 to 4,200 region before we saw a pullback and then continued higher.
And I laid all of this out before we even struck the bottom. We got a worse than expected CPI report, the market bottomed exactly where we expected and began the rally as we expected. What was very interesting thing about it was it got everybody else who was specifically focused on the substance of the CPI report on the wrong side of the trade. Now, I will say this and I've said this many, many times over the years.
News, economic reports, earnings, what have you, whatever news that comes out, they can act as a catalyst to a market move. However, the substance of that news will not necessarily provide you with the appropriate direction for that market move. And we have seen it so many times. If anybody is actually a -- somebody who studies market history, they will see this over and over and over again.
Just to give you an example, we got that bottom on in an unexpected way back in October, and then we topped in December on a better-than-expected PPI report. So we bottomed on a worse than expected PPI report and then we topped in December on a better-than-expected PPI report. I mean, those were two perfect examples that we've seen recently where the market does as the market does and the substance of what comes out is not necessarily just what direction we're going to go.
Daniel Snyder: When people think about the bear market that we've been going through, A) are we still in a bear market? B) is that 3,500 the bottom of the bear market? Any thoughts on that?
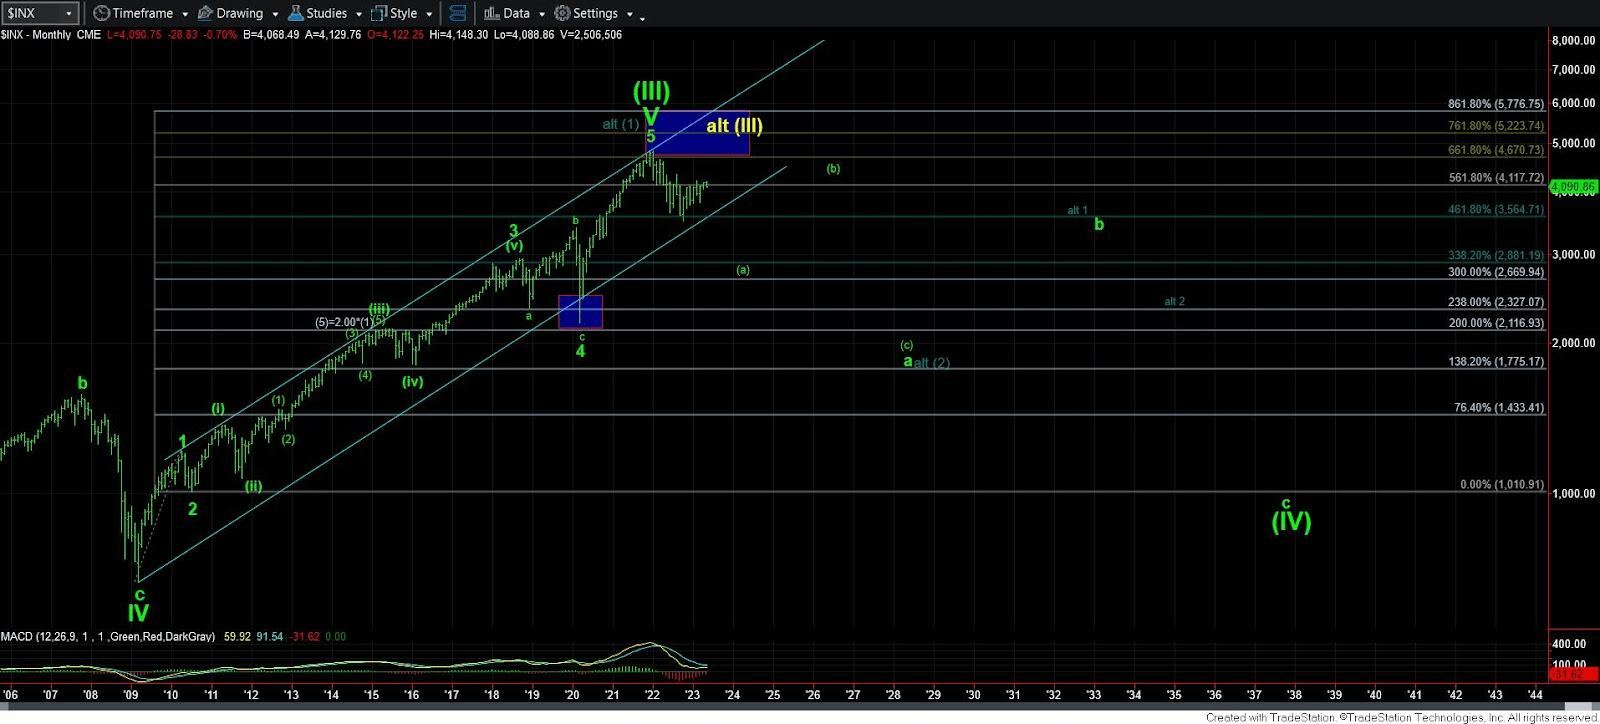
Avi Gilburt: Yeah. I definitely have thoughts on it, and I can't say they're good thoughts, but I will say this. I'm going to start back and explain going back to the top in 2021. When we were towards the end of November, into early December, I started preparing our clients and members that I'm expecting the market to pull back as we move into 2022. I did not expect we were going to hit a major top yet, but I expected a pullback somewhere between the 4,000 to 4,400 region depending on how the market was going to develop on that pullback.
Now, clearly, when the market was setting up to break down below 4,000, I already started getting my clients raising cash at 4,800, and then again at 4,600 on that following bounce. But when we got down and broke down below 4,000, it clearly put a little bit of an issue in our longer-term charts. The long-term charts suggests that 2021 really was not the natural high to the market. But because we broke down below 4,000, I now have to consider that quite strongly.
So, what I'm coming down to is over the next couple of months, I'm expecting clearly the market to pop out and then I'm expecting a multi-month pullback. Good that multi-month pullback being 5 waves. Remember, primary trend, 5 waves to that multi-month pullback be an initial 5 wave decline that takes us back down towards the October lows. Well, then the market is setting up break down to 3,000 or lower as we look out towards the end of the year into early 2024.
That will seal the deal that we are in a multiyear and could be even a multi decade bear market. Of course, you're going to have multi-year rallies during that bear market. So that breakdown that I would expect if we get 5 waves down to set up a drop to 3,000 or lower. After that 5 larger 5 wave decline concludes, I'm looking for probably what will be a multi-year rally, probably back towards the region we're in now. Maybe up to 4,300 to 4,600, before the next leg of the bear market take shape. So, yes, I do view us as potentially being in a bull market, but I need to see how the market develops over the next several months to really confirm that.
If the market declines in a corrected fashion over the next couple of months, a 3 wave move, then it leaves the door open to go back over 5,000 for a higher high before a larger degree bear market begins. One way or another, I've been writing about this since 2015 that once we got into the early to mid-2020s, I was looking for a very long-term bear market to begin. So, I'm still of that expectation. The only question is, do we get one more push to a higher high or not? And that is what probably the next several months are going to clarify.
Daniel Snyder: So you definitely peaked my interest, and I'm sure you peaked a ton of listeners' interest as well talking about this multiyear bear market looming on the horizon. Can't help to think about, maybe this is aligning with the recession a little too closely if you believe you're in the recession camp or maybe it's more aligned with the Druckenmiller camp. I believe he came out and [indiscernible] decade coming forward. I mean, it can't be just coincidence. Can it?
Avi Gilburt: Well, I mean, I've been writing about this since about 2015. Maybe once a year, I penned an article explaining that I'm starting to see storm clouds down in the future. And I was pointing to the early to mid-2020s as my expectation. So I've been expecting this for quite some time. The reason I expected is because we are now completing a very long-term 5 wave structure and hold on to your seats when I say where from.
From the bottom of the 1929 market crash. So when that bottomed, I think it was 1931. I think it was a 2-year market crash. When that bottomed in 1931, we began a very long-term bull market, which is completing 5 waves up. As I said, the only question I have is, do we have a higher high yet to come before it completes or not? So we're completing a very long-term 5 wave structure. After you complete a long-term 5 wave structure, you're expecting a multi-year, potentially multi-decade, 3 wave bear market.
Now the reason why I say it could be more than one decade is because the -- and I discussed this earlier that we talk about varying degrees and all the various degrees have to fit within the larger degrees to make up a good Elliott Wave analysis. Well, if you go back and you look at a very long-term chart, we use a hundred year chart for this. When you go back and you look at a hundred-year chart, you'll look at the years 2000 to 2009.
And a hundred-year chart looks very small. But you would notice that that was a very sideways market at that time from 2000 to 2009. That was a correction of one lesser degree than I am expecting to begin once this -- once we get confirmation of this long-term cop in the market. Now, if a lesser degree correction takes 9 years, my expectation is that a higher degree correction is going to take much longer. So in fact, this type of correction, if we have begun it, could last between 13 years to 21 years.
Daniel Snyder: Alright. So let's follow-up on that. Can you tell us what a long-term top in the market actually looks like? Well, let's start -- let's assume the next drop begins a 5-wave decline. Let's start with the assumption that top is already in and the next drop is going to be a 5 wave decline that'll take us -- my guesstimate right now is about 2,700 to 3,000 on the next decline. Thereafter, you're going to get another rally that'll take us back to 4,300 to 4,600.
And after that, you'll probably see a market crash that will probably point us back down to anywhere between 1,800 to 2,100. So just starting with that, and that should probably take us probably at least another 5 to 7 years is my guesstimate to do all of that. If that occurs, then the rally after that market crash will tell me if we are in for another 10 years -- another 7 to 10 years of bear market.
Because if the rally after that crash and you could see this on the monthly chart that I sent you earlier. If the rally after that crash is corrective again, then that's going to set up a bigger crash than we saw back in 2008. So that's -- I mean, you could see this laid out effectively on that monthly chart that I sent you.
Daniel Snyder: You're talking about this correction, I can't help but think about all the investors out in the world that have their retirement funds in, like, long only positions. Is the idea that they should just be exiting those positions and maybe putting them into a safe asset at this point. I mean, do people still turning to gold? Are we turning to US treasuries? Do you have any thoughts on that?
Avi Gilburt: Well, let's take this one step at a time. I am still not yet confident that we are indeed going to be start -- we are -- have indeed started that bear market. I'm not going to have a better idea for another several months. Now, what do I tell my clients and anybody who is not exactly into risk at this point in their life, I've been telling them that you should be raising cash. And I've been saying this to them since the top back in 2021.
And then again on the rally back to 4,600, my analysis has told them, look, it's time to raise cash from a long-term perspective. If the market gives us the better inkling that is going to go back to a higher high and if you still choose, you can always get back in. But for now, the market is at a point where, you know, bigger issues seem to be coming up on the horizon. Now, again, could we get that that mini crash from, you know, let's say wherever we top now down to 28 – 2,700 to 3,000, the market will likely rally back after that in a multiyear rally back to 4,300 to 4,600.
That probably will be the last opportunity investors will have to divest before we start looking for much lower levels, like 1,800 to 2,200. And I'm even afraid to say where the depth of this long-term bear market could take us. It could take us all the way down as deep as 1,000 on the S&P 500. And I know that'll probably, people will probably say that that's just not possible. Well, I'll give you another example of, you know, when I first came on to Seeking Alpha, it was around the time where gold was going through a parabolic rally in 2011.
And I wrote an article outlining gold, my expectation for gold to top. And this is during the parabolic rally that I outlined for it to top at 1915 with my calculated target or 1916. And at the time, people thought I was crazy. Because everybody at the time were arguing not about where we’re going to top, but how far through 2,000 it was going to go. So people thought I was crazy. Even before it topped, I said, I think gold can not only top at 1915, I think it can drop down to the 1000 range.
And I have to tell you I was almost laughed off of Seeking Alpha when I wrote that. As we now know, gold topped at 1921. I was off by 6 bucks on that, and I think we bottomed at 1050. So, you know, the analysis that we do, especially on the longer term degrees, usually winds up being quite accurate. So while it may sound unbelievable at this time, I can assure you it is not. And I wish, I pray that I'm wrong in my analysis, but I can tell you that once we hit the top and once we confirm that we've hit a long-term top in the market, that's what I fear.
Daniel Snyder: There's a lot of fear coming from some of those numbers that you're throwing out as well. I mean, seeing the S&P 500 go back to the 1000 level. I mean, that would spook every investor. Right? So I think if people are thinking long-term I mean, what was the time frame on that? I hope that's a couple decades away, isn't it?
Avi Gilburt: Well, to get to a 1,000 it will take us minimally 13 years. Minimally is what my expectation is.
Daniel Snyder: So people are thinking now, you say, 13 years, I'm sure there's people that are entering retirement. Right? We know the baby boomers generation is entering retirement more and more. Millennials are older. Now Gen Z is coming into the workforce. Doesn't that kind of make it a hard case to tell people to invest in S&P 500 now?
Avi Gilburt: I'm not telling people to invest in the S&P 500 at all. That has not been my perspective. My perspective has been a measured perspective, understanding – look I have about 8,000 clients and about a 1000 of them are money managers. And I have to understand that each and every one has a very different risk profile, a different time horizon, has different goals. So when we try to explain our perspective to our clients, we have to explain to them, you know, yes, we expect a rally here, but trying to trade for that rally may not be for everyone.
There's additional risk associated with it. So, it's not necessarily in investing -- right now, it's not necessarily an investing environment. There are a number of stocks that my staffs have looked at that. I mean, they look like there's some stocks that look like and have a phenomenal next 2 years. But along the same lines, you know, I am not yet confident that the market is going to make a higher high. So everybody have approached the markets very differently based upon their own their own goals.
And so we're not telling everybody, yes, invest, invest, invest, dollar average no. Because the potential could be that we could be in for some bigger trouble than most foresee right now.
Daniel Snyder: Alright. So that's a lot of the S&P 500, the indexes, a lot of the stock market. What about, say, metals and commodities? I know that there's a lot of investors that focus on that as well. What are your thoughts in that sector?
Avi Gilburt: Well, we can break that up right now into -- I'm going break it up into, I'm going to bifurcate it into two perspectives. The metals market and the oil market. So I'm going to break that up into two different perspectives.
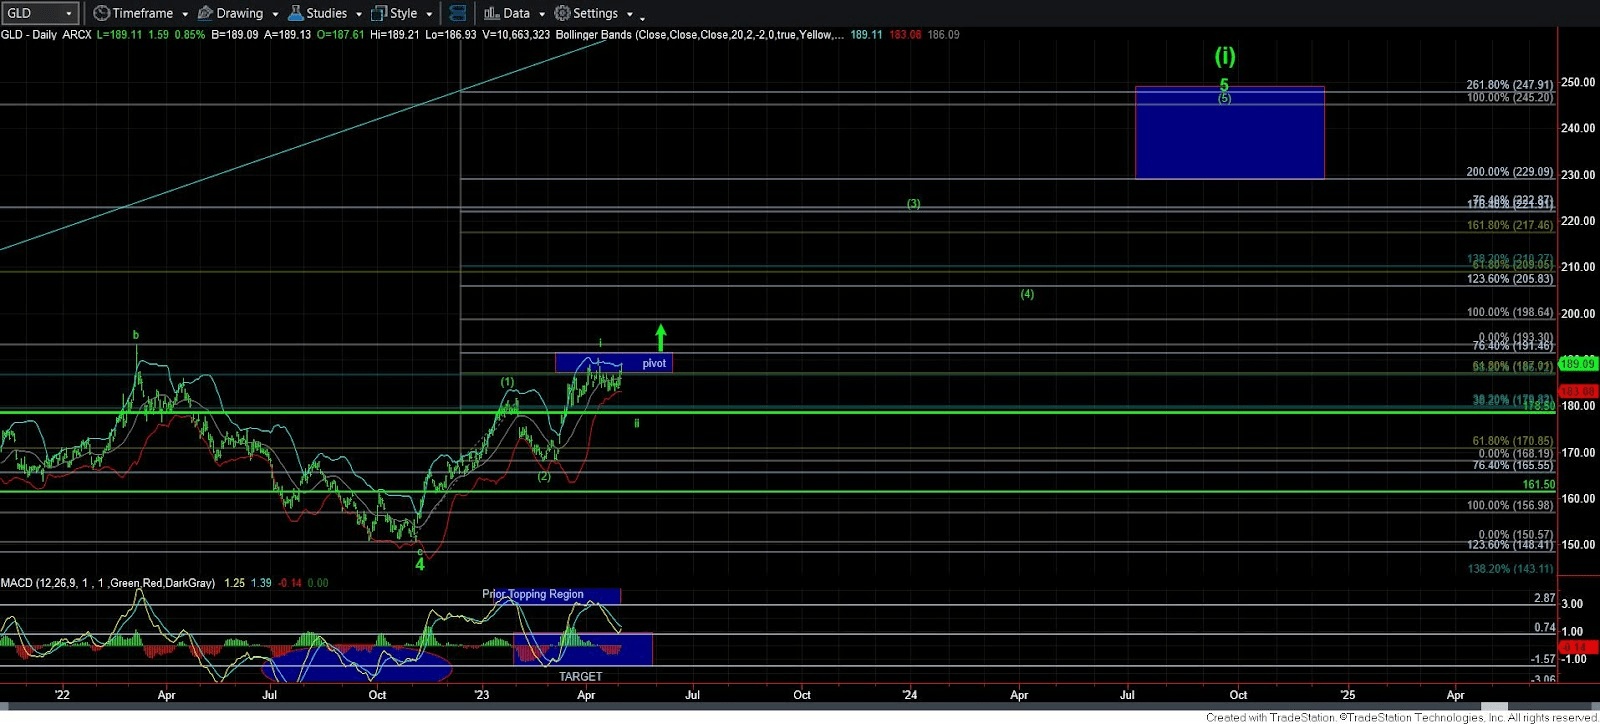
On the metals market, I think the metals market is -- and I wrote about this last year when I started seeing bottoming in the metals market. And I told my own clients, it was around -- when we started going into the last quarter of the year, I said my expectation is we're going to start seeing a bottoming in the complex and we're going to see a multi-year rally out of that bottoming. And that's pretty much what we've gotten.
I believe gold, NYSEARCA:GLD see a bottom here back in early November. And since then, we have a sizable rally, but I just think that that was just the intro. I think the main event will likely begin over the coming months. I can foresee a little bit more of a pullback if we're lucky. If not, the market can just take off from here. I wrote an article not too long ago that my minimum target on gold was, I think, 2420. I believe that was the number. I don't recall offhand.
Gold, as we speak right now is at about 2050. So, you know, I'm expecting at least a 20% rally in gold from here. And depending on how that rally structure takes shape, as I'm saying, how the Elliott Wave structure takes shape. If we start seeing some exceptional extensions on that rally, we could be going as high as 2,700. So, I'm 2,400 really – 2,400 region was really my minimum target on this next bigger move. Silver, should easily reach the prior highs. And in fact, the way silver is set up, we could see a repeat of the 2010 parabolic move in silver because silver has lagged so much over these last years. Silver could see a massive catch up move over these coming -- over the next 2 years.
Now, as far as the minors, the minors are a little bit of a mixed bag. Some miners will not perform as well as others. I'm concerned, for example, Newmont Mining (NEM). Newmont Mining may have an issue. It may not perform as well as all the other miners. Why do I say that? Because back in April of -- quick peek at the chart, if you can bear with me. Yes. Back in April of 2022 -- just to give you some background.
Back in 2015, as the market -- as the metals market was coming down into the low that I expected, we actually rolled out a mining stock service, and we rolled it out in September of 201.5 And one of the stocks that I bought at the time, clearly was Newmont. I mean, at the time, you know, Newmont was considered one of the largest and we saw some tremendous upside with it. And I think I bought it somewhere between $15 and $16 if memory served.
And as the market rallied up into April of 2022, we then struck the target that I set for that rally years before. And I told my clients, when we get up into the 82 to 84 region, I'm going to be divesting of almost all of my Newmont stock that I bought in 2015. Well, they thought I was crazy at the time, but I did. And if you look at the chart now, I think Newmont topped around 85 and then proceeded to drop down to about 37.
So it lost more than 50% of its value from that point. And of course, that was the time where I was looking to buy back some of my Newmont. Not all of it. Because Newmont may not participate in the next rally that I foresee in the same manner as some of the other stocks. So, I think you have to be very careful about what you’re picking and choosing when you're buying the mining stocks. But if you want to just look at the general GDX chart, for example, my expectation is I think GDX should well exceed 50, potentially getting up as high as 65.
So for now, you know, we are looking for maybe a little bit more of a pullback in GDX, but ultimately, I think GDX is getting set up to rally strongly later this year and well into next before it completes this next major rally.
Daniel Snyder: That’s some [indiscernible] price targets on GDX. I just want to clarify because you kind of went through silver pretty quick. You mentioned the 2011 parabolic move that happened in silver.
Avi Gilburt: 2010.
Daniel Snyder: 2010. Yep. 2010 is when it started. I believe, up in the beginning of 2011. But the price target was well over 40. Is that kind of where you're seeing Silver go again? Is that what you said?
Avi Gilburt: Yeah. I'm expecting silver to get back up towards 50 again. Yes.
Daniel Snyder: Okay. Thank you for clarifying that. And then you said you wanted to mention about the oil markets as well. What's going on in that segment?
Avi Gilburt:` Well, I tracked USL for my other -- some of my other staffs tracked WTI and the futures on CL and so on and so forth. But I've been tracking for a lot of our clients, the ETF USL. And USL has been involved in a sizable, a very long pullback. And my expectation is, I think we can potentially see a lower low in the coming months potentially sometime maybe into the summer months.
And then I'm expecting a nice rally where we could probably see oil double off the low or come close to double off the low that we complete later in the summer, I believe. And by the way, we see the same in oil equities. We're seeing some downside that we've been expecting for some time. We're expecting oil equities to outperform most everything else as well.
Daniel Snyder: Now that's interesting when we think about oil doubling with what's looming on the horizon, whether it's OPEC or recession or whatever. It's kind of eerie, isn't it? That it might line up?
Avi Gilburt: Well, you know, I've learned long ago because when I first started doing this, I know I would look at the news, I would look at what my chart said, and then I would just completely ignore what my chart is saying, because I would say it just can't be.
And that I learned after a few years of doing that, I learned I really shouldn't be doing that because the chart has been a hell of a lot more accurate than anything I'm following in the news. So, you know, right now, for the most part, I generally ignore what the common perception is. Common perception in markets usually is wrong. But for now, I mean, that's really what I'm seeing in my charts.
Daniel Snyder: Just a reminder, anything you hear on this podcast should not be considered investment advice. At times, myself or the guests, might own positions in the securities mentioned. But this is for entertainment purposes only, and you should seek advice from a licensed professional before investing. We'll see you next episode.
We encourage you to listen to the podcast embedded above or on the go via Apple Podcasts or Spotify.
This article was written by
