HYBB Vs. HYG: Comparing Two IShares High Yield ETFs

Summary
- The iShares BB Rated Corporate Bond ETF invests based on the ICE BofAML BB US High Yield Constrained Index.
- The iShares iBoxx $ High Yield Corporate Bond ETF invests based on the Markit iBoxx USD Liquid High Yield Index.
- With similar results over HYBB's short life, my preference is HYBB for its much lower expense ratio. Investor in HYG might consider tax-loss swap. I rate both as Hold.
- Looking for more investing ideas like this one? Get them exclusively at Hoya Capital Income Builder. Learn More »
tumsasedgars
(This article was co-produced with Hoya Capital Real Estate)
Introduction
Investors like high-yield, or junk bonds for the income they generate, hopefully understanding they come with more risk of default. These bonds will be rated BB or lower by Standard & Poor's and Ba or lower by Moody's. Using the S&P ratings, the next chart gives readers an idea of the risk for each rating level.
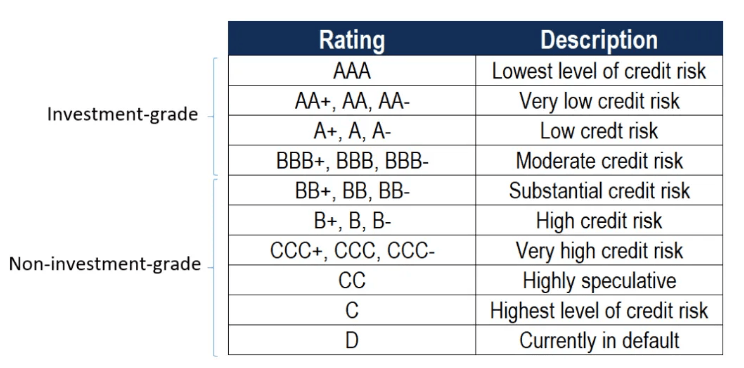
corporatefinanceinstitute.com
Until you get down to CCC, bond default rates are low, though there is a jump when entering "junk" status.
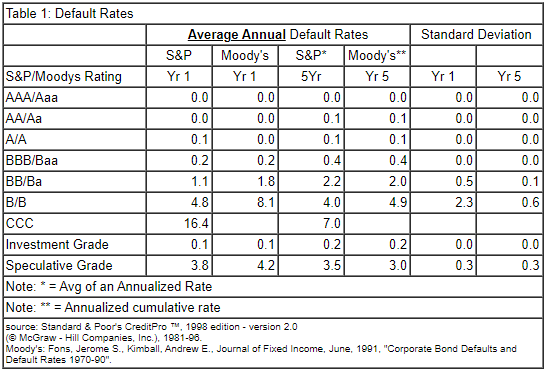
efalken.com
The next chart shows defaults by rating and how the rate changes as the bonds age.
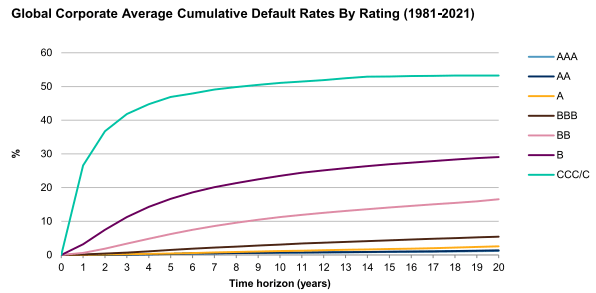
maalot.co.il/Publications
This article reviews and compares two similar High-Yield ETFs from iShares:
- iShares BB Rated Corporate Bond ETF (NYSEARCA:HYBB)
- iShares iBoxx $ High Yield Corporate Bond ETF (NYSEARCA:HYG)
With similar results over HYBB's short life, my preference is HYBB for its much lower expense ratio. Investor in HYG might consider tax-loss swap. I give both a Hold rating at this time.
iShares BB Rated Corporate Bond ETF review
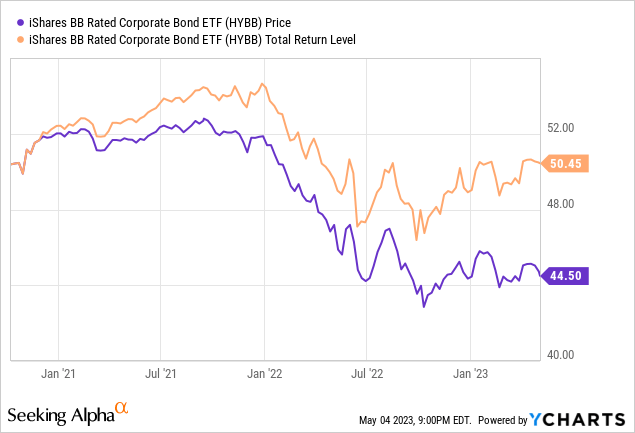
Seeking Alpha describes this ETF as:
The fund invests in fixed-rate, US dollar denominated, corporate bonds issued by industrials, utility and financial companies and with maturity to more than one year. It invests in high yield securities that are rated as between BB+ and BB- by S&P and Fitch and Ba1 and Ba3 by Moody's. The fund seeks to replicate the performance of the ICE BofAML BB US High Yield Constrained Index. HYBB just started in October, 2020.
Source: seekingalpha.com HYBB
HYBB has $239m in AUM and costs investors 25bps in fees. The TTM Yield is 5.9%.
Index review
ICE defines this index as:
ICE BofA US Corporate BB Index, a subset of the ICE BofA US High Yield Master II Index tracking the performance of US dollar denominated below investment grade rated corporate debt publicly issued in the US domestic market. This subset includes all securities with a given investment grade rating BB.
Source: indices.theice.com
They provided some tables with basic data included, of which I picked this one to show. As the name implies, all the bonds are rate BB.
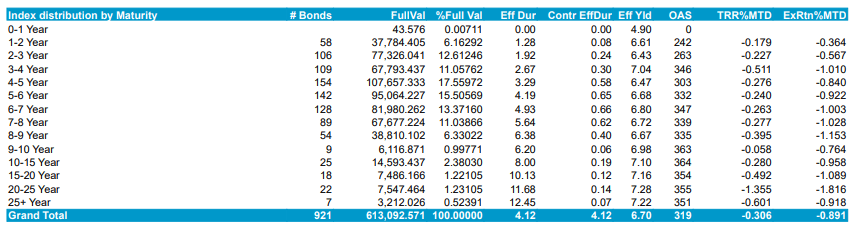
indices.theice.com
HYBB holdings review
iShares provides some basic portfolio characteristics.
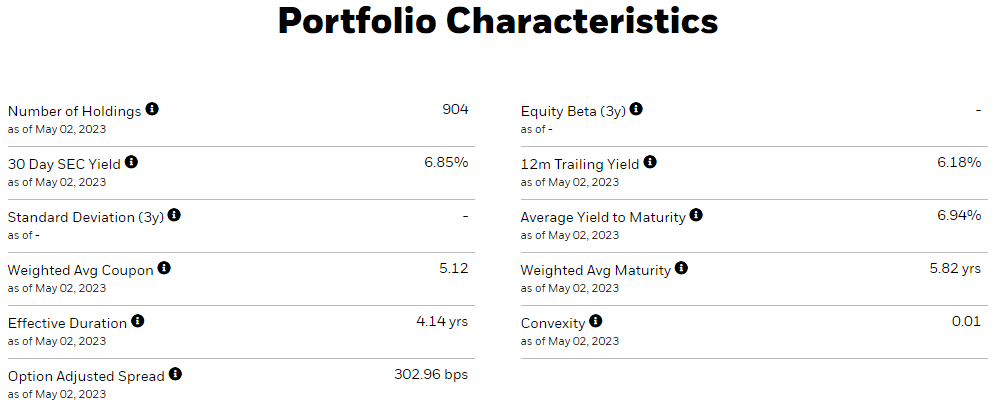
ishares.com
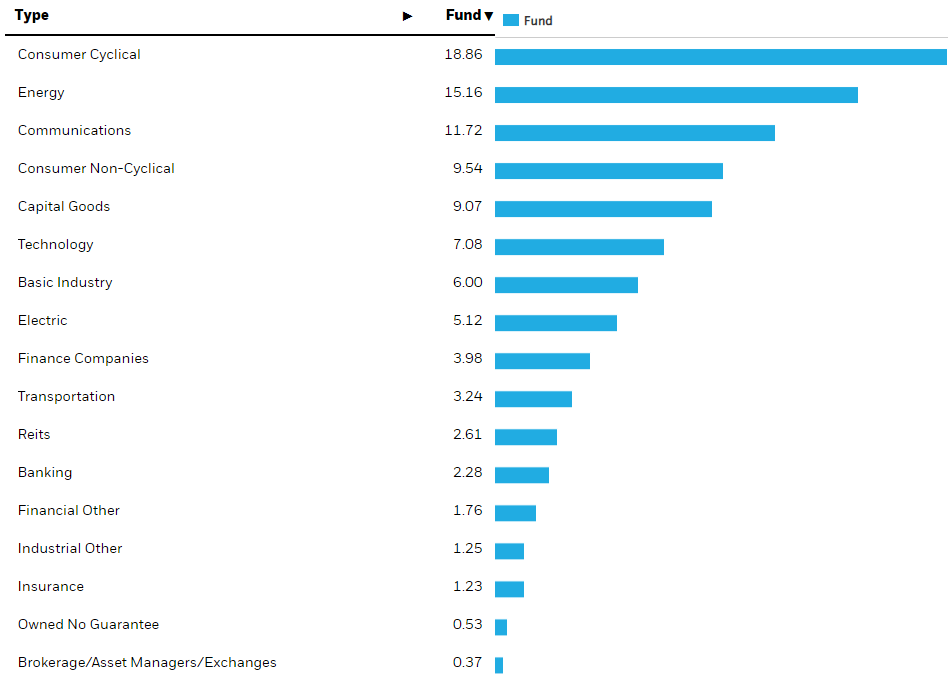
ishares.com HYBB sectors
While the Top 3 sectors comprise 45% of the exposure, there is a nice spread across the other sectors. In this time, the small allocation to banks is a plus.
I suspect the non-BB-rated bonds were such when issued, some are now better, some worse.
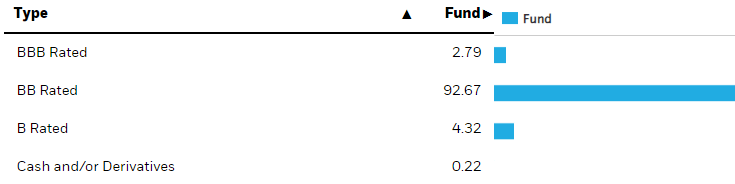
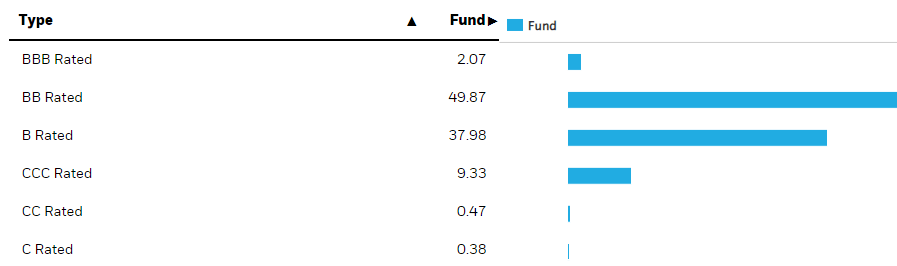
ishares.com HYBB ratings
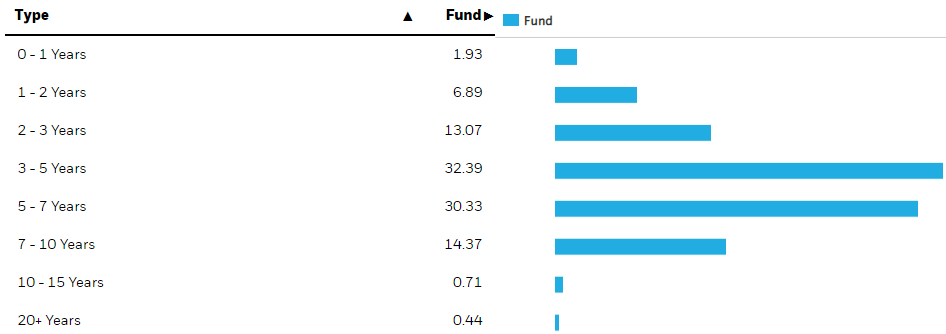
Over 50% of the holdings mature with the 3-7 year window, with the portfolio's WAM at 5.82 years.
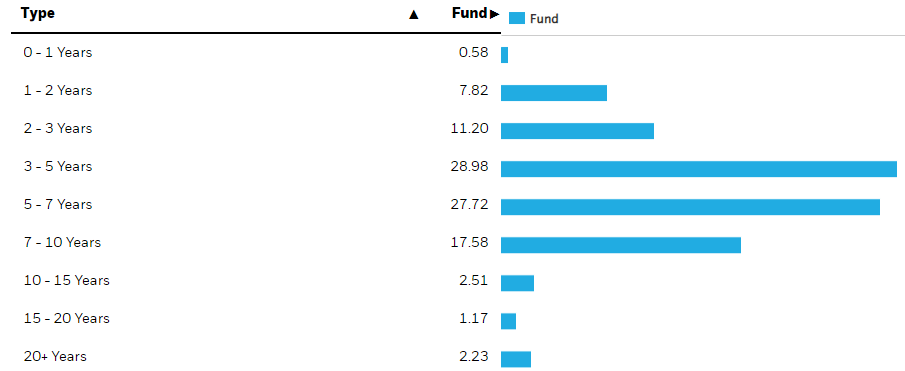
ishares.com HYBB maturities
Before 2025, 3.55% of the portfolio matures. These bonds carry a WAC of 5.16%.
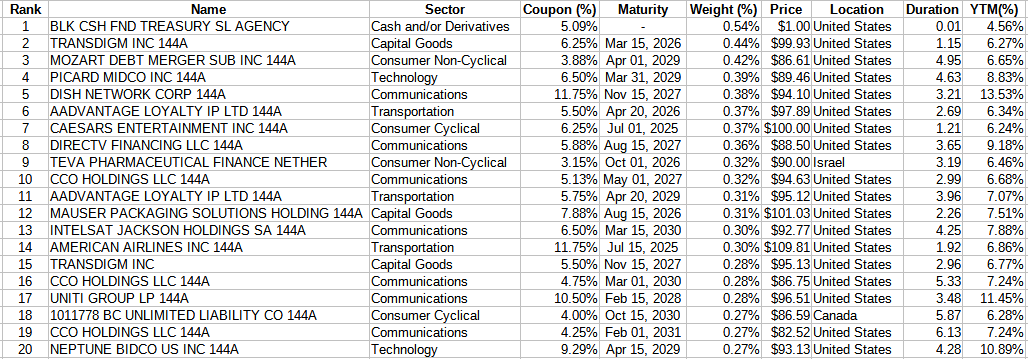
Top 20 holdings
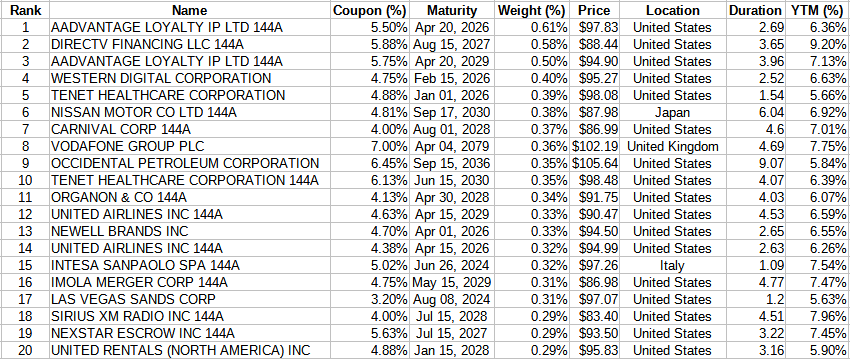
ishatres.com HYBB holdings; compiled by Author
With over 900 holdings, these bonds are only 7.4% of the portfolio. The bottom half come to a respectful 30% of the portfolio's weight. All bonds are dominated in the USD, so there is no currency risk.
HYBB distribution review
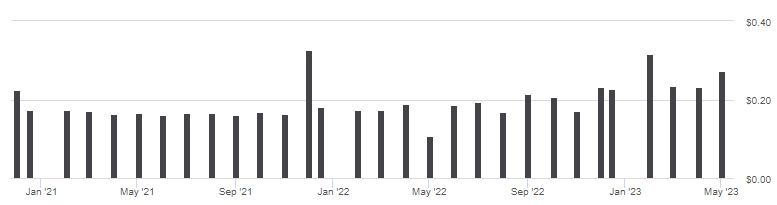
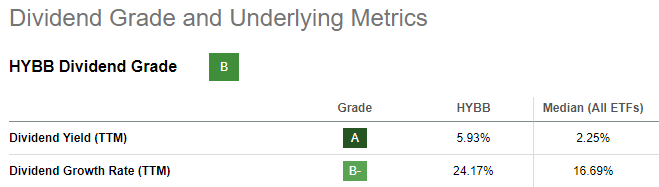
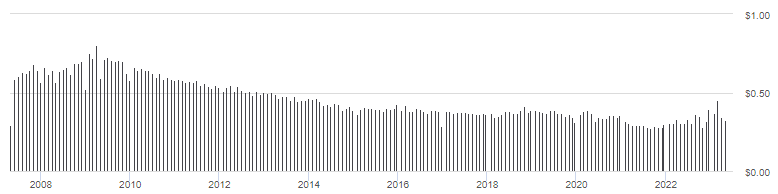
seekingalpha.com HYBB DVDs
While recent payouts are up, the change is not consistent. Even with its limited history, Seeking Alpha gives this a "B" grade.
seekingalpha.com HYBB scorecard
iShares iBoxx $ High Yield Corporate Bond ETF review
Seeking Alpha describes this ETF as:
The fund invests in fixed income markets of global developed region. It invests in U.S. dollar-denominated high yield corporate bonds with a maturity of at least one year and less than 15 years and a sub-investment grade rating from Fitch, Moody's or S&P. The fund seeks to track the performance of the Markit iBoxx USD Liquid High Yield Index. HYG started in 2007.
Source: seekingalpha.com HYG
HYG has $15.2b in AUM and comes with a much higher fee: 48bps. The TTM Yield is 5.5%.
Index review
The index manager provides this description of their index.
The Markit iBoxx USD Liquid High Yield Index consists of liquid USD high yield bonds, selected to provide a balanced representation of the USD high yield corporate bond universe. The indices are an integral part of the global Markit iBoxx index families, which provide the marketplace with accurate and objective indices by which to assess the performance of bond markets and investments. The index is market-value weighted with an issuer cap of 3%.
Source: cdn.ihsmarkit.com
For more details on the index rules, readers can use this link.
HYG holdings review
Here, iShares provides this data points.
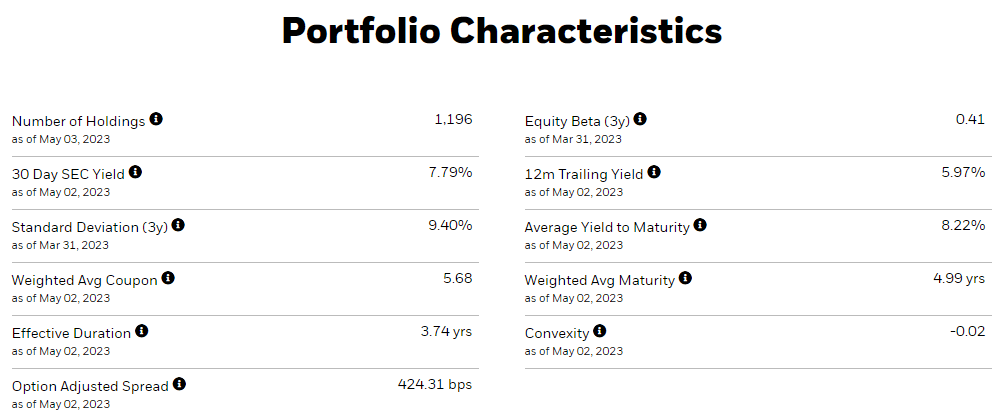
ishares.com
Most of these characteristics are higher for HYG than HYBB.
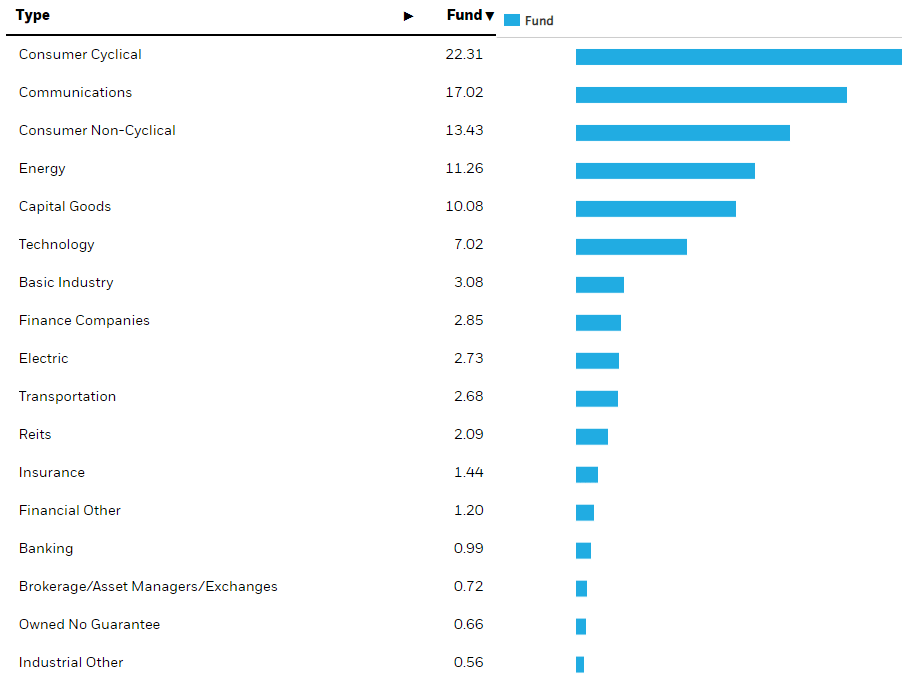
ishares.com HYG sectors
While the top sectors parallels HYBB, HYG has over 50% in the top 3 sectors, and five with weights over 10%. Without the BB-rated mandate, HYG has a large allocation below that one.
ishares.com ratings
This helps account for HYG having a higher yield and portfolio WAC. HYG shows a similar maturity schedule as does HYBB, with over 63% in the 3-7 year window.
ishares.com HYG maturities
For HYG, 3.1% of the portfolio matures before 2025, with a WAC of 5.63%.
Top 20 holdings
ishares.com HYG holdings; compiled by Author
Even with 1200 holdings, these holdings are over 7% of the portfolio. For HYG, the bottom half account for 71% of the portfolio; leveling the effect of each bond's impact to the ETF.
HYG distribution review
seekingalpha.com HYG DVDs
As expected, payouts move, with a delay, along with the change in interest rates, though not perfectly as recent payouts are actually down from 2022. HYG scores only a "C-" from Seeking Alpha on this ETF factor.
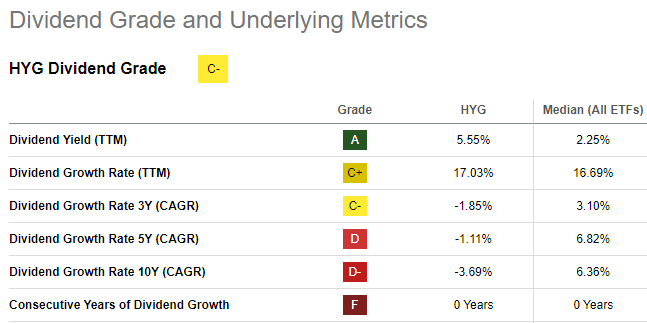
seekingalpha.com HYG scorecard
Comparing ETFs
Using various sites, I collected these fixed income data points on each ETF.
| Factor | HYBB | HYG |
| Effective Duration (yrs) | 2.05 | 3.74 |
| Effective Maturity (yrs) | 5.97 | 4.99 |
| Portfolio rating | BB | B- |
| Weighted Average Coupon | 5.18% | 5.72% |
| Average YTM | 6.94% | 8.22% |
| Weighted Average Price | $92.52 | $90.88 |
| Percent in BB rated | 93% | 57% |
| Percent in B rated | 5% | 39% |
The big difference is HYG's holds a much higher level in b-rated bonds than HYBB, which focuses on BB-rated bonds. With a longer duration, HYG should do better once interest rates start falling.
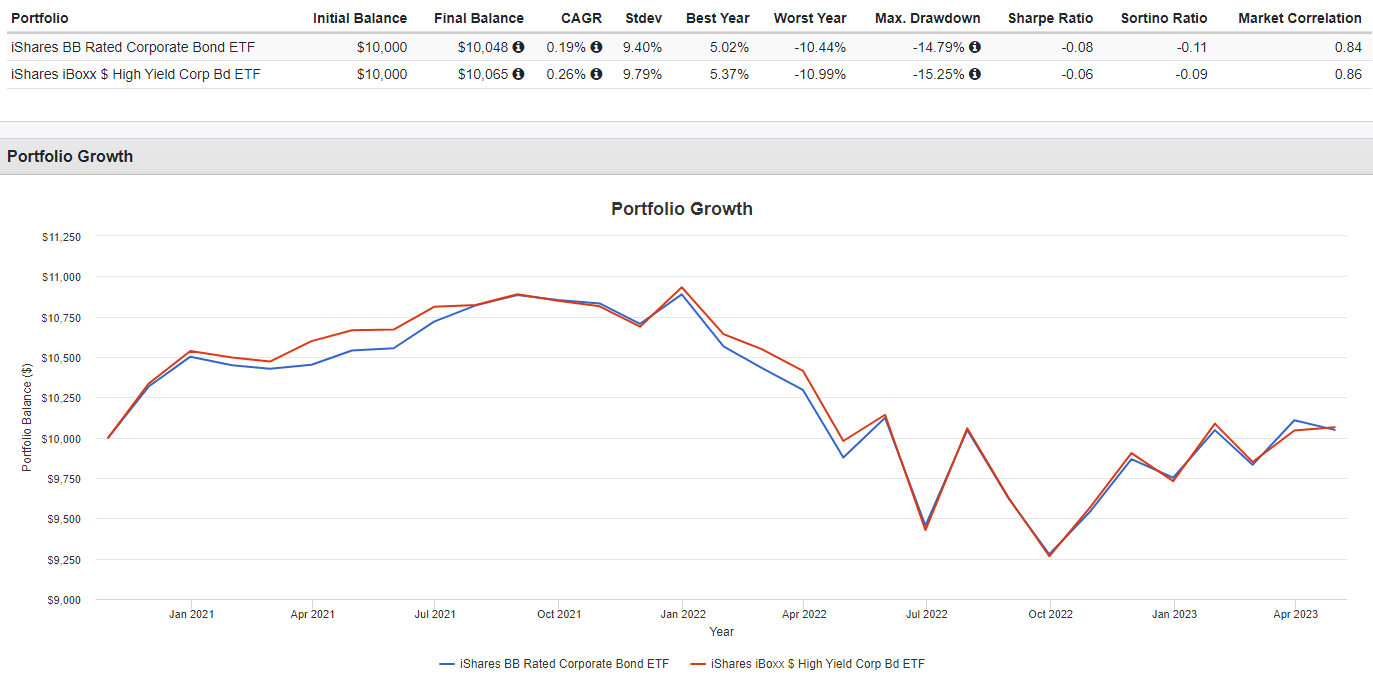
PortfolioVisualizer.com
None of the data provided by PortfolioVisualizer favors one ETF over the other. That goes for income provided to investors also, with each ETF providing the most in an equal number of years.
Portfolio strategy
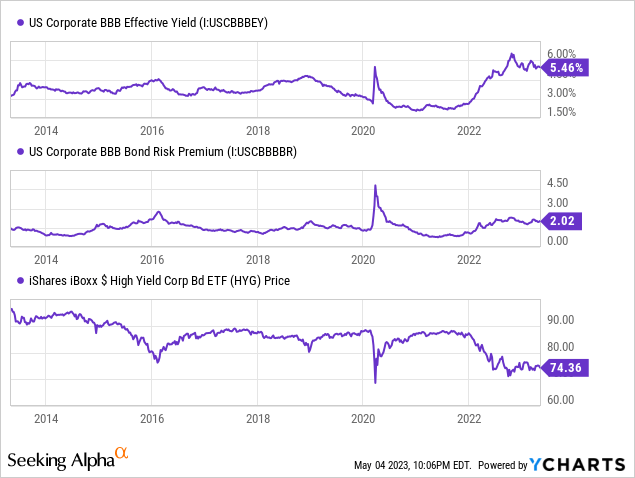
I didn't not find YCharts providing similar data for "junk bonds" but would expect the basic movements to be similar. BBB-rated bonds did best when both their rate and risk premium were dropping. While down from their recent peak, neither is near recent lows.
This recent WSJ article listed four reason High Yield bonds might be worth buying.
- Historical returns: Going back to 1987, the Bank of America US High Yield Index, which tracks a basket of junk bonds, has never suffered two consecutive years of negative returns. That includes the years of the global financial crisis of 2007 to 2009.
- Healthier borrowers: The companies issuing high-yield debt these days are in better shape financially than they have been in the past, according to analysts. That is partly because many wobbly borrowers have migrated away from issuing junk bonds to borrowing in the loan market.
- Underrated bonds: Many of the remaining borrowers in the junk-bond market are larger companies with robust balance sheets and decent financials. Yet their bonds continue to be labeled as being at a higher risk of default. That’s because credit-rating firms have become much more cautious about raising their ratings, due to some classification mistakes made in the past.
- Economy's direction: Many analysts believe the economy will slow or enter a mild recession later this year. If or when the economy slumps, two things will happen to change the price of bonds. First, yields on 5-year Treasuries will start falling and may hit 2% by mid-2024, down from 3.4% recently. However, the benefit of falling government rates will be partially offset by increases in junk credit spreads of approximately half a percentage point by the end of the year.
While this article reviewed one new and one seasoned High Yield ETF, here are some others that should included in any due diligence analysis of this part of the bond market. The next tables includes the two reviewed here plus eight others.
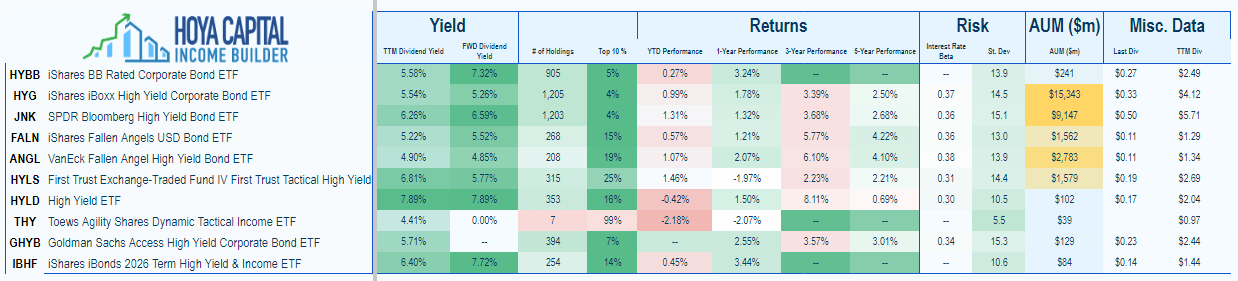
hoya-capital-income-builder
hoy
I ‘m proud to have asked to be one of the original Seeking Alpha Contributors to the 11/21 launch of the Hoya Capital Income Builder Market Place.
This is how HCIB sees its place in the investment universe:
Whether your focus is high yield or dividend growth, we’ve got you covered with high-quality, actionable investment research and an all-encompassing suite of tools and models to help build portfolios that fit your unique investment objectives. Subscribers receive complete access to our investment research - including reports that are never published elsewhere - across our areas of expertise including Equity REITs, Mortgage REITs, Homebuilders, ETFs, Closed-End-Funds, and Preferreds.
This article was written by

I have both a BS and MBA in Finance. I have been individual investor since the early 1980s and have a seven-figure portfolio. I was a data analyst for a pension manager for thirty years until I retired July of 2019. My initial articles related to my experience in prepping for and being in retirement. Now I will comment on our holdings in our various accounts. Most holdings are in CEFs, ETFs, some BDCs and a few REITs. I write Put options for income generation. Contributing author for Hoya Capital Income Builder.
Analyst’s Disclosure: I/we have no stock, option or similar derivative position in any of the companies mentioned, and no plans to initiate any such positions within the next 72 hours. I wrote this article myself, and it expresses my own opinions. I am not receiving compensation for it (other than from Seeking Alpha). I have no business relationship with any company whose stock is mentioned in this article.
Seeking Alpha's Disclosure: Past performance is no guarantee of future results. No recommendation or advice is being given as to whether any investment is suitable for a particular investor. Any views or opinions expressed above may not reflect those of Seeking Alpha as a whole. Seeking Alpha is not a licensed securities dealer, broker or US investment adviser or investment bank. Our analysts are third party authors that include both professional investors and individual investors who may not be licensed or certified by any institute or regulatory body.