BND: Bonds Are A Strong Buy Relative To Stocks

Summary
- The close correlation between US bonds and stocks seen over the past 18 months is increasingly likely to break down in favor of bonds.
- The current yield to maturity on the Vanguard Total Bond Market Index is 4.3%, above the free cash flow yield on the S&P500.
- Current macroeconomic conditions are similar to those seen in 2008, which saw the BND rise 7% and the S&P500 fall 35%.
Andres Victorero
Over the past 18 months US stocks and bonds have been extremely closely correlated as monetary policy considerations have dominated market sentiment. However, with the Fed's hiking cycle coming to an end and deflationary pressures building, this close correlation between bonds and stocks is increasingly likely to break down, with bonds rising and stocks falling. The Vanguard Total Bond Market Index Fund ETF (NASDAQ:BND) offers exposure to a mixture of US bonds, with a high weighting of Treasuries, industrial, and securitized bonds. I last wrote about the BND on March 28 (see 'BND: Higher Yield And Lower Volatility Than U.S. Treasuries'), and while the ETF has risen since then, the relative value opportunity versus US stocks has further improved as inflation expectations and S&P500 earnings have weakened.
BND ETF Vs S&P500 (Bloomberg)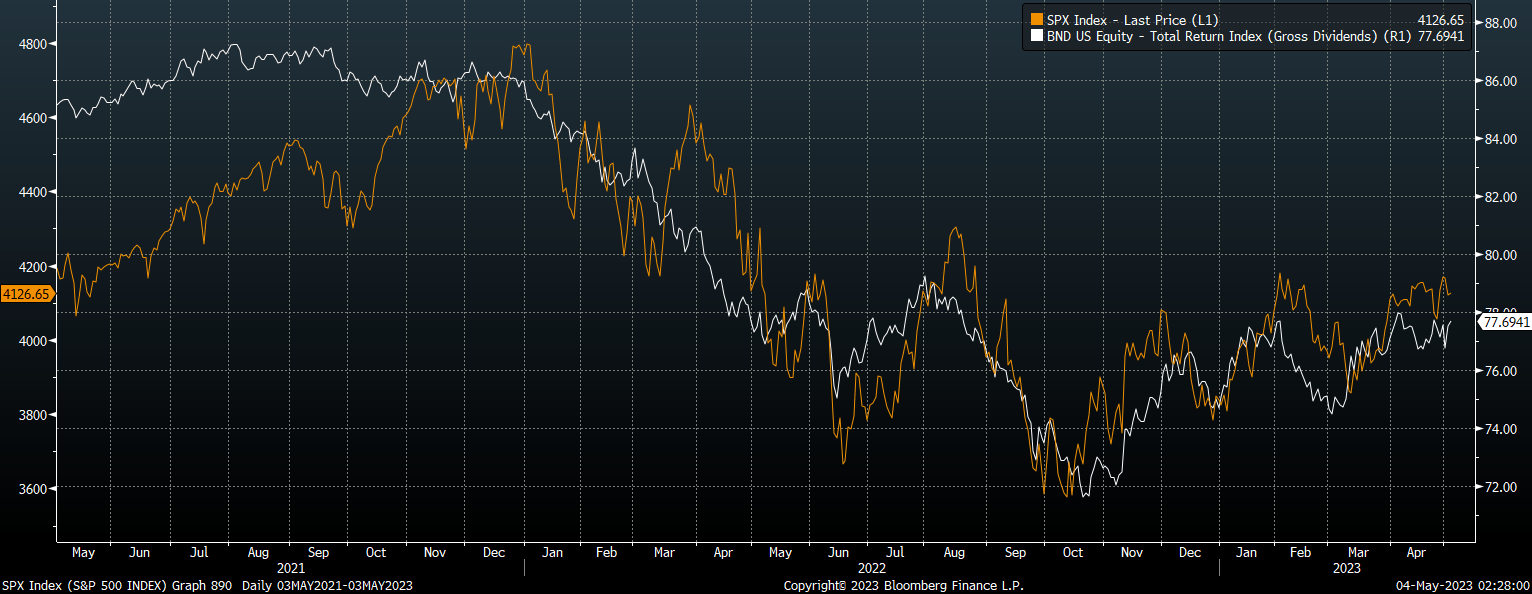
The BND ETF
Vanguard Total Bond Market ETF tracks the Bloomberg Aggregate Float-Adjusted Bond Index. As I argued in my previous article, the BND has a history of being less volatile than similar maturity US Treasuries as the exposure to credit risk limits losses during economic booms and limits gains during recessions. The substantial exposure to securitized and industrial bonds means that relative to Treasuries, the BND has been much more closely correlated with US stocks. The BND has an effective maturity of 8.9 years and a duration of 6.6 years. The current yield to maturity is 4.3%, 96bps above equivalent maturity US Treasuries.
BND Yield Is Increasingly Attractive Vs S&P500
Since my last article on the BND in March the ETF has risen by around 2% as Treasury yields and credit spreads have both fallen. However, the opportunity to shift out of stocks into the BND is even more attractive now. Over the past 6 weeks, the free cash flow yield has fallen further due to rising stock prices and falling free cash flows, while the real yield on the BND has risen due to falling inflation expectations. This is expressed in the chart below, which shows the yield on the BND adjusted for inflation expectations relative to the S&P500 free cash flow yield.
Inflation-Adjusted BND Vs Free Cash Flow Yield on S&P500 (Bloomberg)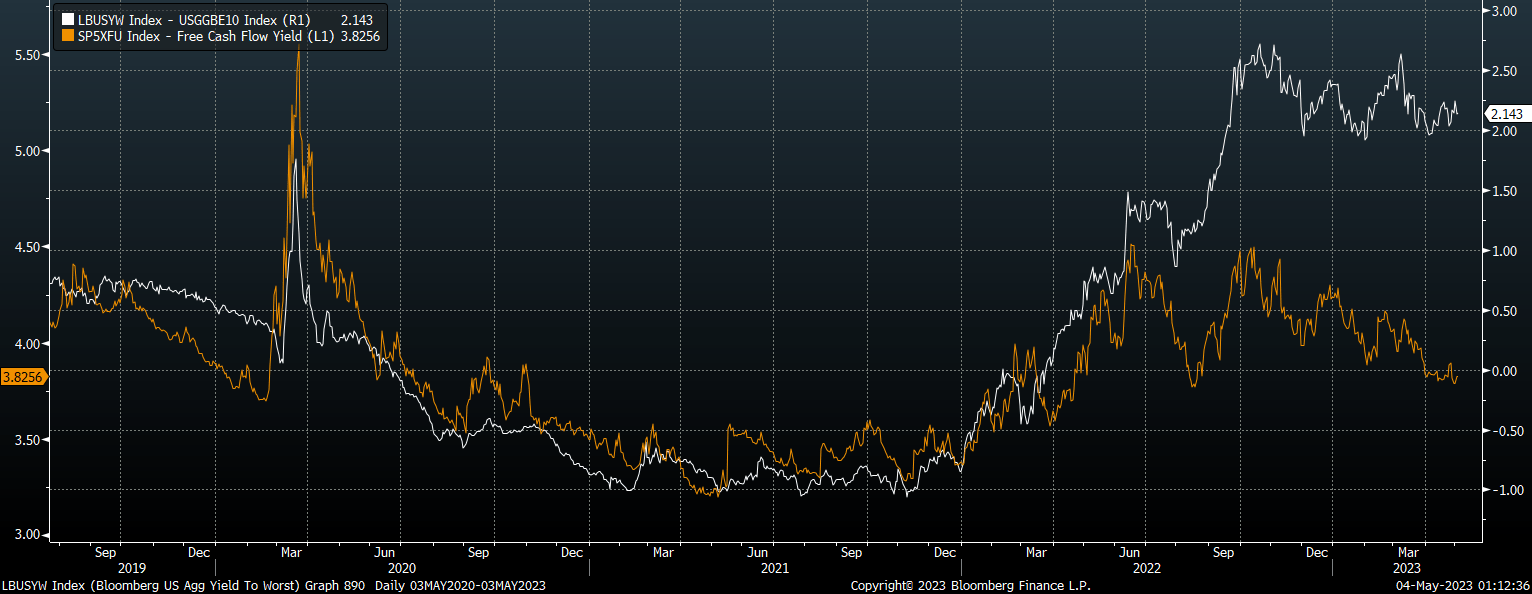
The reason I have adjusted bond yields for inflation expectations is because unlike stocks, cash flows do not rise and fall in line with inflation, which makes it a fairer comparison between the two. The gap between the two yields has continued to narrow and now sits at just 1.7%, which is fully 2pp below its 20-year average. If we were to see this correlation reestablish itself with real yields on the BND fall back down to the level implied by the S&P500 free cash flow yield, this would require a 2.2pp decline in the BND's yield. At the current duration, this would result in a gain of around 15% for the ETF. If the correlation was reestablished via a rise in the S&P500 free cash flow yield, this would require a similar size decline in stock prices.
Echoes Of 2008
Stocks tend to generate higher long-term returns than bonds is that they are more risky, and in particular their income inflows decline during periods of recession, which is when it is least appreciated. This higher risk partly explains why the S&P500 has outperformed the US Aggregate Bond Index by 4.5% annually since 1990.
However, despite this outperformance we have seen two periods where stocks lost over 50% relative to the bond index. These two periods were preceded by a period of rapid monetary tightening aimed at cooling inflation and equity prices in response to prior extremely lose policy. As it became clear that the economy was entering recession, investors suddenly required much higher yields on stocks and were willing to accept much lower returns on bonds as the focus shifted from maximizing returns to minimizing losses.
US Aggregate Bond Index vs S&P500 (Bloomberg)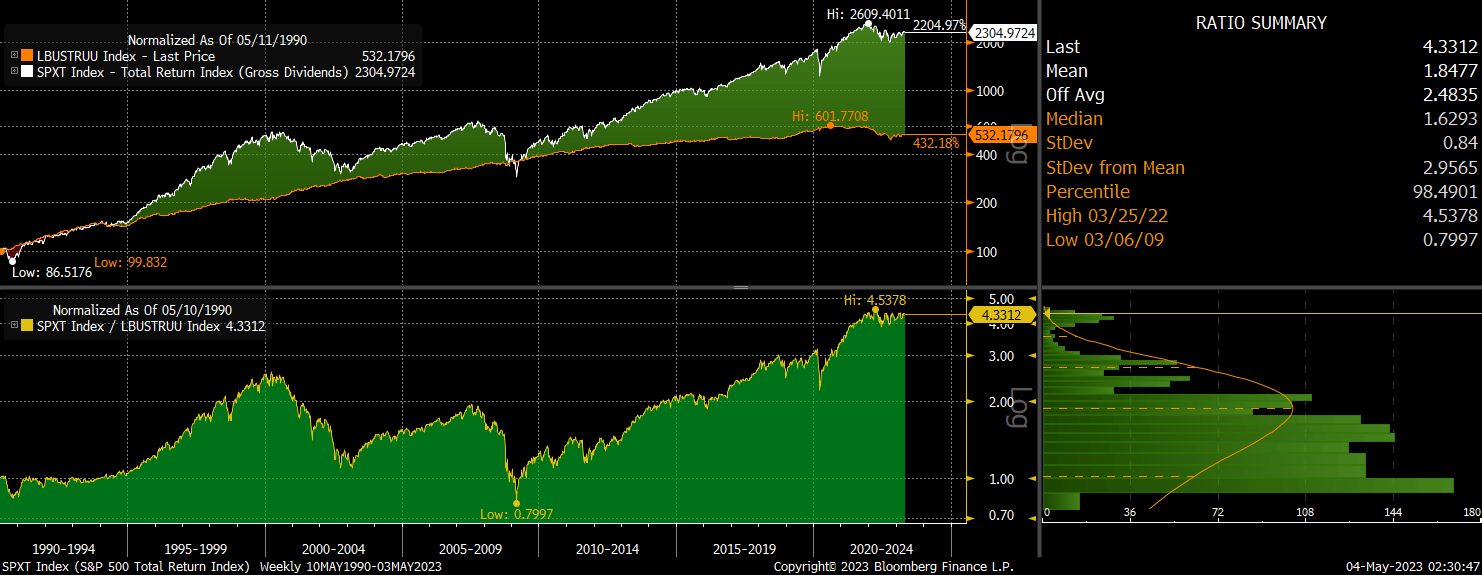
This time around, the deflationary and recessionary forces are even more pronounced. M2 money supply growth is contracting at a record pace, while the Conference Board's Leading Indicator Index is in freefall. It is just a matter of time, in my view, before we see investors jump out of stocks and into bonds in anticipation of a deflationary recession. 2008 may be a good template for the next 12 months. At the start of 2008, the S&P500's free cash flow yield was similar to where it is today, as was the real yield on the BND. Over the next 12 months, the BND rose 7% while the S&P500 fell 35%.
A Reversal In Inflation Expectations Is The Main Risk
The main risk comes from a rapid reversal in inflation expectations, which would put upside pressure on bond yields and downward pressure on equity yields, resulting in BND underperformance relative to the S&P500. At present, 10-year breakeven inflation expectations, as measured by the yield difference between regular and inflation-linked bonds, sit at just 2.1%. This is that any Fed easing may cause investors to anticipate another flood of liquidity, breathing fresh life into the equity bubble and driving up inflation expectations. However, the 4.3% yield on the BND gives investors a large margin for error. Furthermore, the higher the yield on bonds rises, the more pressure that this would put on equity valuations.
This article was written by

Analyst’s Disclosure: I/we have a beneficial long position in the shares of BND either through stock ownership, options, or other derivatives. I wrote this article myself, and it expresses my own opinions. I am not receiving compensation for it (other than from Seeking Alpha). I have no business relationship with any company whose stock is mentioned in this article.
Seeking Alpha's Disclosure: Past performance is no guarantee of future results. No recommendation or advice is being given as to whether any investment is suitable for a particular investor. Any views or opinions expressed above may not reflect those of Seeking Alpha as a whole. Seeking Alpha is not a licensed securities dealer, broker or US investment adviser or investment bank. Our analysts are third party authors that include both professional investors and individual investors who may not be licensed or certified by any institute or regulatory body.