Southwestern Energy: Undervalued Natural Gas Company

Summary
- Southwestern Energy has gas-producing acreage in both the fast-growing Haynesville Shale and low-cost Marcellus Shale of Appalachia.
- In addition to natural gas, 13% of SWN's production consists of oil and natural gas liquids (NGLs), boosting price realizations for production.
- SWN has hedged more than 60% of its planned 2023 output at higher prices, protecting near-term cash flows from low natural gas prices.
- With an estimated breakeven cost of $2.84/Mcfe in 2023, the company won't generate much free cash flow this year, but should be able to spend within cash flow.
- I derive a discounted cash flow target of just under $9 per share for SWN based on conservative production assumptions and higher prices factored into the gas futures curve.
Joey Ingelhart
Last week, I wrote a bearish piece on natural gas producer Comstock Resources (CRK).
My analysis was based on a simple model of CRK’s free cash flow generation potential given current natural gas calendar strip pricing, management’s guidance on capital spending and hedges the company has to protect cash flow from current low natural gas prices.
My conclusion was with a breakeven cost around $3.19/Mcf in 2023 and limited hedging for the year, CRK will struggle to generate positive free cash flow even if it were to further reduce planned CAPEX this year.
Southwestern Energy (NYSE:SWN) is a larger gas-focused producer that differs from CRK in two major respects. First, the company is not a pure play on the Haynesville Shale, but a balanced producer with operations in the Marcellus Shale of Appalachia and the Haynesville.
The advantage of production basin diversification for SWN is that it combines the lower breakeven costs and higher liquids content – natural gas liquids (NGLs) and oil – of the Marcellus with the production growth potential and proximity to Gulf coast liquefied natural gas “LNG” export facilities offered by the Haynesville. This gives SWN the option of adjusting its capital spending (capex) and production growth plans to reflect the realities of commodity markets.
The second advantage SWN has over a producer like CRK is superior hedge coverage for 2023, better protecting cash flows against near-term weakness in US natural gas prices.
Southwestern’s Breakeven Costs
Let’s start by examining Southwestern’s breakeven costs and the realized pricing environment in 2022 (last year):
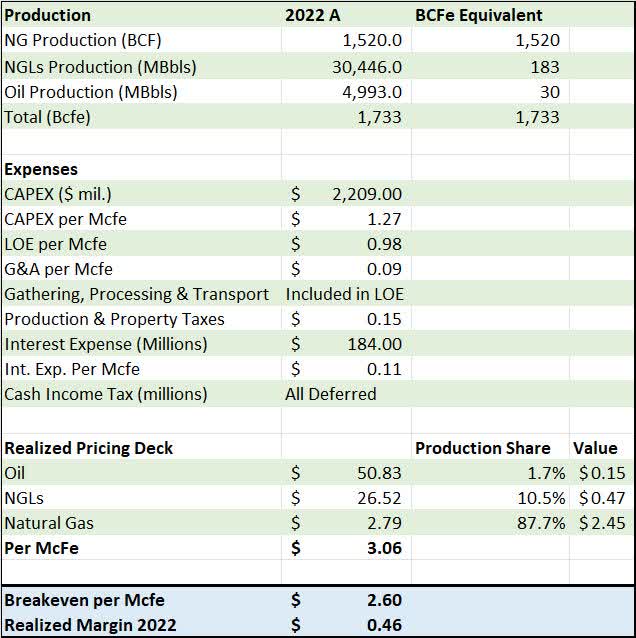
SWN 2022 Cash Flow Breakeven (SWN Q4 2022 Earnings Release)
Source: SWN Q4 2022 Earnings Release
This is a simplified version of SWN’s results in 2022. As you can see, the company is primarily a natural gas producer with total output of 1.52 trillion cubic feet of natural gas last year.
However, the company also produces significant quantities of crude oil (almost 5 million bbl in 2022) and natural gas liquids like ethane, propane and butane (almost 30.5 million bbl last year). The Haynesville Shale is primarily a dry gas play, meaning the field consists mainly of methane and impurities like carbon dioxide with very little oil and NGL content.
For the full year, SWN’s Haynesville operations only produced 20,000 barrels of oil and no NGLs.
SWN does, however, have significant acreage and production from the liquids-rich, wet gas portions of the Marcellus Shale in Appalachia; this accounts for virtually all of the oil and NGLs production SWN reported in 2022.
You can see how this benefited SWN last year. The realized pricing deck on my table shows the actual prices SWN received including the impact of hedges on output (more on that issue in a moment). As you can see, their all-in realized price of gas last year was just $2.79/mcf; adding in the 12.2% of total output on a Bcf-equivalent basis from NGLs and oil increased the realized price received by almost 10% to $3.06/mcfe.
The expenses section of my table includes 2022 capital spending over $2.2 billion and most of that represents drilling and completion (mainly the cost of fracturing) of wells. In addition, SWN includes a portion of its annual interest and other expenses in that CAPEX figure. I’ve included interest above and beyond the amount included in CAPEX in the table as a separate item.
On a dollars per thousand cubic feet equivalent ($/Mcfe) basis CAPEX works out to $1.27/Mcfe.
Here’s what’s interesting about CAPEX:
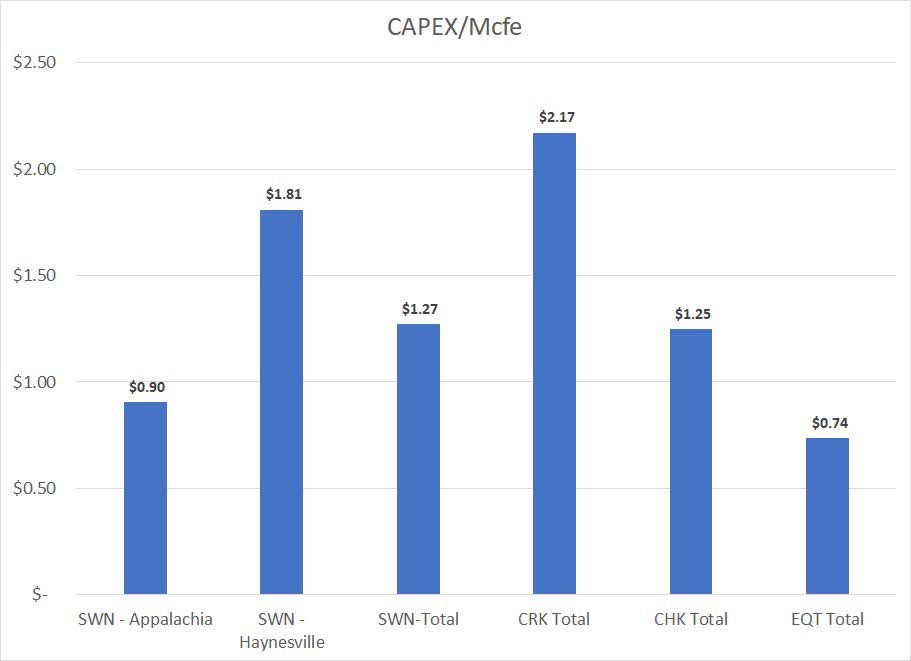
CAPEX costs for US shale producers (Q4 earnings results for SWN, Chesapeake Energy, Comstock and EQT)
Southwestern breaks down its capital spending and production by region, so we can tease out the relative cost in the Haynesville and Appalachian/Marcellus areas. Note, this is only the CAPEX portion of the breakeven cost I outlined in my table above.
I’ve also included similar metrics for Comstock (CRK), as well as Chesapeake Energy (CHK) and EQT (EQT). Comstock is a pure play on Haynesville, Chesapeake produces from both the Haynesville and Marcellus (like SWN) and EQT is a pure play on Appalachia.
Appalachia is the lowest cost source of natural gas in the US with EQT known for having some of the lowest overall costs of any producer in the US with a CAPEX cost last year of just $0.74/Mcfe. And, you can see the CAPEX per Mcfe for SWN in the region is just $0.90/Mcfe.
The Haynesville shale requires more CAPEX, which is reflected in the more elevated cost metrics for pure-play Haynesville producer Comstock as well as SWN’s own acreage in the region at $1.81/Mcfe.
Producers with exposure to both basins – SWN and CHK – have all-in CAPEX costs somewhere between Marcellus and Haynesville with CHK at $1.25/Mcfe and SWN at $1.27/Mcfe.
Moving down the table, SWN reports lease operating expenses (LOE) to include gathering, processing, treating and transportation costs, so all-in LOE per Mcfe in 2022 is at $0.98. Production taxes are ad valorem taxes paid based on revenue generated from producing gas, oil and NGLs from wells while the interest expense per Mcfe line represents the portion of interest on debt that SWN doesn’t include in CAPEX.
Add up all these line items and we get an all-in breakeven cost per Mcfe last year of just $2.60/Mcfe.
This simple cost model can give us an idea of what level of cash flow SWN can generate at any given commodity price; for example, the company’s reported all-in realized price per Mcfe last year was $3.06/Mcfe which yielded a margin of $0.46/Mcfe on production.
If we then multiple that $0.46 by total production we come up with free cash flow in the region of $800 million for 2022, which is close to the $848 million SWN reported when it released its full-year 2022 results back on February 23rd with the difference relating partly to the way SWN treats interest in reported free cash flow.
SWN's 2023 Outlook
Let’s step this analysis forward and have a look at the prospects for 2023. The company reported Q1 2023 results and published its latest outlook in late April.
First quarter results were a bit better than the company’s guidance offered back in February with production at 411 Bcfe compared to the midpoint of the company’s Q1 2023 guidance of 404 Bcfe. Even more important, the company had guided for total liquids production at 13.5% of its overall Q1 2023 Bcfe output; actual liquids production of 8.24 million barrels of NGLs and almost 1.42 million barrels of oil equated to almost 14.1% of production.
The reason SWN’s liquids production surprised to the upside in Q1 is because the company has shifted some of its budget in favor of drilling in liquids-rich regions of Appalachia:
As CEO Bill Way noted in their Q1 2023 Conference Call:
As we shared in our guidance in February, we adjusted activity in response to lower near-term natural gas prices by removing capital from our program and increasing our level of liquids-rich development this year. Guided by our disciplined capital allocation strategy and our priority of funding development within cash flow, we continue to moderate our planned activity. These prudent adjustments are primarily focused on decreasing dry gas completion activity including releasing a frac fleet in Haynesville, while maintaining our higher liquids-rich activity level in West Virginia and Ohio.
Source: Southwestern Energy Q1 2023 Conference Call
Last year, the average realized price of gas for SWN before hedges was $5.98/Mcf and in Q1 2023 it plummeted to just $3.22, a decline of more than 46%. Oil and NGLs prices held up far better – the average realized price of crude oil in Q1 2023 before hedges was down just 12.4% to $76.13/bbl and the average realized price of NGLs was at $24.39 down 29%.
By cutting overall CAPEX and directing more towards its most profitable, liquids-rich acreage, SWN was able to offset some of the plunge in near-term natural gas prices and preserve about $99 billion in free cash flow in Q1 alone.
Note the commodity prices I just quoted differ from those listed in my table above because these exclude hedges while I use prices including hedges in my basic cash flow model tables.
Here’s my breakeven outlook for SWN based on the midpoint of the company’s latest guidance – updated as of April 27th – for full-year 2023:
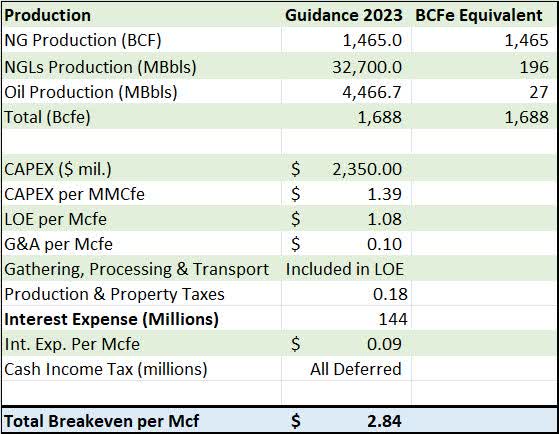
SWN 2023 Cash Flow Breakeven (SWN 2023 Guidance )
The bottom line: Based on guidance and estimates using the same methodology I outlined above, SWN’s cash costs will increase about 9.2% from $2.60/Mcfe in 2022 to $2.84/Mcfe in 2023.
This increase is nothing at all unusual or specific to SWN. The cost of most goods and services related to drilling, completing and maintaining wells has increased over the past year, so producers across the board need to increase CAPEX just to drill and complete the same number of wells as in 2022.
However, what this means is that in order to generate free cash flow this year, SWN will need all-in prices – the price of natural gas plus the price realizations for oil and NGLs volumes -- to exceed roughly $2.84/Mcfe.
At first blush, with June 2023 natural gas futures trading around $2.19/MMBtu (by convention equals $2.19/Mcf), it might seem SWN is headed for a big 2023 outspend. However, dig a bit deeper and the picture looks healthier with plenty of upside for 2024 and over the longer haul.
Let’s lay it out in this table:
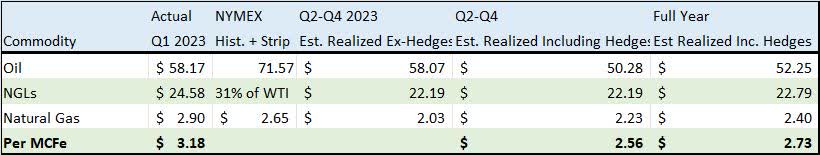
Realized commodity pricing for SWN in 2023 (SWN Q1 2023 Results and Guidance)
In this table, I’ve listed actual price realizations including hedges for Q1 2023 and, on a per Mcfe basis, the company’s realized price was $3.18/Mcfe, well above that breakeven level. That explains the company’s $99 billion in free cash flow for Q1.
As I said, the main driver of the company’s Q1 earnings and cash flow beat was higher-than-expected production and higher-than-expected liquids production. Indeed, SWN’s hedges actually cost the company money in Q1 since its realized cost for oil before hedges was $65.92 and after hedges was just $58.17/bbl. For gas, it was $3.48/Mcf before and $3.18/Mcf after hedges.
However, if you look at the next columns on my table it lays out the outlook for the three remaining unreported quarters thus far (Q2 – Q4 2023).
To calculate the Henry Hub natural gas benchmark price for Q2 -Q4, I simply use the actual average price of natural gas quarter-to-date as well as the futures price of gas for delivery from June 2023 (current front-month futures) though December 2023. This is the calendar futures strip and it’s sitting at a little over $2.65 by my calculations.
Historically, because of where SWN produces gas, it receives a price lower than the Henry Hub benchmark (the delivery point for NYMEX natural gas futures) and for 2023 it’s expecting about $0.625/Mcf below NYMEX.
However, we also must factor in the impact of the company’s hedge book. For natural gas, SWN has hedged 528 bcf of production in the final 9 months of this year using swaps at a price of $3.15/Mcf, 116 bcf of gas production using 2-way collars with a floor price of $2.86/Mcf and 145 bcf of gas production using 3-way collars at $2.49Mcf.
Since SWN is guiding for 1,465 bcf in total gas production this year, and it produced 353 bcf in Q1 2023, that means it has roughly 1,112 bcf of production expected attributable to Q2-Q4 2023. Accordingly, almost 71% of remaining 2023 production is hedged at prices well above the current quote.
I did the same basic calculations for crude oil using West Texas Intermediate oil prices. The company guides to realizing a price for a barrel of mixed NGLs – propane, butane, ethane and other hydrocarbons – worth about 31% of a barrel of WTI, so I made those projections based on the WTI strip.
The per Mcf equivalent price realizations are based on management’s guidance for 13 percent of total production to be liquids this year (oil and NGLs), and using the standard 1 barrel of oil = 6 Mcfe of gas energy conversion convention.
When I add up all these estimates for Q2-Q4 with the actual data from Q1, I get an expected realized price per Mcfe at roughly $2.73. That’s a bit below the breakeven of $2.84/Mcfe implying only modest cash burn for 2023 as a whole.
However, I believe that’s overly pessimistic for three reasons.
First, in Q1 2023 SWN handily exceeded both production and liquids content guidance; yet, management didn’t adjust their full-year guidance accordingly. I suspect that reflects a desire to under promise and over-deliver. Should SWN continue to produce oil and NGLs at a higher-than-expected level that would boost price realizations since $50/bbl oil works out to a $8.33/Mcfe realized price on a gas-equivalent basis.
Second, management’s guidance for price realization discounts to NYMEX gas benchmarks includes costs associated with transporting gas to market. The cost of transporting gas from Appalachia, for example, to the Gulf Coast where NYMEX is priced (Henry Hub, Louisiana) is significant. However, the company also includes expected transportation costs in cost guidance I used to calculate the breakeven. So, it appears there may be some meaningful double counting of costs in this table.
Third, management didn’t break down its hedges by quarter for the balance of 2023 so I’m just calculating the realized price with hedges in aggregate. However, timing makes a difference to realizations since the price of gas futures for June delivery is around $2.20 and for December it’s $3.55. The higher the hedge coverage over the next 2 quarters, when gas futures prices are lowest, the more that would boost realizations for the balance of this year.
These are all rough estimates of cash generation potential for SWN, but I’m looking for the company to spend within its cash flow in 2023, perhaps even producing modest positive free cash flow if the company continues to execute well and/or commodity prices recover from recent lows into year-end.
While spending barely within cash flow is hardly an accomplishment over the long-haul, it’s impressive that SWN can cope with current depressed natural gas prices.
Looking Beyond the 2023 Valley
The bigger story isn’t cash SWN can generate this year, but the potential for significant cumulative free cash flow in coming years, driven by a recovery in natural gas prices.
Take a look:
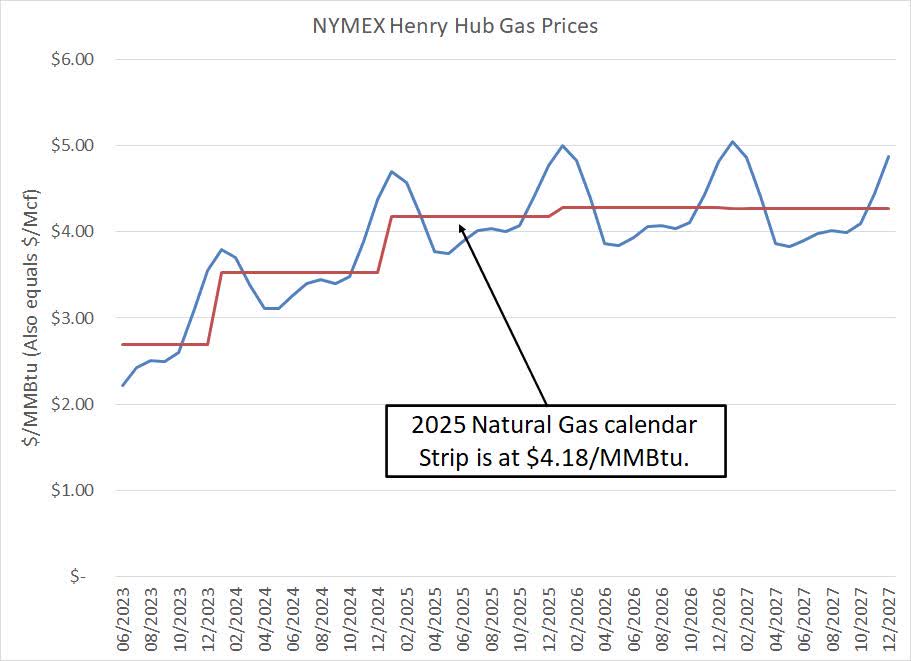
NYMEX natural gas curve through 2027 (Bloomberg)
Source: Bloomberg
The blue line equals the current trading price for every monthly NYMX futures contract for delivery from June 2023 through December 2027. The red line shows the annual average (annual calendar strip price) for gas in each of these years. The 2023 line represents the strip for the final 6 months (June through December 2023 futures) of this year.
As you can see, US natural gas prices are currently depressed, largely due to a warmer-than-average winter in 2022/23 and a fire last summer at the Freeport liquefied natural gas “LNG” export facility in Texas, which led to the loss of approximately 2 billion cubic feet per day of US LNG exports from June 2022 through to March of this year.
However, the futures curve shows much higher prices into the end of this year and a ramp higher in gas prices through 2026. Indeed, the calendar strip price on my chart is $2.70/MMBtu from June to December 2023, $3.53/MMBtu for 2024 and $4.18/MMBtu in 2025.
And for SWN these aren’t just estimates – the futures price for delivery in 2024, for example, gives you a good idea of the price at which SWN could hedge volumes of gas it expects to produce.
During its Q1 2023 earnings update, the company indicated it already has layered in natural gas hedges for 2024 production as well, locking in some 528 bcf of 2024 production at $3.54/Mcf using fixed price swaps alone. If SWN produces the same amount of gas in 2024 as it’s expected to this year, the company already has hedges covering almost 40% of 2024 output at prices some $1.30/Mcf above the current quote.
And towards the end of 2024 and into early 2025, the US natural gas market is likely to enjoy a significant boost from new LNG export capacity due to come online over the next three years including the 2.4 bcf/day Golden Pass LNG terminal in Texas, the 1.8 bcf/day Plaquemines facility in Louisiana and an expansion of the Corpus Christi plant in Texas adding 1.6 bcf day. Total US LNG export capacity should increase from around 14 bcf/day at year end 2023 to 20 bcf/day by 2025.
This is particularly good news for Haynesville producers like SWN because the Haynesville Shale is in Louisiana and east Texas, close to virtually all US LNG export terminals located on the Gulf Coast. Already, SWN sells some 1.5 bcf/day of its gas production to LNG exporters, equivalent to around 38% of its expected 2023 gas production.
Given these higher futures prices, it’s not hard to ascertain SWN’s potential for free cash flow generation in coming years. Based on the cost estimates I’ve outlined for 2023, for example, a realized all-in price per Mcfe of $3.25 would translate to around $700 million in annual free cash flow and at $3.75/MMBtu it’s $1.5 billion/year.
According to Bloomberg, the current consensus on Wall Street is for $721 million in free cash flow in 2024 and almost $1.1 billion in 2025; both look achievable – even conservative -- based on the cost parameters and futures pricing curve I just examined.
Target and Risks
The two biggest risks facing SWN are commodity prices and the company’s debt burden.
As to the former, I believe SWN’s strategy of hedging significant 2023 and early 2024 production helps the company protect free cash flow through the current low natgas price environment.
And, the company’s ability to pivot from the higher-cost, faster production growth Haynesville to the liquids-rich, cheap-to-produce Marcellus when commodity prices are low is an advantage of its dual basin strategy. Management has executed well, exceeding its guidance and Wall Street estimates so far this year.
However, should gas prices remain lower for longer, below $3/MMBtu through to the second half of 2024 then SWN would struggle to generate free cash flow without significant additional cuts to capital spending. Hedges can protect near-term cash flow, but should the futures curve flatten or stabilize at lower prices, it would be tough for SWN to layer in hedges at prices above its breakeven. Most likely that would also mean the company is forced to tap its credit lines to fund operations.
Again, I see this as a low-risk outcome, but commodity prices – especially gas prices -- are extraordinarily volatile and a lower-for-longer gas price environment is a risk.
Second, SWN has a lot of debt. As of the end of Q1, net debt stood at $4.1 billion against the company’s equity market capitalization of about $5.23 billion. SWN took on much of this debt in 2021 to fund the purchase of privately held GEP Haynesville and Indigo Natural Resources; these two buys are responsible for SWN’s entry into the Haynesville region as a significant player there.
In my view, Haynesville exposure is desirable because of the coming explosion in LNG export growth I just outlined as new terminals are put in service. Europe, in particular, is emerging as a major buyer of US natural gas volumes as the Continent seeks to replace volumes previously imported from Russia. SWN’s acreage in the region is well-placed to serve this fast-growing market.
Management has made progress paying down that debt and net debt peaked at $5.56 billion at the end of 2021; however, to continue paying down debt requires the company to generate free cash flow.
The firm has minimal exposure to near-term maturities; there’s only one bond issue of about $390 million that’s due to mature before 2028. However, the longer free cash flow remains depressed by commodity prices, the more worried investors are likely to become about SWN’s debt load. That’s even more true if the US economy enters recession; historically, heavily indebted companies underperform in a recessionary environment.
However, I believe SWN’s debt is manageable given the capacity to produce significant free cash flow even at low commodity prices and the fact that management has indicated that any free cash flow it does produce this year will go toward debt reduction. On top of that, in the Q1 call, management noted it has non-core assets it might look to sell, which would also offer cash to pay down debt.
Finally, even with the modest recovery in commodity prices next year I outlined above, free cash flow looks likely to recover to around $600 to $700 million. All told, management’s target of reducing total debt to $3.0 to $3.5 billion looks achievable next year. After that management will look at other means of returning capital to shareholders, which I suspect will include share buybacks and a dividend.
Of course, deriving a fundamental target price is an exercise fraught with assumptions, but let’s consider the potential upside in the stock based on a simple discounted cash flow analysis:
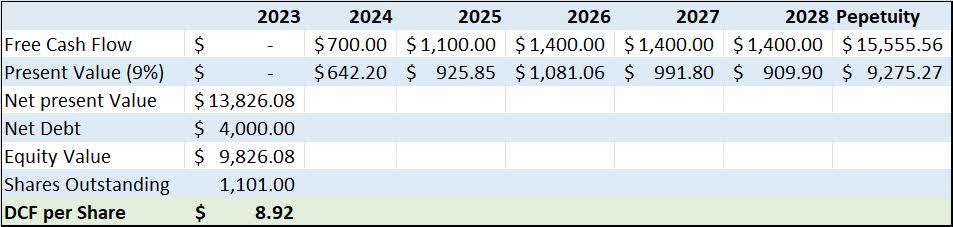
DCF Price Target Derivation for SWN (SWN 2023 Guidance, Personal Cash Flow Estimates and Bloomberg)
Earlier on in this article I showed how SWN could produce around $700 million in free cash flow per year at $3.25/Mcfe and a little under $1.5 billion at around $3.75/Mcfe; Wall Street consensus is for $725 million in 2024 and $1.1 billion in 2025.
So, this table contemplates no free cash flow for 2023, $700 million next year and $1.1 billion in 2025. I’m penciling in $1.4 billion a year for 2026 – 2028 and then $1.4 billion per year in perpetuity.
I see these estimates as on the conservative side. Free cash flow of $1.4 billion is achievable with a realized price of $3.75/Mcfe and based on the company’s 2023 production and cost guidance. The forward curve for natural gas alone shows prices north of $4/Mcf in 2026 and SWN has indicated it would likely boost drilling and production activity somewhat if commodity prices warranted such a move.
Obviously, it’s very difficult to estimate what SWN’s long term cash flows will be, but the company has indicated it has more than 15 years of drilling inventory.
Further, because of the way I’m discounting future cash flows back to a present value, the actual amount of cash SWN generates 15 years in the future has only a modest impact on the net present value. Just consider, $1.4 billion of free cash flow in 15 years discounted at 9% annualized is worth $384 million on a present value basis.
I chose a discount factor of 9% because debt has a 42.7% share of the capital structure and costs SWN 5.2% annualized. Equity (stock) is 57.3% of the capital structure and the cost of equity capital is over 11.1%. To calculate the latter, I used a Bloomberg approximation based on the risk-free interest rate in the US, and the beta (volatility) of SWN’s stock relative to the S&P 500.
All in, the net present value of SWN comes to $13.83 billion and I’m subtracting the current net debt of $4 billion to get an equity value of $9.83 billion. Given the current shares outstanding that comes to $8.92 per share compared to a current price under $5, about 85% of potential upside.
As I’ve outlined there are significant risks and calculating a valuation target is never exact science (not even close); however, even with modest commodity and cash flow assumptions, I see significant upside to SWN over the next 12 to 18 months.
This article was written by

Analyst’s Disclosure: I/we have a beneficial long position in the shares of SWN either through stock ownership, options, or other derivatives. I wrote this article myself, and it expresses my own opinions. I am not receiving compensation for it (other than from Seeking Alpha). I have no business relationship with any company whose stock is mentioned in this article.
Seeking Alpha's Disclosure: Past performance is no guarantee of future results. No recommendation or advice is being given as to whether any investment is suitable for a particular investor. Any views or opinions expressed above may not reflect those of Seeking Alpha as a whole. Seeking Alpha is not a licensed securities dealer, broker or US investment adviser or investment bank. Our analysts are third party authors that include both professional investors and individual investors who may not be licensed or certified by any institute or regulatory body.