XRT: The Street Is Betting Against Retail

Summary
- Many of the companies within XRT are already struggling, continued economic slowdown is likely to cause bankruptcies.
- A large number of shorts have positioned themselves anticipating that XRT will move down.
- The options market for XRT is also quite bearish.
- The ETF is diverging and has already fallen out of correlation with its peers.
- I rate XRT as a Sell.
youngvet/E+ via Getty Images
Thesis
The economic slowdown and upcoming recession has attracted a large number of short positions on the SPDR® S&P Retail ETF (NYSEARCA:XRT). After looking over the situation many of these retailers are in, I believe it is wise to join them. XRT is a Sell.
Holdings
The XRT contains a basket of retailers. The expectation here is that while some of these companies are likely to thrive during a recession, a majority of them will struggle, and some of them will fail.
XRT Holdings (Seeking Alpha)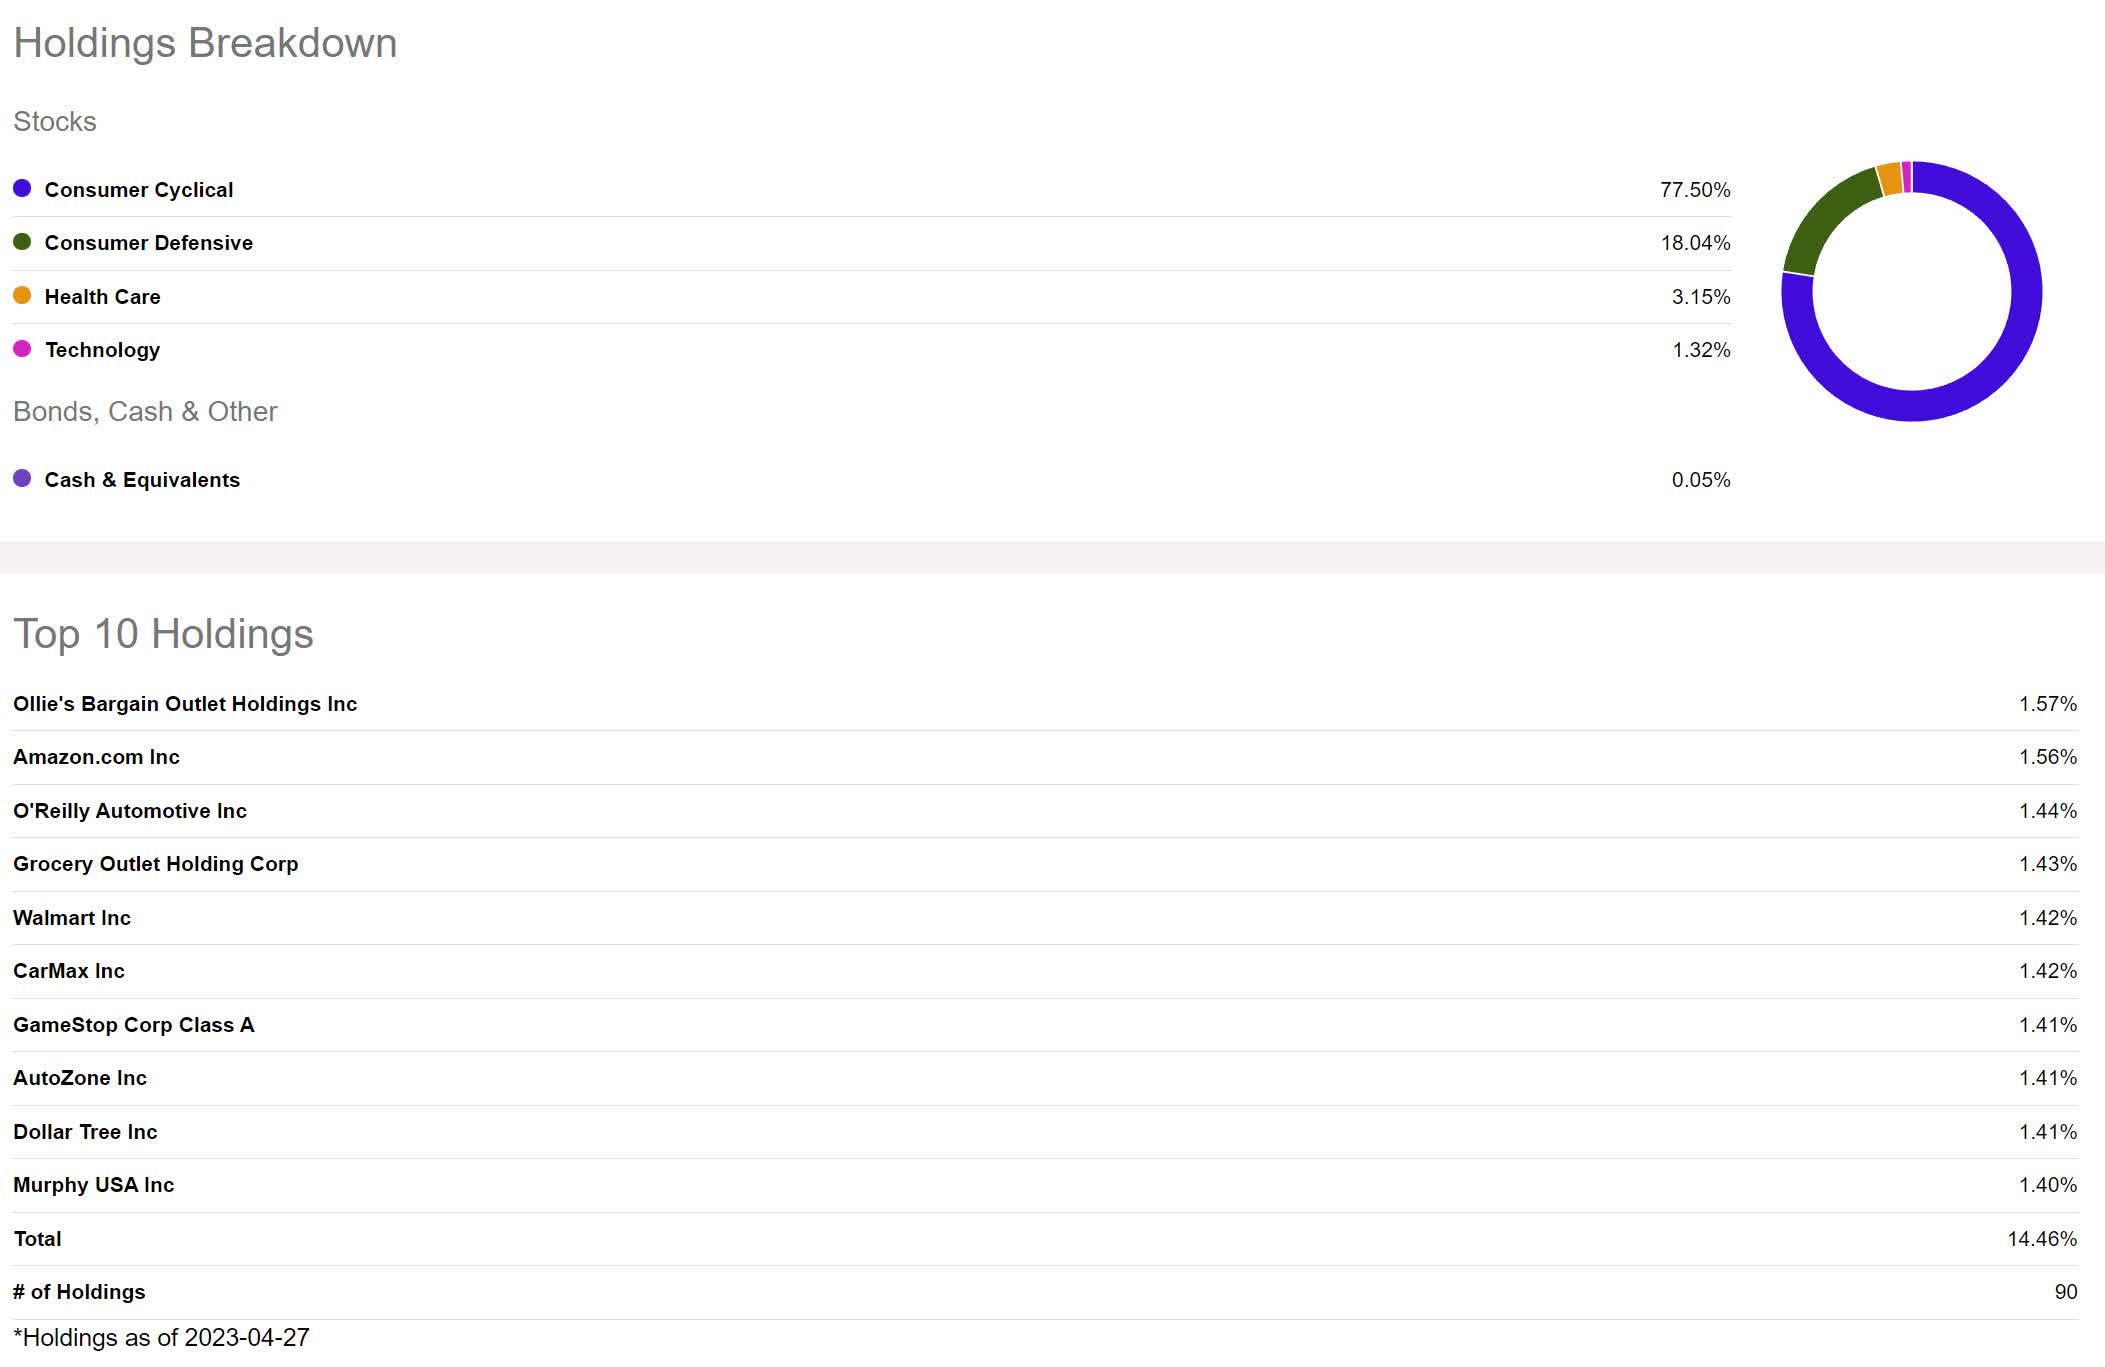
The Headwinds
Much uncertainty still surrounds the pace of rate hikes, what the terminal rate will be, how long the Fed will let the market soak in that fully elevated rate, and the pace of eventual rate declines. While the ETF also contains companies which can be expected to thrive long-term such as Walmart (WMT) and Amazon (AMZN), it also contains companies which are unlikely to survive continued pressure. Without doing a deep dive on every company in the ETF, I found several retailers in the sector which are facing hard times:
The Children's Place, Inc. (PLCE)
Rite Aid Corporation (RAD)
Big Lots, Inc. (BIG)
Kirkland's, Inc. (KIRK)
Mattress Firm Group Inc. (MFRM)
The Bears Are Piling In
I wouldn't be writing this article had XRT not presented itself as an outlier in my screens. Large volumes of short shares being transacted in a market do not always translate into large volumes of active short positions. Days to Cover typically gives a more clear indication of the total number of short shares in a market. Even then, Days to Cover is a calculated number and one of the values that goes into it is only updated once every two weeks. With it using lagging data, it cannot be relied on as a sole indicator.
Short interest values above 20% are often seen as bearish. As of my writing this on Sunday, May 1st, 2023, XRT is currently at 445.99%. Opinions vary greatly on this, but Days to Cover values below 0.5 can be seen as bullish, above 1 is slightly bearish, and above 5 is typically looked at as potential short squeeze territory.
XRT Short Interest (Seeking Alpha)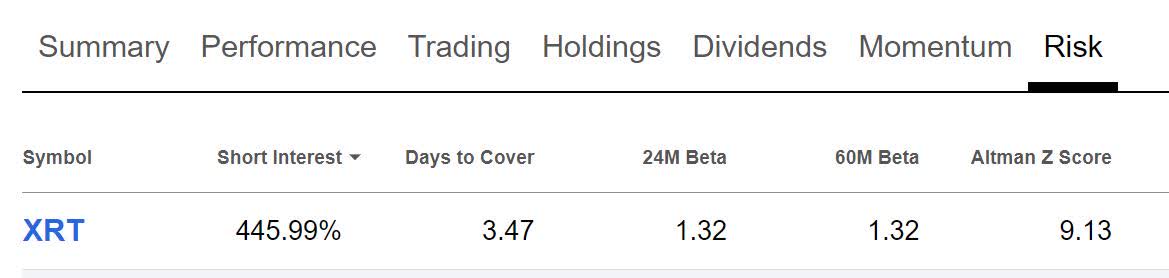
Since no one provider of information pays to receive market data from every source, they all give an incomplete picture of the situation. This is why it's important to look at Days to Cover and Short Interest from multiple sources. While Seeking Alpha cited a 3.47 Days to Cover, Fintel is showing it as 4.92. Fintel is also showing an unusually high off-exchange short volume ratio of 77.04%
XRT Short Interest Ratio (Fintel.io)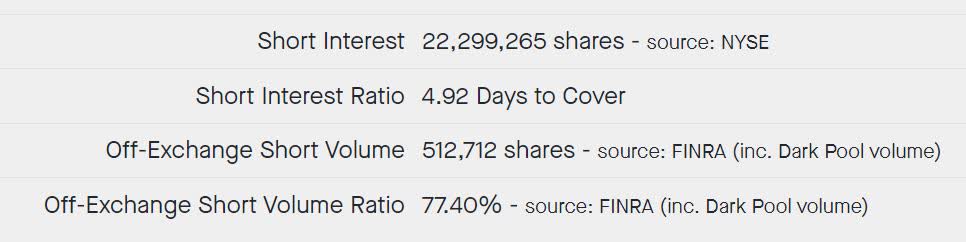
Ortex is also stuck using delayed data, but even they are showing a significant spike in Days to Cover.
XRT Price vs Short Interest % of Free Float vs Days to Cover (Ortex.com)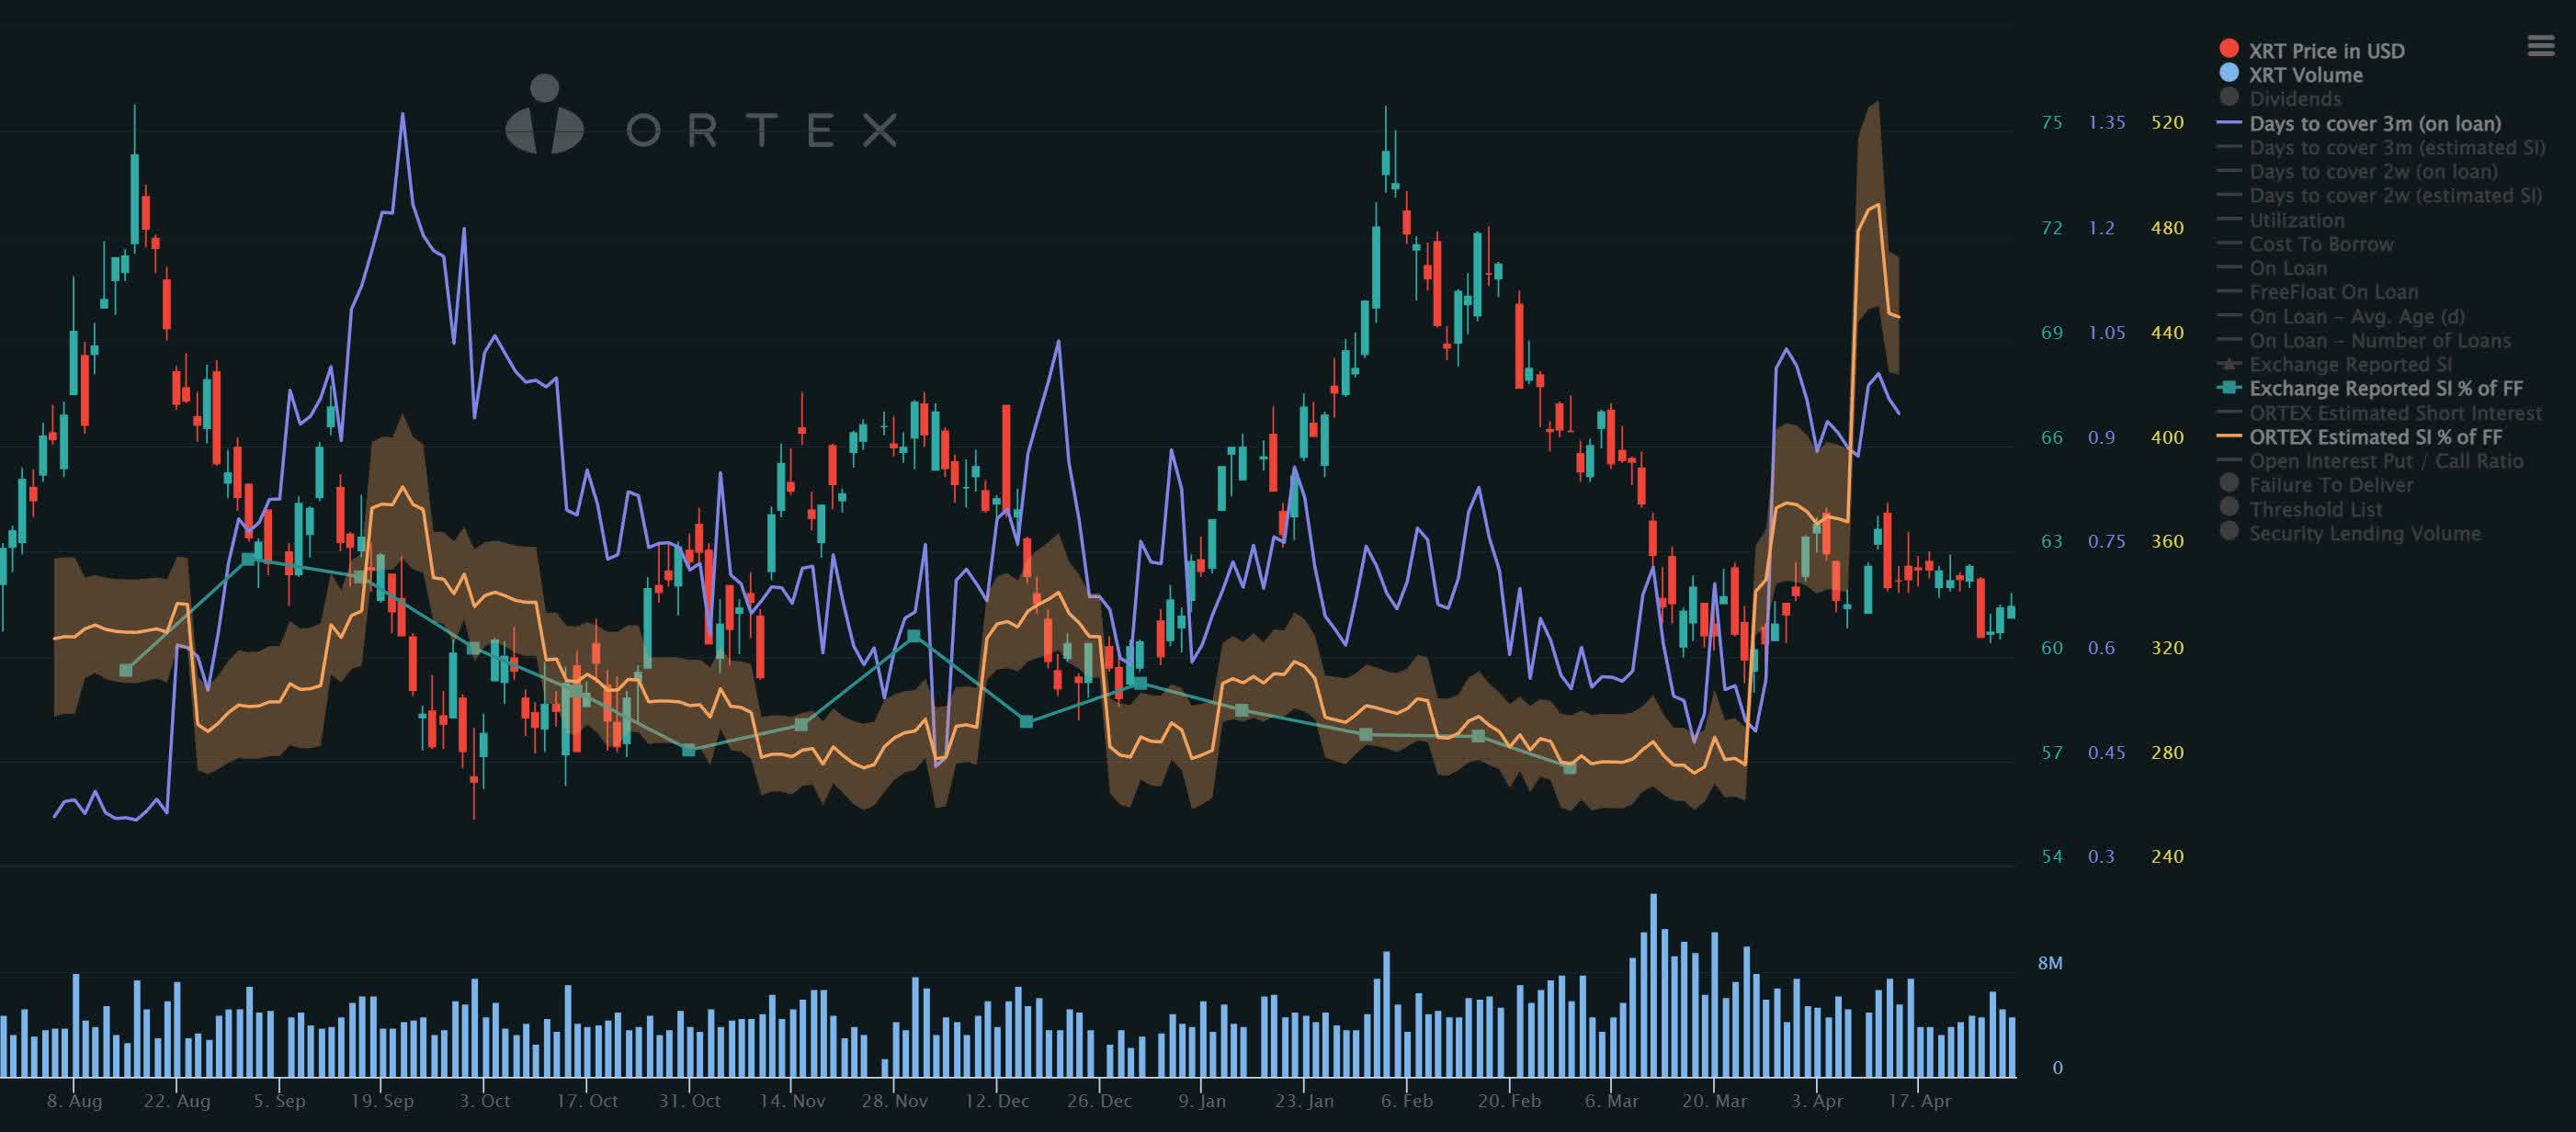
Taking a look at the Ortex values, they seem to fall in line with Fintel's data showing that short interest as a percentage of the free float is at about 450%. They do list a much lower 0.97 Days to Cover.
XRT Short Interest and Days to Cover (Ortex.com)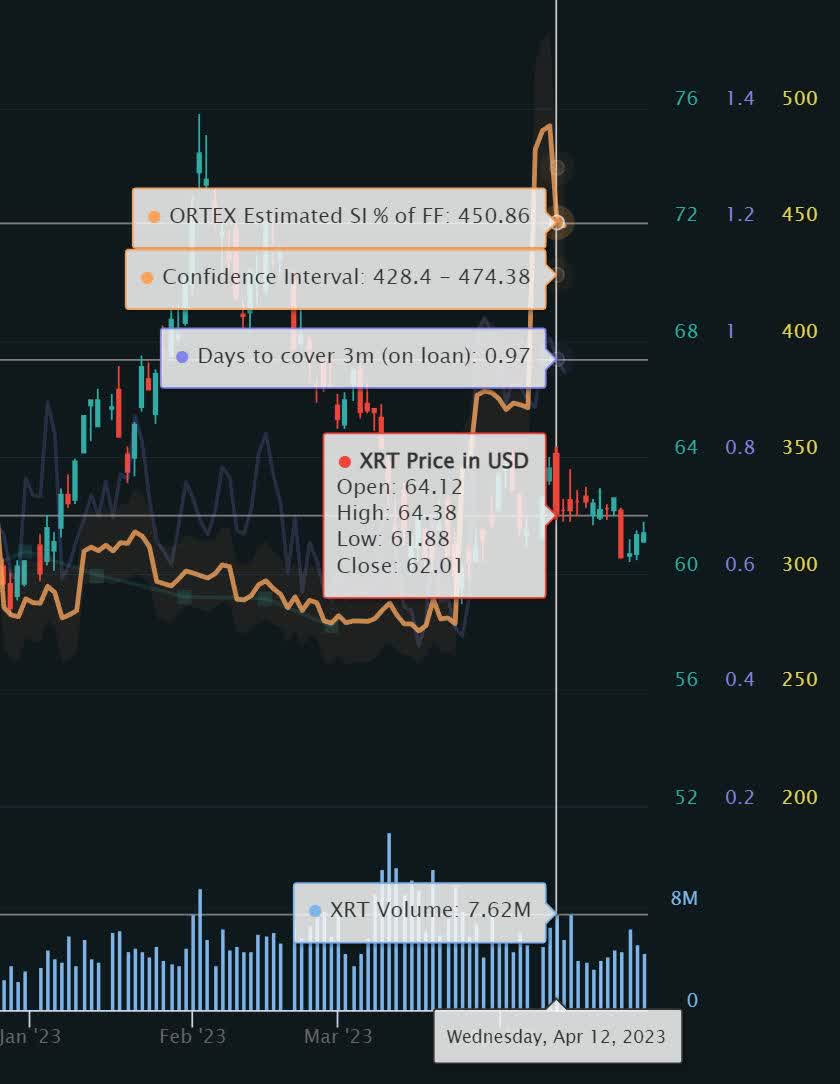
The options chain is also showing strong bearishness. The Call/Put Ratio by volume is 1:12.72, and the open interest Call/Put Ratio is 1:3.13. While it is true that one can also sell out of the money calls as a bearish play, most people will just buy puts. This means that strong imbalances in the Call/Put Ratio are typically indicative of sentiment.
XRT Options Chain (Fidelity Active Trader Pro)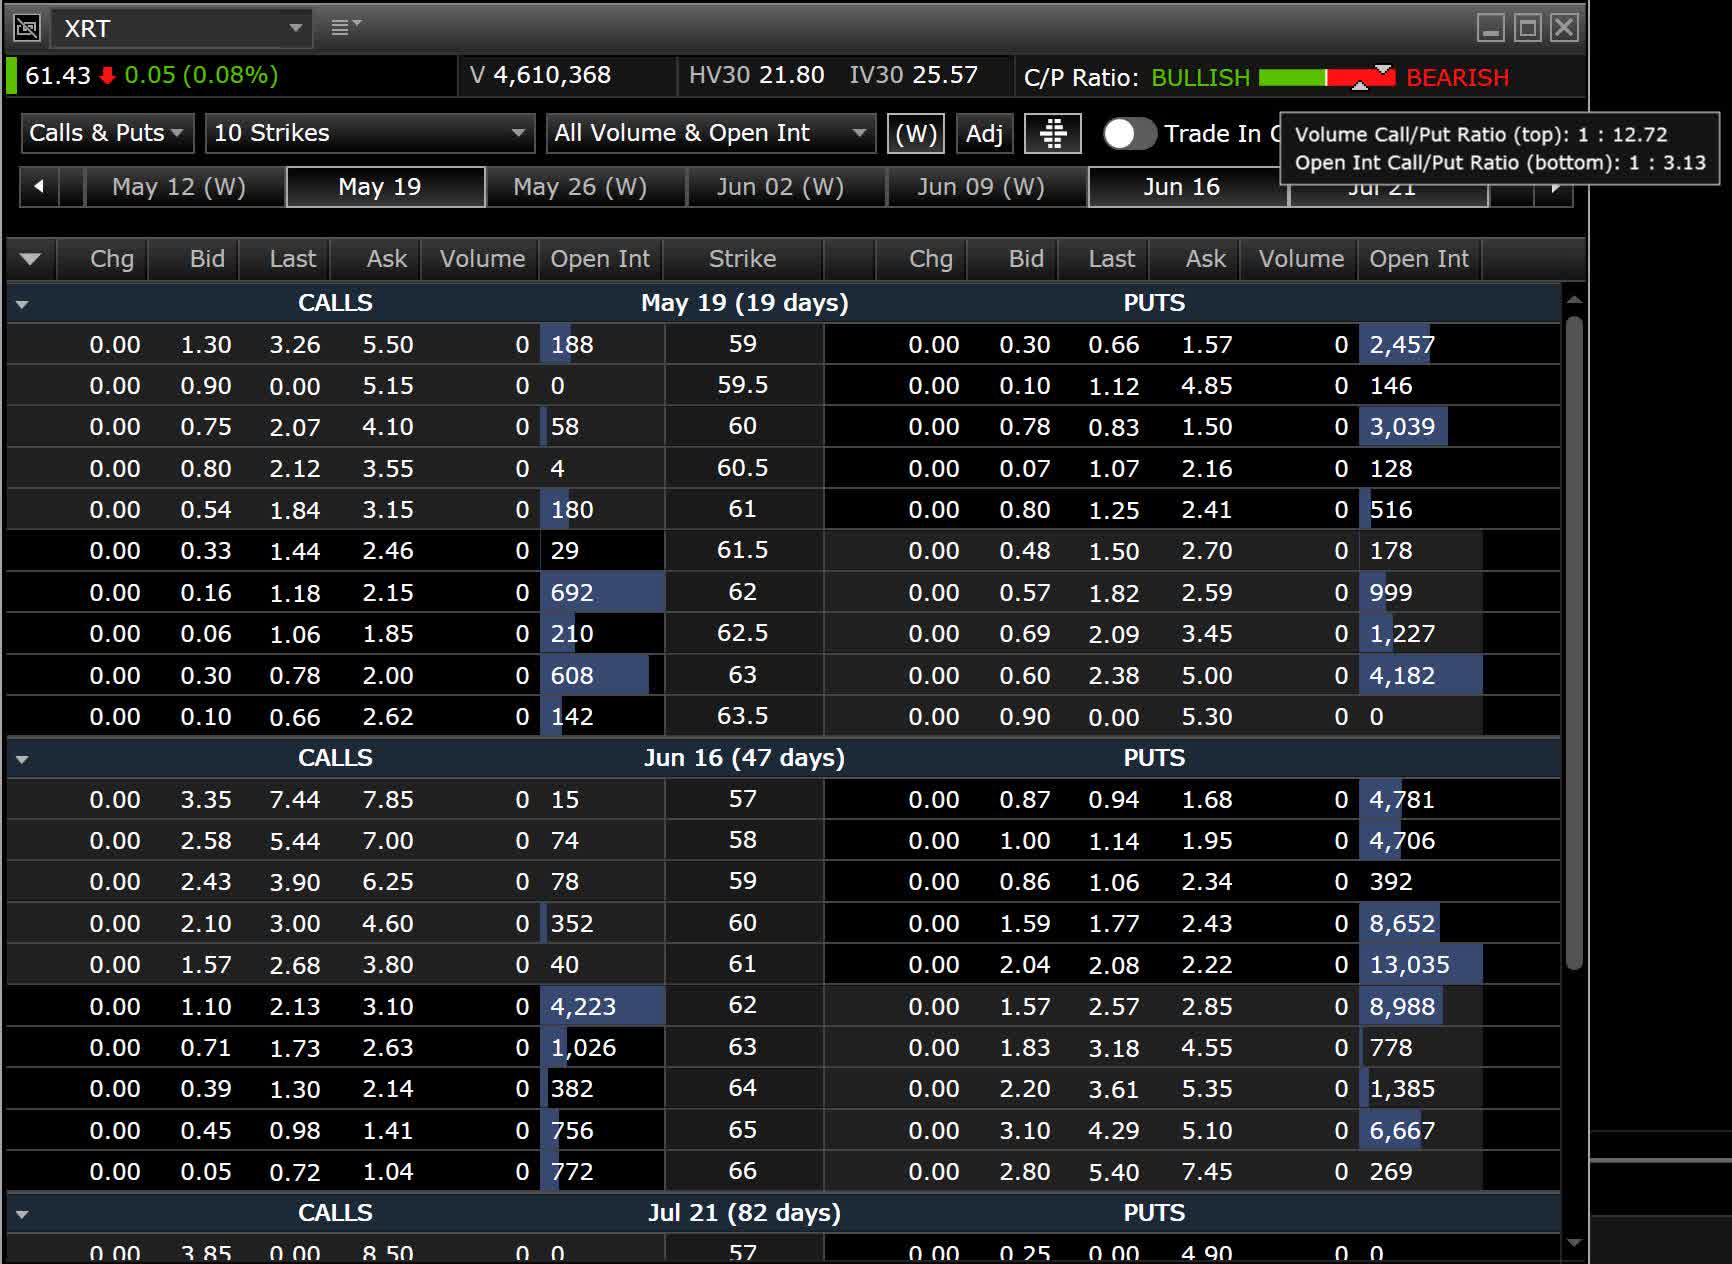
A Lack Of Strength
When I asked Seeking Alpha to hand me a chart of XRT compared to its peers this is what it gave me. We can see that for most of the last year, it was highly correlated with the majority of them. When it reached a low in late March, it failed to maintain parity and fell into a divergence.
XRT Divergence (Seeking Alpha)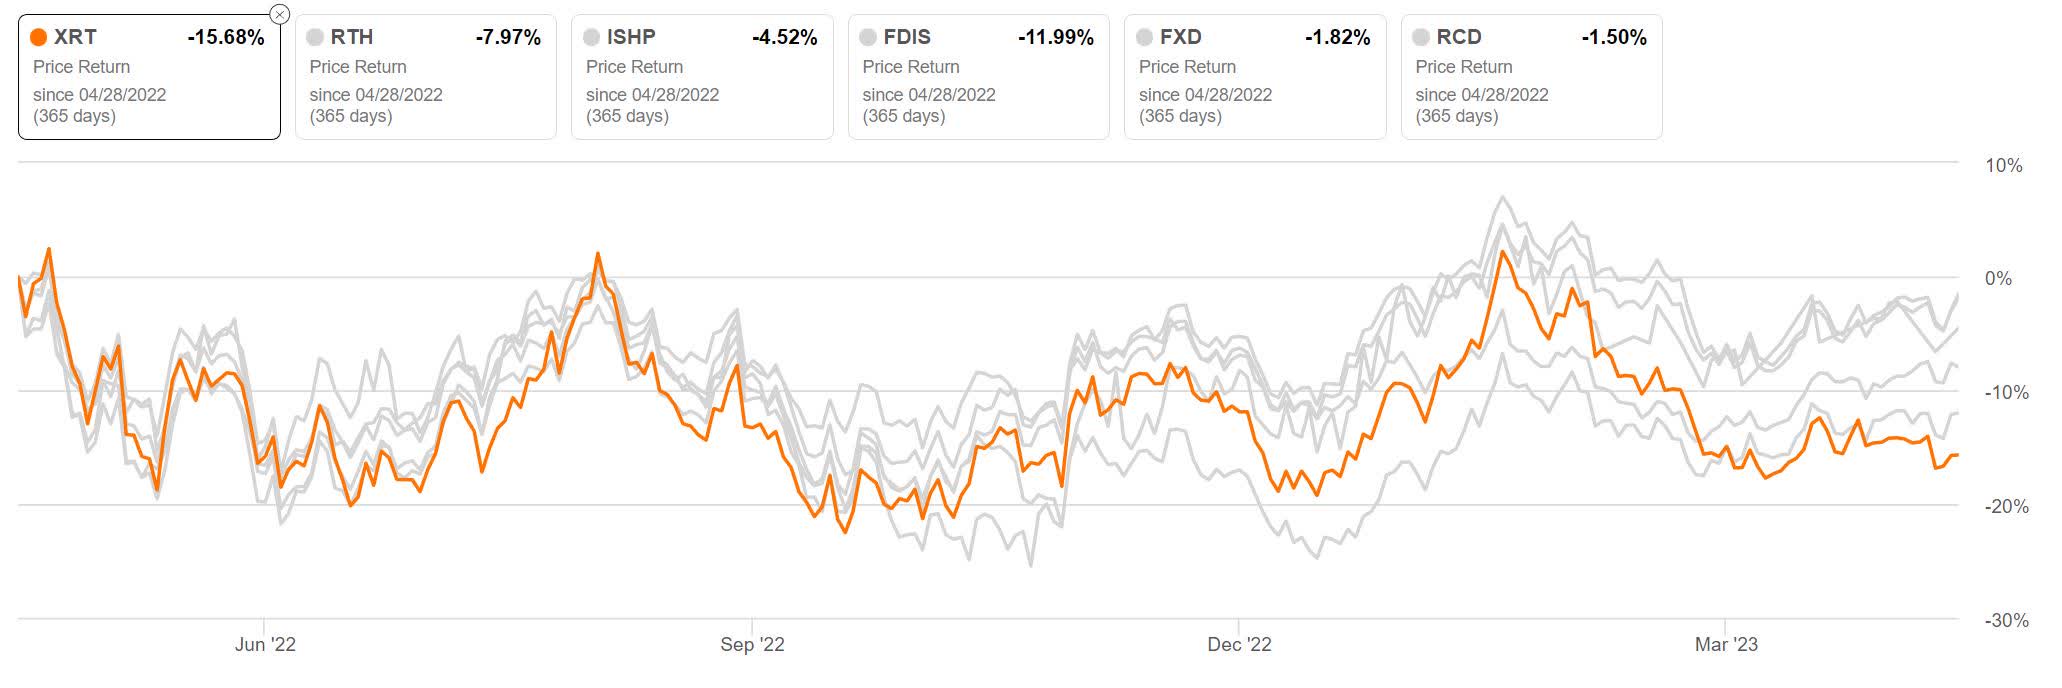
Risks
It is possible the economy degrades quickly and the Fed begins lowering rates earlier than expected. The shift in sentiment that would come with this may be enough to cause a significant amount of the shorts to cover. If the rally is violent enough, it may develop into a squeeze.
Catalysts
If core inflation stays elevated or climbs further, the Fed may be forced to raise rates both faster and higher than is currently projected.
If or when more of the larger more profitable retailers post poor earnings reports or guidance, it may cause a sentiment shift strong enough to induce a sudden decline.
Conclusions
Although unlikely, with Days to Cover this high the potential for a short squeeze is real. With it being unwise to short XRT, I decided to look into put ratio spreads.
After looking at the long time-frame chart it became clear that very strong support exists around $38 or $39. XRT briefly reached a low of around $28 during the 2020 pandemic-induced sell-off. Because of this, I decided that XRT might actually drop below the support of around $38 and instead, I should try to push the break-even to around $30 per share.
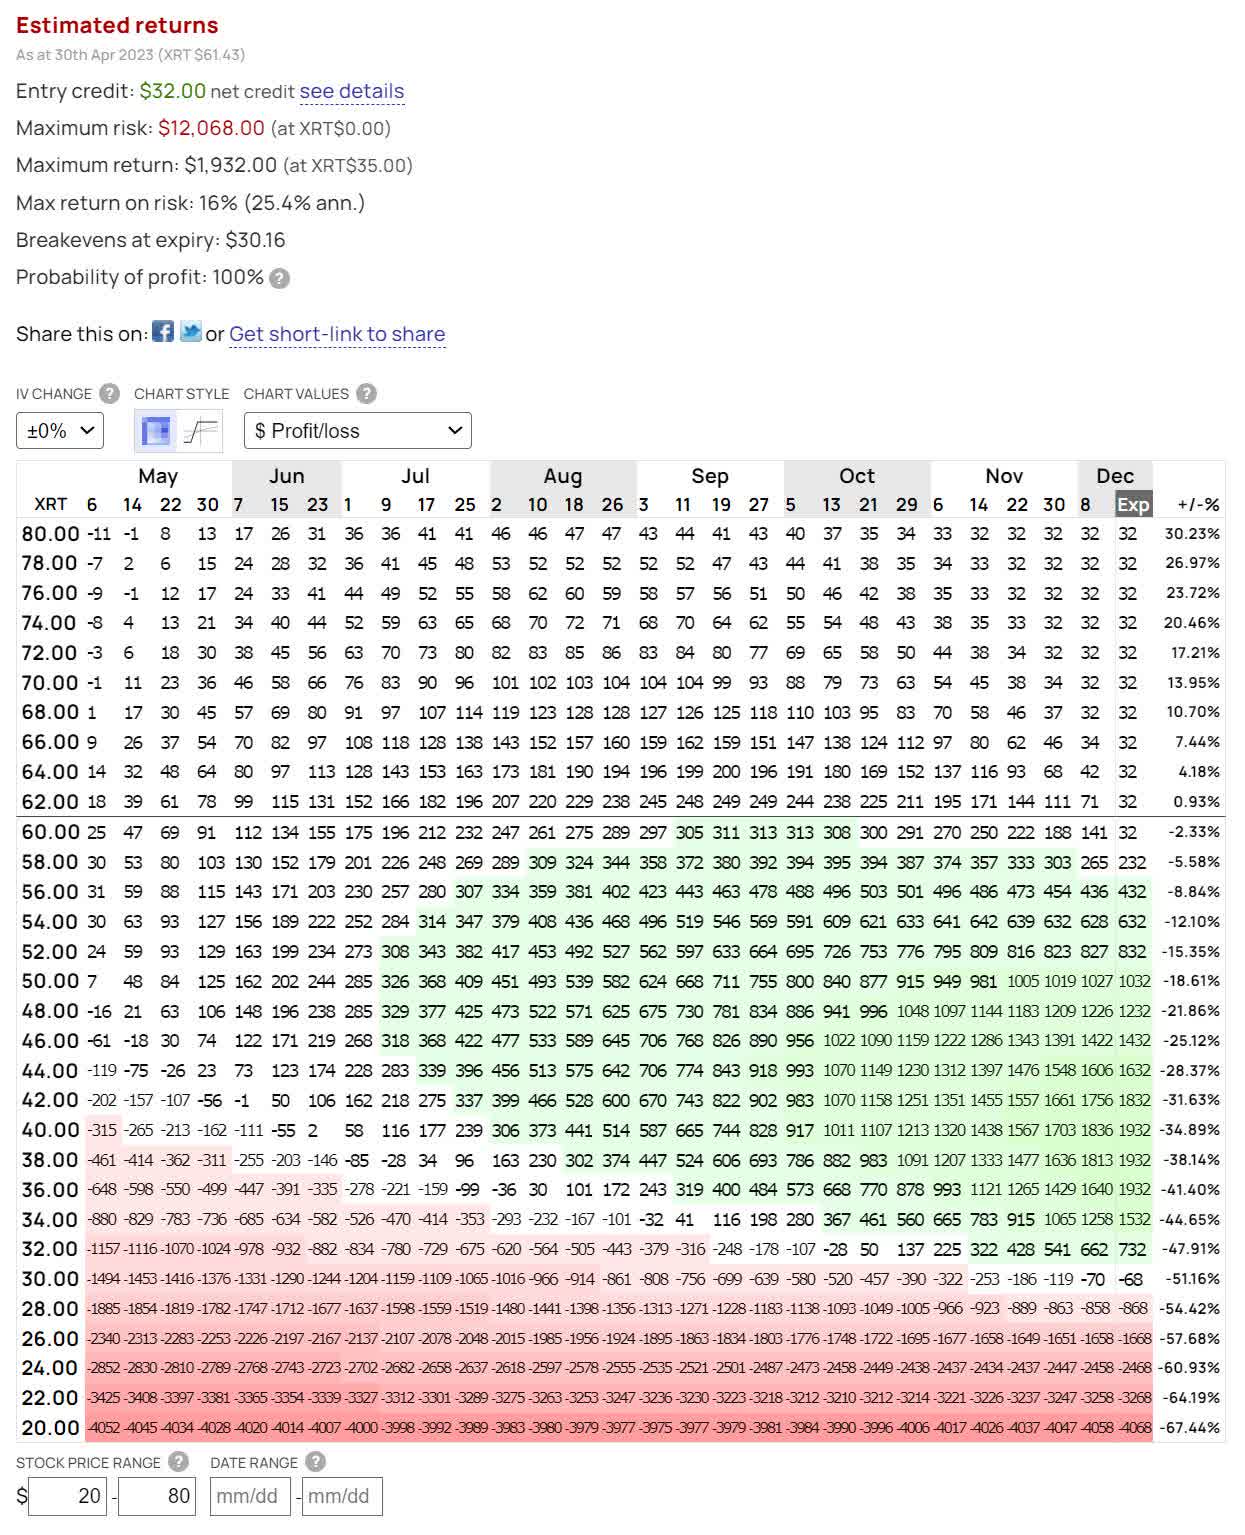
This is a modified front put ratio spread. With a normal front put ratio spread, one would buy a single put with strike that is close to the money and pay for it by selling two puts at a lower strike. In this case, however, that would leave your break-even above resistance. In order to force the break-even below resistance, we can take choose to only sell one put at a place that we would like our max profit to be centered around. I chose $41 as my price target but you are welcome to choose a different one. In order to pay for the difference in premium, a third leg was added where multiple puts are sold at an even lower strike price. The way the below trade is set up right now, max profit is at $41 per share and the break-even has been pushed down to $30.16, reaching a point where it rounded the probability of profit from 99.9% to 100%. The position is short 5 puts and only long 1, so if price falls below $30.16 it begins taking losses as if you were short 4 puts. Despite the low chance of experiencing a loss, it does carry with it considerable risk.
XRT Options Trade 1 (Optionsprofitcalculator.com) XRT Options Trade 2 (Optionsprofitcalculator.com)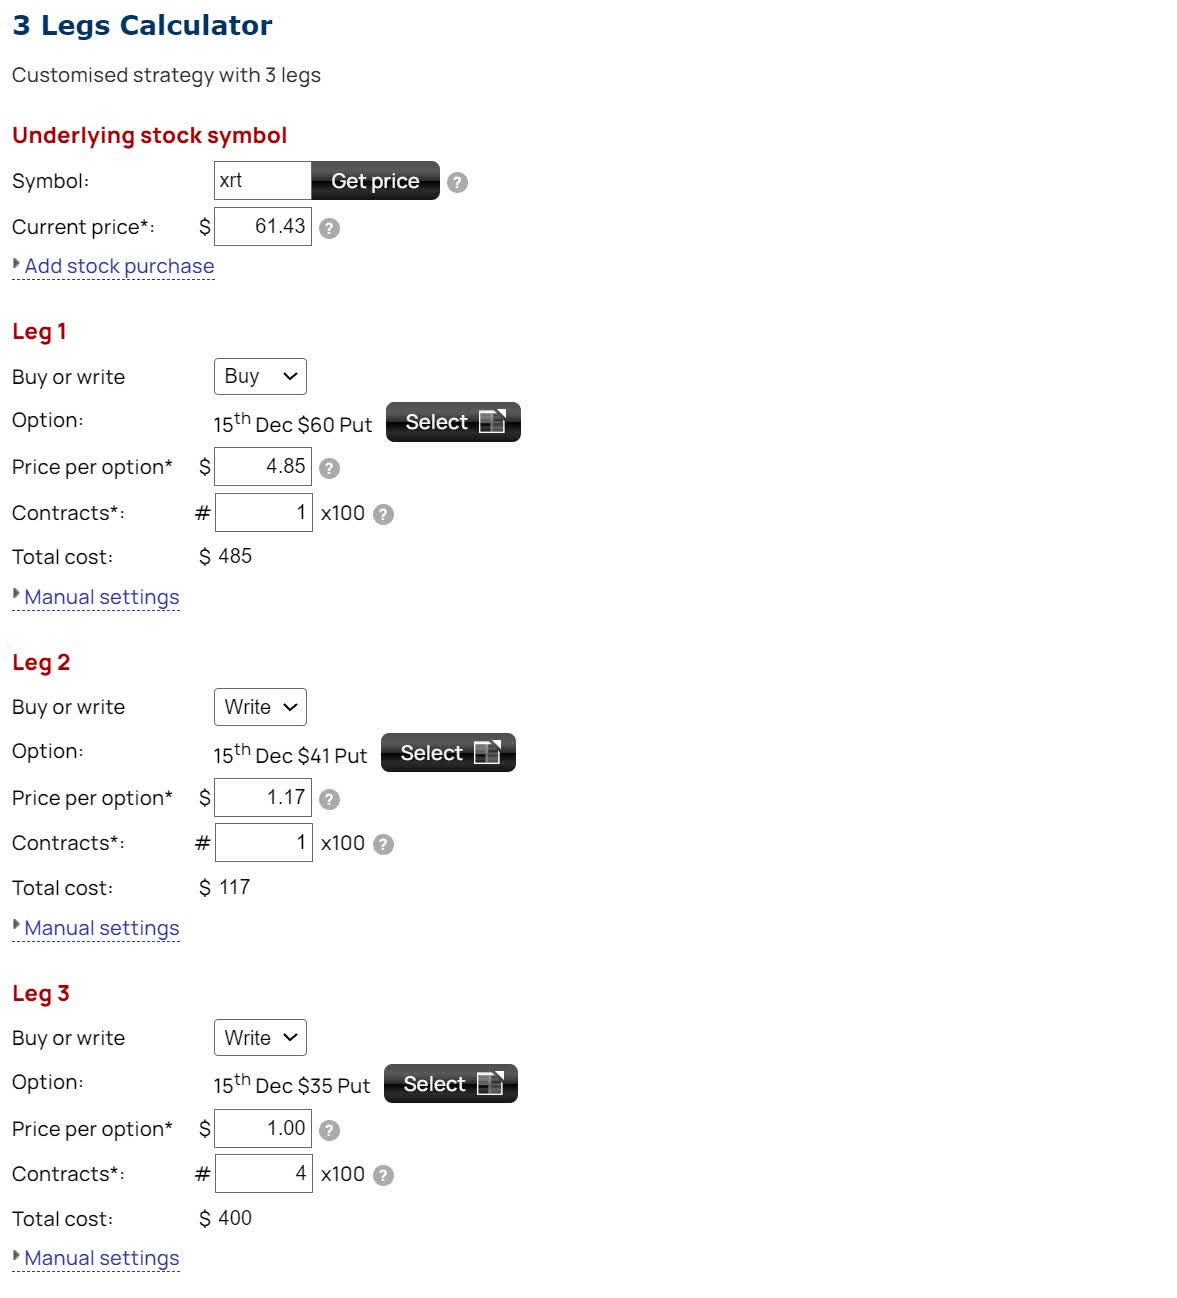
The primary reason this is better than shorting is that if a short squeeze occurs, you can choose to ignore it. You can even exit the position mid-squeeze for a small gain and then enter a new put spread while the underlying is trading at a higher value. Similar results should be achievable with a bearish calendar and diagonal spreads.
I currently have all my free capital tied up into other investments so I will not be entering a position on XRT.
This article was written by

Analyst’s Disclosure: I/we have no stock, option or similar derivative position in any of the companies mentioned, and no plans to initiate any such positions within the next 72 hours. I wrote this article myself, and it expresses my own opinions. I am not receiving compensation for it (other than from Seeking Alpha). I have no business relationship with any company whose stock is mentioned in this article.
Seeking Alpha's Disclosure: Past performance is no guarantee of future results. No recommendation or advice is being given as to whether any investment is suitable for a particular investor. Any views or opinions expressed above may not reflect those of Seeking Alpha as a whole. Seeking Alpha is not a licensed securities dealer, broker or US investment adviser or investment bank. Our analysts are third party authors that include both professional investors and individual investors who may not be licensed or certified by any institute or regulatory body.