FALN: Update On This Strong-Performing Defensive High-Yield Bond Option
Summary
- We take another look at FALN - a higher-quality High-Yield corporate bond ETF, having a portfolio yield of 7.6%.
- FALN has outperformed the broader High Yield corporate bond sector, including all but 1 HY CEFs in 5Y total NAV terms.
- FALN benefits from the so-called fallen angel effect which is to allocate to investment-grade bonds that were recently downgraded into "junk".
- We expect another wave of fallen angels this year which should provide a performance boost for FALN.
- FALN is also attractive as a relatively defensive option in income portfolios for investors who are not quite ready to derisk fully.
- Systematic Income members get exclusive access to our real-world portfolio. See all our investments here »
cagkansayin
This article was first released to Systematic Income subscribers and free trials on Apr. 25
In this article we take another look at one of our holdings - the iShares Fallen Angels USD Bond ETF (NASDAQ:FALN). FALN allocates to higher-quality high-yield corporate bonds, specifically, fallen angels or investment-grade bonds that have been recently downgraded to high-yield, typically, moving from a rating of BBB (to use the S&P / Fitch notation) to BB - the highest "junk credit rating.
When this happens, a large number of investors, who have investment-grade mandates, will often need to shed these bonds over time which can depress their price relative to fundamentals. This allows fallen angel ETFs to buy these downgraded and technically depressed bonds and benefit from their attractive valuation relative to fundamentals.
FALN has outperformed the broader HY corporate bond sector since its addition to the Defensive Income Portfolio and remains an attractive option either for defensive investors or for investors looking to build out a more resilient part of their portfolio without necessarily going to cash. FALN has a 7.6% portfolio yield.
Quick Snapshot
FALN is a passive ETF that allocates to one of the fallen angel bond indices (in this case the Bloomberg US HY Fallen Angel 3% Capped Index). It is relatively liquid with daily volume of half a million shares or around $13m in market value.
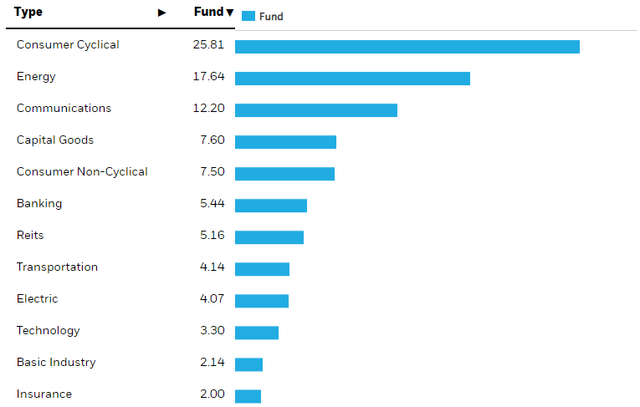
The fund's top sector allocations are as shown below. More relevant, perhaps, is how its allocation differs from the broader HY market. In this regard, the fund is overweight Energy (18% vs. 11% for the broader index) and Banking (5.4% vs. zeroish) and underweight Consumer Non-Cyclical (8% vs. 13% for the broader index) and Technology (3% vs. 7% for the broader index).
As expected, in terms of credit quality, the fund is overweight BB-rated bonds (79% vs. 50% for the index) with a minimal CCC allocation of 3% vs. 9% for the index.
FALN has a yield-to-maturity of 7.63% and a 0.25% management fee. An important question is how the fund's performance stands relative to its benchmark. Here, we see that it has underperformed by about 0.5% per annum. An underperformance relative to benchmark for a passive fund is entirely expected given the additional costs of trading and the management fee. Half of the underperformance is due to the fee and the rest from additional trading costs and, perhaps, the portfolio sampling noise vs. the index. An annual lag of 0.25% outside of the management fee is pretty good in our view.
Many investors avoid open-end funds with the view that these funds can struggle from investor flows (i.e. having to sell bonds during outflows and buy them back during inflows). This view misses the point that much of ETF trading takes place in the secondary market i.e. using ETF shares themselves rather than through underlying bonds. Moreover, the creation-redemption mechanism is sufficiently flexible and robust to support trading during very volatile markets. The 0.25% annualized lag over 7 years, particularly through very difficult trading periods, shows that the ETF structure is strong enough to handle very stressed environments.
Performance Update
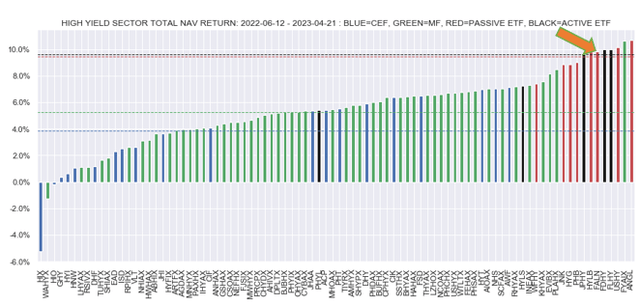
We last highlighted FALN in the middle of last year as an attractive defensive option for income investors. Since then the fund has done well, being in the top few funds in total NAV return terms. The chart below splits out funds by type - blue being CEFs, red and black being ETFs and green being mutual funds. Interestingly, the best performing fund was ANGL - a competitor of FALN in the fallen angel ETF space.
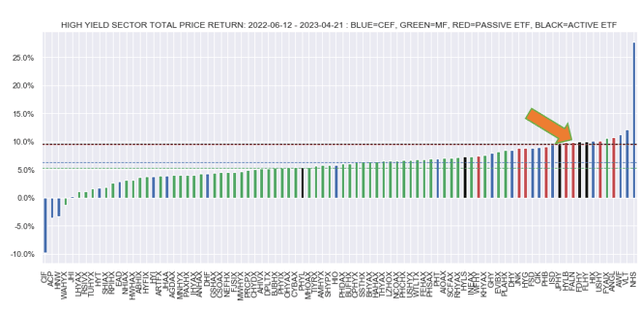
On a total price return basis FALN also looks strong though now there are a number of CEFs that are ahead of it due to their strong valuation increase.
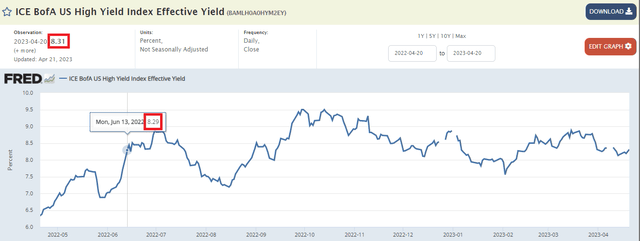
What's interesting about this performance is that it happened in a period where the broader HY corporate bond index was basically unchanged as the index yield went from 8.29% to 8.31%.
In theory, a fund that allocates to higher-quality bonds in the sector would have lagged in this environment due to a lower level of yield (last June the fund's yield was 7.5% or 0.8% below the broader index), particularly lagging CEFs that can generate an even higher level of yield than the broader index due to being leveraged.
This stronger level of performance is not totally unexpected however given it's part of a historic pattern. The chart below shows that the two fallen angel funds have beaten the broader HY corporate bond sector funds by a substantial margin since 2016 (we pick 2016 because that's when FALN got going). If we go back to the start of ANGL in 2012, the outperformance is even stronger.
Systematic Income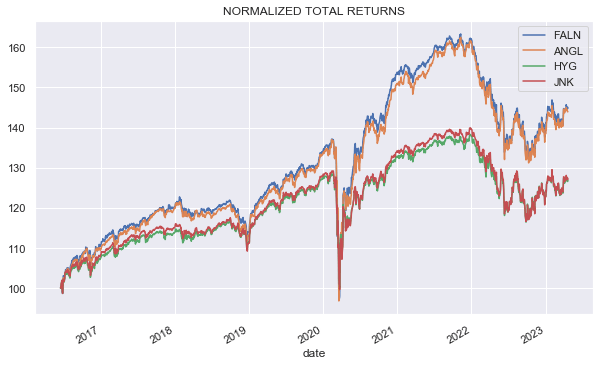
This is what the annualized return figures look like. We see that the fallen angel funds have beaten the broader sector funds by 2% per annum.
Systematic Income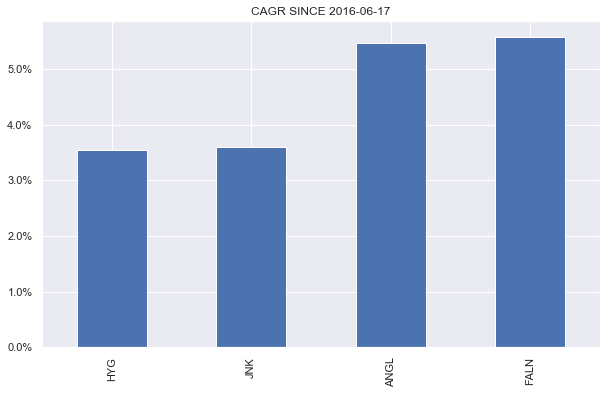
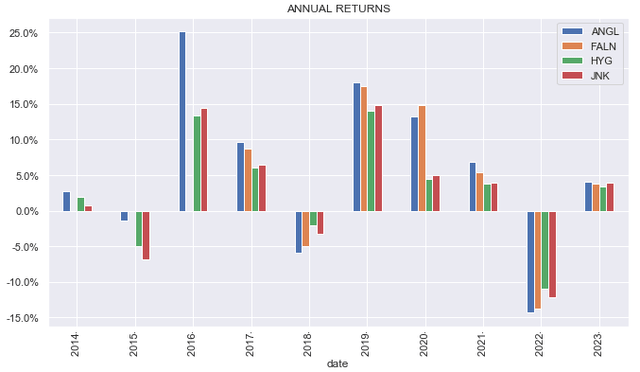
If we disaggregate returns by years we see that 2022 was a rare off year for the funds. The key reason for this is the simple fact that the fallen angel funds tend to be longer duration than the HY sector. This is because investment-grade bonds tend to be issued at longer maturities than HY bonds. FALN duration is 4.95 vs. 3.7 for the broader HY space.
The 2% per annum outperformance is quite strong however it, arguably, understates potential through-the-cycle performance of these funds relative to the broader HY sector. One is that when FALN got going in mid-2016, HY bond yields were around 1% lower than they are now which should be a headwind for FALN due to its higher duration. And, two, since 2016, we haven't had a "real" recession - an environment where a fund like FALN should significantly outperform.
We get a flavor of this potential outperformance from the very strong ANGL return in 2016 when the market was coming out of a near-recession due to the Oil price shock. We also get a flavor of this from the very unusual and very short-lived recession in 2020 when both funds significantly outperformed the broader HY market.
One reason for the outperformance in 2016 and 2020, apart from their higher quality, was the simple fact that there were many more fallen angels at those times as the following chart shows. This allowed the funds to take advantage of relatively beaten down securities.
Bloomberg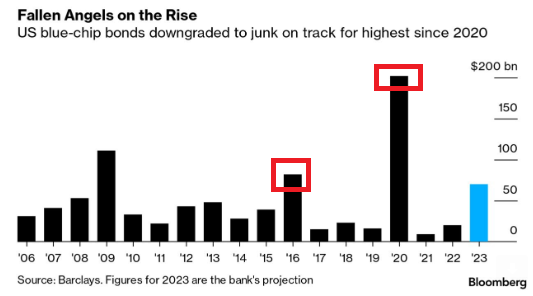
What the chart also shows is that we should expect more fallen angels this year. Barclays expected $60-80bn of new fallen angels this year as downgrades accelerate. This should be a boost for a fund like FALN.
Over the longer-term, the two funds have done very well, outperforming even CEFs, despite the fact that CEFs can generate a much higher yield via their use of leverage.
Systematic Income Funds Tool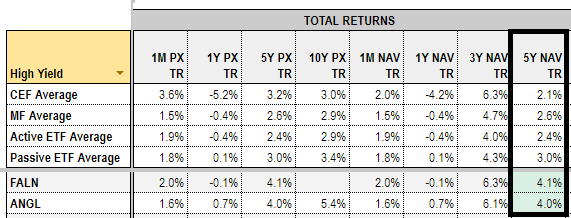
Takeaways
Fallen angel strategies remain attractive, particularly for investors looking to build out a more defensive part of the portfolio without necessarily going to cash.
Funds like FALN take advantage of the fairly bifurcated corporate bond market. Many investors have primarily investment-grade mandates, requiring them to sell bonds downgraded to junk which pushes their prices below fundamental value and allow a fund like FALN to generate alpha on top of its income.
The fund's holdings also have "rising star" potential - additional demand from IG investors for bonds that get upgraded back up to investment-grade.
A fallen angel fund like FALN has a number of defensive features. One, is that it allocates to higher-quality bonds which have a lower default rate.
And two, even in case of a default, the downside risk is lower for fallen angels. IG bonds are issued at lower coupons than HY bonds so when the IG bond falls into HY, its price is lower than the average bond trading at a similar yield. The lower trading price means there is also less downside in the worst case scenario, all else equal.
It may seem like investors who opt for a fallen angel fund over a generic high-yield one are leaving yield on the table. And it's true that the generic HY corporate bond ETFs are trading at portfolio yields around 1% above that of the fallen angel funds.
However, it's important to adjust these yields for the higher default rates of the generic all-sector funds. For instance, while 3-year cumulative default rates for BB-rated bonds is 3.4%, it is nearly 3x as high for the broader high-yield market at 9.9%. Once we take this into account, the post-default yields are roughly similar. And obviously, the proof is in the pudding that the fallen angel funds have fairly consistently outperformed their generic counterparts so their lower portfolio yields don't stay in the way of outperformance.
The key risk for investors is that fallen angels can be vulnerable to rising rates as they have a longer duration profile due to longer maturities. However, interest rates have already adjusted higher from the start of 2022 and with the Fed looking to pivot soon to rate cuts in the context of a continued drop in leading indicators, the risk to longer-term rates is arguably much more symmetric than it was in 2021.
Check out Systematic Income and explore our Income Portfolios, engineered with both yield and risk management considerations.
Use our powerful Interactive Investor Tools to navigate the BDC, CEF, OEF, preferred and baby bond markets.
Read our Investor Guides: to CEFs, Preferreds and PIMCO CEFs.
Check us out on a no-risk basis - sign up for a 2-week free trial!
This article was written by
At Systematic Income our aim is to build robust Income Portfolios with mid-to-high single digit yields and provide investors with unique Interactive Tools to cut through the wealth of different investment options across BDCs, CEFs, ETFs, mutual funds, preferred stocks and more. Join us on our Marketplace service Systematic Income.
Our background is in research and trading at several bulge-bracket global investment banks along with technical savvy which helps to round out our service.
Analyst’s Disclosure: I/we have a beneficial long position in the shares of FALN either through stock ownership, options, or other derivatives. I wrote this article myself, and it expresses my own opinions. I am not receiving compensation for it (other than from Seeking Alpha). I have no business relationship with any company whose stock is mentioned in this article.
Seeking Alpha's Disclosure: Past performance is no guarantee of future results. No recommendation or advice is being given as to whether any investment is suitable for a particular investor. Any views or opinions expressed above may not reflect those of Seeking Alpha as a whole. Seeking Alpha is not a licensed securities dealer, broker or US investment adviser or investment bank. Our analysts are third party authors that include both professional investors and individual investors who may not be licensed or certified by any institute or regulatory body.

