CVS Health: Explaining The Guidance Cut And How To Evaluate It After Q1 Earnings Beat

Summary
- CVS Health just published its Q1-23 results, beating even my above-consensus expectations. The company is on pace for another high-single-digits growth year, beating analyst estimates and its own too-conservative guidance.
- Healthcare Benefits revenues grew by 12.0%, Health Services grew by 12.5%, and Pharmacy & Consumer Wellness grew by 7.8%.
- Overall, revenues grew by 11.0% YoY and Adj. EBIT decreased by 5.1%, reflecting a 90 bps margin decline, primarily due to lower Covid-19 related revenues in the Pharmacy segment.
- The company cut its 2023 EPS guidance in order to reflect acquisition-related costs, which weren't included in the previous guidance. Excluding those, CVS actually raised its guidance.
- I reiterate my Strong Buy rating and update my price target to $95.7 per share.
Tim Boyle
CVS Health (NYSE:CVS) just announced its Q1-23 results, reporting 11.0% revenue growth and a 90 bps Adj. EBIT margin decline from the prior year period. The company is impressively progressing with its healthcare services strategy, as it closed the Signify and Oak Street Acquisitions. Now, we arrived at the last and most crucial step, as CVS begins the integration process. For our investment thesis in the company to prove right, we are expecting to see three key items in the mid-term - margin expansion primarily through synergies; significant reduction of leverage; and mid to high single-digit revenue growth.
As CVS is currently trading 17.2% below its historical P/E multiple, way below its peers' average, and 35.8% below my fair value estimate, I reiterate my Strong Buy rating, with a price target of $95.7 per share, and provide what I view as the correct methodology to evaluate the group.
Background
Two months ago, I published an article covering CVS and rated the stock a Strong Buy despite the pessimistic environment surrounding healthcare stocks in general and CVS specifically. I urge you to read that article, in which I described my investment thesis in detail, as well as the group's operating segments, risks, competitors, major growth prospects, why I view the company's acquisitions positively, and the reasons for its sell-off. Additionally, I explained the unique cash cycle of CVS as a health insurer, which resulted in a double-digit FCF yield at that time.
In short, my investment thesis regarding CVS Health is based upon its unique position in the healthcare value chain with its insurance, care delivery, pharmacy services, and retail businesses. After integrating Signify Health and Oak Street Health into the company, CVS will be able to provide all of its customers' healthcare needs, at better prices than most of its competitors, yet with higher profitability, due to significant synergies between its operating segments.
Unfortunately, we can see that since my article, CVS has underperformed the healthcare services index:
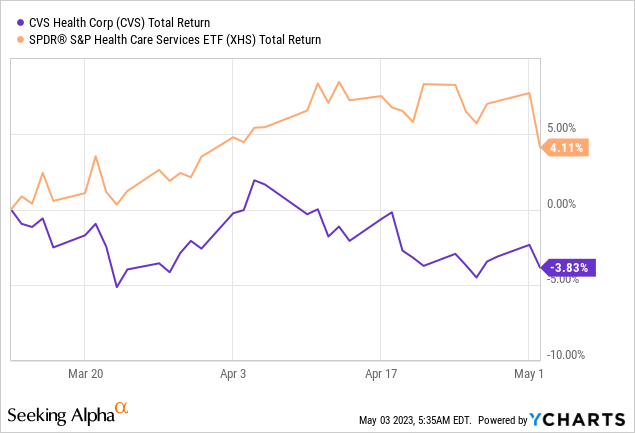
So, let's focus on the company's results, see how my projections fared compared to the consensus, and assess whether I still find the company attractive.
Spoiler alert: I reiterate my Strong Buy rating despite the EPS guidance cut, but that is because it now includes the impact of acquisition-related costs. Actually, looking at the adjusted operating income guidance, we see the guidance was increased, which reflects better-than-expected operational results.
Q1-23 Highlights
There are a lot of highlights to discuss here, so let's begin with the realignment of the company's reported segments. From now on, CVS will report under three new segments - Healthcare Benefits (no change); Health Services, which includes most of the previous businesses of the Pharmacy Services segment, Signify Health, Oak Street Health, and essentially all care delivery solutions; and Pharmacy & Consumer Wellness, which includes the company's retail pharmacies, diagnostic and vaccination services, and the long-term care pharmacy fulfillment services.
CVS Q1-23 Presentation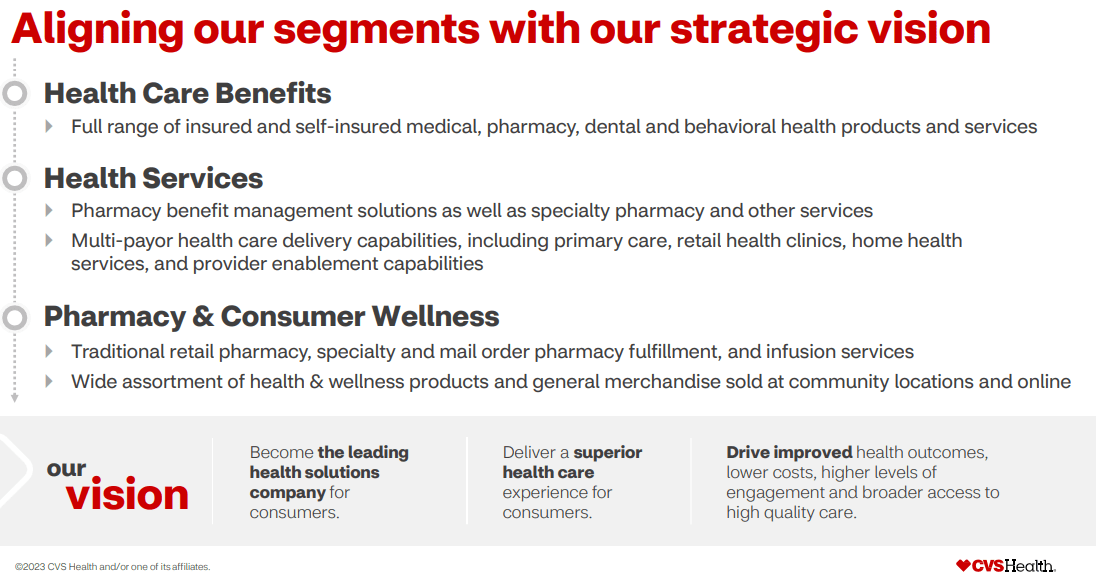
Financial Results
CVS reported consolidated revenues of $85.3B, an 11.0% increase from the prior year period. Based on its historical seasonality, the group is on pace to deliver above 10.0% growth for the entire year. I'm very glad to see the company is on pace to beat my $339.0B sales (5.0% growth) expectation, which means it's on pace to essentially smash the consensus expectations of $334.4B for the year.
Created by the author using data from CVS reports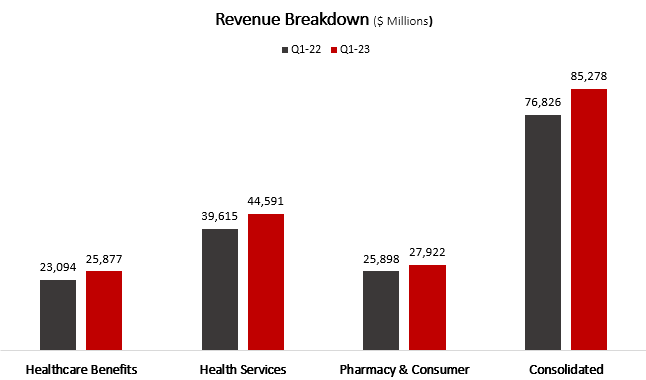
As we can see, growth was broad-based across all segments. Healthcare Benefits revenues grew by 12.0%, Health Services grew by 12.5%, and Pharmacy & Consumer Wellness grew by 7.8%. Despite headwinds from tough Covid-19 comparisons, every segment performed better than expectations.
Created by the author using data from CVS reports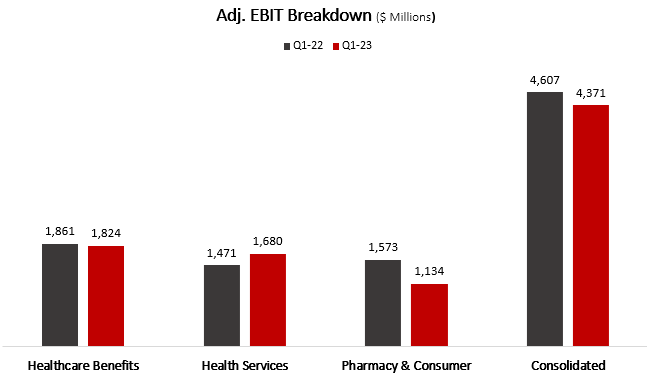
Looking at adjusted EBIT per segment, Healthcare Benefits decreased by 2%, reflecting a 1-point margin decline. Health Services grew by 14.2%, reflecting a 6 bps increase. Pharmacy & Consumer Wellness decreased by 27.9%, as a result of a 2-point margin decrease, primarily due to much lower Covid-19 vaccinations and diagnostics, as well as increased investments. On a consolidated basis, adjusted EBIT decreased by 5.1%.
Created by the author using data from CVS reports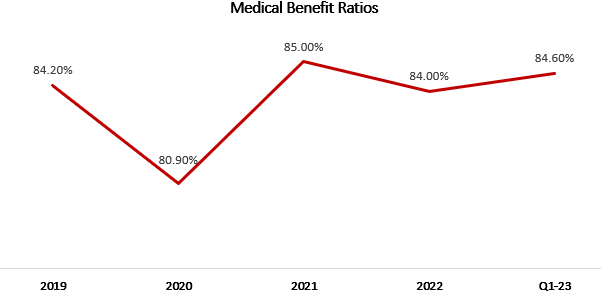
Covering some other notable items, the company's MCR ratio amounted to 84.6%, reflecting a return to normal utilization. Medical members grew to 25.5 million, as contract losses were offset by growth in commercial and individual memberships. Aetna won the City of New York Medicare Advantage Plan contract. Pharmacy claims processed are nearing 600 million and prescription fills surpassed 400 million.
Overall, I find CVS's numbers very impressive, as the company's growth remained above double digits despite very tough comparisons.
Guidance Cut, Is It Really?
The natural response to a guidance cut is usually a selloff. As I'm writing this, the stock is sliding about 3.0%, and because results beat expectations all across, we can assume the selloff is mostly attributable to the guidance cut. So, let's dive deeper into the factors that caused the cut.
CVS Q1-23 Presentation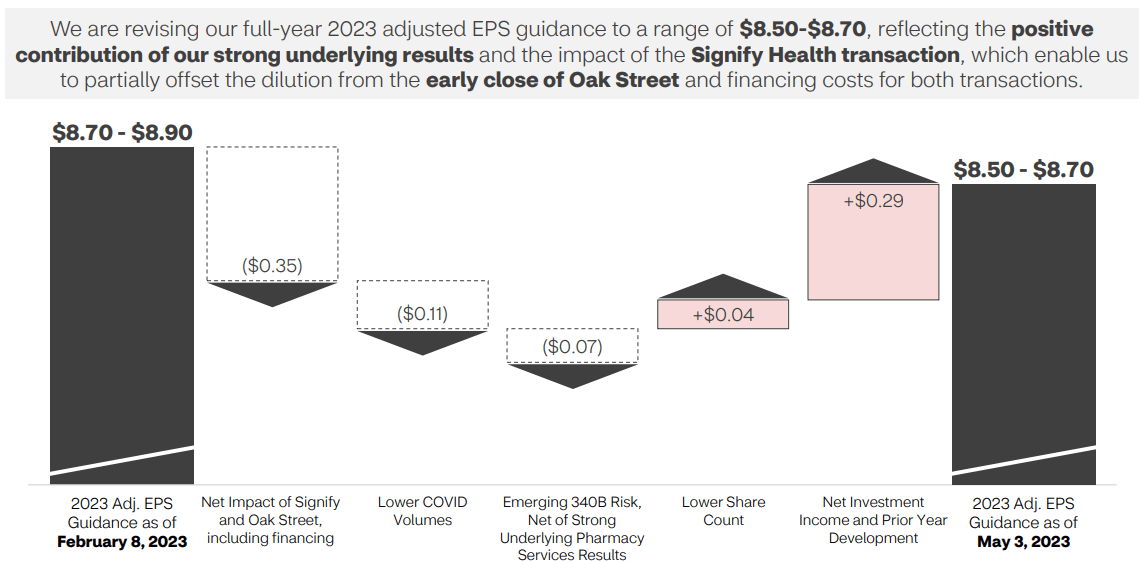
The previous guidance of $8.7-$8.9 Adj. EPS did not include any impact of the acquisitions. Due to the fact both Signify and Oak were previously public companies, we know the former was a profitable standalone company, whereas the latter was unprofitable, in terms of EPS. In addition, CVS elected to raise debt to finance some of the transactions, and by the terms of the loan, CVS starts to pay interest with no grace period. All in all, the cumulative impact of these factors is a negative $0.35 to adjusted EPS.
Additionally, CVS sees lower Covid-19 volumes than what it initially anticipated, as vaccinations and diagnostics dropped sharply. That's another negative $0.11 impact. And, with the emerging risk of the $340B drug program, CVS's PBM operations will cause another negative $0.07 impact.
On the positive side, accelerated buybacks, higher investment income, and higher compensations from CMS for the prior year will result in a total increase of $0.33.
Doing simple math, operationally (excluding the acquisitions), I believe CVS has technically increased its guidance by $0.15.
The Correct Valuation Method
Before going into my financial model, I'd like to dig a little deeper into the unique cash cycle of an insurance company. In my previous article, I described in detail why evaluating such companies based on regular free cash flows could be misleading, as demonstrated by the peculiar 13.6% FCF yield CVS traded at. Basically, insurance customers pay their premiums in advance and on a regular basis. However, the cash expenses on such customers occur at a later stage and theoretically may never occur at all. This is what Warren Buffett refers to as float with his Berkshire insurance businesses.
Let's take a look at CVS's cash conversion cycle:
Created and calculated by the author using data from CVS reports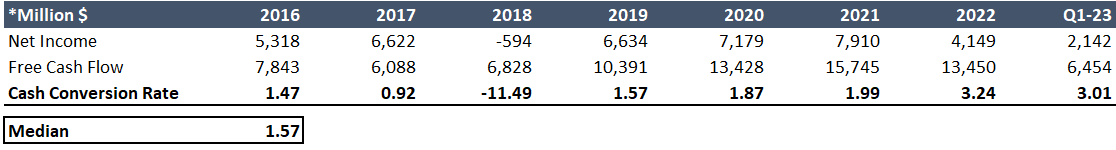
The conversion rate from net income and free cash flow is typically referred to as the cash conversion rate or cash productivity and there are several approaches to its calculation. I calculate it as free cash flow divided by net income. Basically, a cash conversion rate below one means the company is financing its customers, whereas a cash conversion above one means the opposite. Generally, a higher cash conversion rate is better.
As we can see, the median cash conversion rate for CVS between 2016-2023 is 1.57. On the one hand, the company generates a lot of cash and that's a good thing. On the other hand, this is partially due to a timing issue. CVS is regulatory obliged to pay out at least 80.0% of the cash it receives in premiums, and it receives cash from CMS payments in large sums that are well in advance of revenue recognition.
In the previous article, I decided to base my valuation solely on multiples and received many questions about what tweaks I make to my DCF model in order to normalize the company's cash flows. So, I'll explain. All I do is calculate normalized free cash flows based on the following accounts: Net Income + Depreciation & Amortization - Capex. In essence, I replace the operating cash flow metric with net income, as net income reflects only income received for services and products that were already provided.
Now, enough with accounting, let's talk about CVS's valuation.
Valuation
I used a discounted cash flow methodology to evaluate CVS's fair value. I project CVS will grow revenues at a 3.7% CAGR between 2023-2028, which is according to the company's long-term guidance. I believe revenues will grow at this pace due to the company's ability to keep or grow its market share, as well as increased growth in its customer base as it expands its care delivery operations to new geographies.
I project normalized FCF margins to remain steady at around 2.9% as the company's higher profitability from new synergies will be partially offset by lower margins in its PBM businesses, which are subject to increased scrutiny.
Created and calculated by the author based on data from CVS financial reports and the author's projections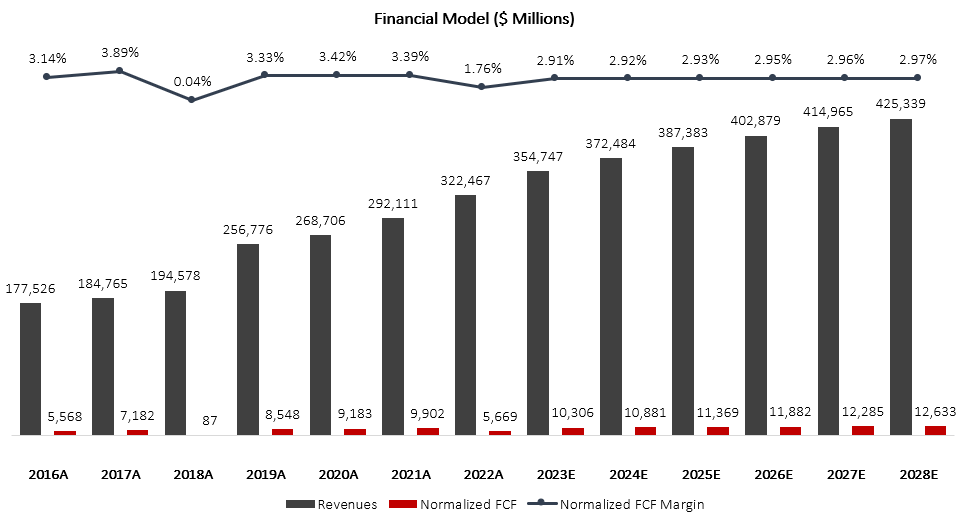
Taking a WACC of 9.4%, I estimate CVS's fair value at $95.7 per share, which represents a 35.8% upside compared to its market value at the time of writing. This valuation represents a 13.4 forward P/E multiple, which is below the company's 5-year average.
Multiple-Based Valuation
For the purpose of continuity, I want to provide a valuation based on an exit P/E multiple, the same methodology I used in my previous article.
For 2025, I expect $10.0 Adj. EPS, which is according to the management's reaffirmed guidance. The company currently trades at an 8.2 multiple based on the mid-point of its 2023 guidance, however, its 5-year average multiple is at 10.0.
Created and calculated by the author based on the company's guidance and the author's projections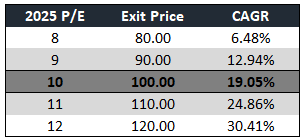
Based on the market price at the time of writing, I estimate investors can expect a 19.0% CAGR, excluding dividends, for the next two years.
Near-Term Projections
In the near term, I find the consensus estimates way off. For some reason, analysts refuse to understand CVS is not the old pharmacy retailer which grows at a low single-digit pace.
For Q2-23, I expect revenues to total $87.3B, compared to the consensus of $83.7B. Regarding Adj. EPS, my expectation is below the consensus, at $2.2. For the full year, I expect total revenues of $354.8B, and Adj. EPS of $8.9, which is above the high-end of the company's guidance and above the consensus of $8.75.
This is in line with what management said on the call, regarding the progression of earnings through the year:
I also want to provide an update on the progression of earnings for the year. Due to the strength of our results in the first quarter, the incorporation of Signify and Oak Street and the $340B headwind, we now expect second half 2023 earnings to be slightly more than 50% of the full year results with the third quarter modestly higher than the fourth quarter. We also want to highlight our expectations for quarterly MBRs. We continue to expect the year-on-year increases in MBR to be higher in the first half than the second half. This dynamic is due to COVID-driven lower utilization trends in the first half of 2022. We expect the MBR progression in the second quarter of this year to look similar to the trend in the first quarter.
--- Shawn M. Guertin, EVP and CFO, Q1-23 Earnings Call
Conclusion
Right now, we need to focus on execution of the assets that we just acquired, and bring our products and services to bear fruit for our customers.
--- Karen S. Lynch - President and CEO, Q1-23 Earnings Call
CVS is impressively progressing toward fulfilling its long-term strategy to become a complete healthcare services company. A lot of the unknowns regarding the future of the company are already answered. The next upcoming years are going to be crucial for CVS, however, the current price of the stock reflects very low expectations; and as the stock is trading 17.2% below its average valuation, at an 8.3 forward P/E, it is growing at an impressive high single-digit pace.
I estimate there's a lot of upside for long-term investors, which will come from three components: steady deleveraging, margin expansion, and steady revenue growth. As the company delivers on those, patient investors should expect a significant multiple expansion, to further enhance value. Thus, I reiterate a Strong Buy rating.
This article was written by

Analyst’s Disclosure: I/we have a beneficial long position in the shares of CVS either through stock ownership, options, or other derivatives. I wrote this article myself, and it expresses my own opinions. I am not receiving compensation for it (other than from Seeking Alpha). I have no business relationship with any company whose stock is mentioned in this article.
Seeking Alpha's Disclosure: Past performance is no guarantee of future results. No recommendation or advice is being given as to whether any investment is suitable for a particular investor. Any views or opinions expressed above may not reflect those of Seeking Alpha as a whole. Seeking Alpha is not a licensed securities dealer, broker or US investment adviser or investment bank. Our analysts are third party authors that include both professional investors and individual investors who may not be licensed or certified by any institute or regulatory body.