COMB: Cheap But Inefficient

Summary
- COMB is a cheap option among its competitors for getting exposure to commodity prices.
- Because it has failed to outperform its benchmark and there are many better options, I wouldn't consider it right now.
- In this article, I will show you those alternatives and explain how they're superior.
Epiximages
Thesis
GraniteShares Bloomberg Commodity Broad Strategy No K-1 ETF (NYSEARCA:COMB) is a cheap option among actively managed commodity ETFs. However, because of its inability to outperform its benchmark and because there are so many better alternatives out there, I think an investor would do well to pass. Whether you're looking for low correlation, low volatility, superior returns, or attractive risk-adjusted returns, in this article I will show you which I think are the best bets for such purposes.
What does COMB do?
COMB is an actively managed commodity ETF issued by GraniteShares Inc. on May 22, 2017 and is managed by GraniteShares Advisors LLC. It currently manages $150.94 million.
The fund's goal is to provide returns that are superior to the price changes of the Bloomberg Commodity Index, which consists of 23 futures contracts on 21 commodities, some of which are coffee, gold, copper, cotton, aluminum, corn, and crude oil. Currently, the fund's biggest positions are in futures on gold, WTI crude oil, and Brent crude oil. The index weights its components based on liquidity, world production, and diversification rules.
Performance
As COMB aims to beat a benchmark, we first need to see how it performed against it. Since it was launched, the fund returned 4.84% per year based on its market price. The benchmark's price changed by 5.31% per year. So, it failed to achieve its goal.
But let us also see how the ETF fared against actively managed competitors for a clearer idea of its performance:
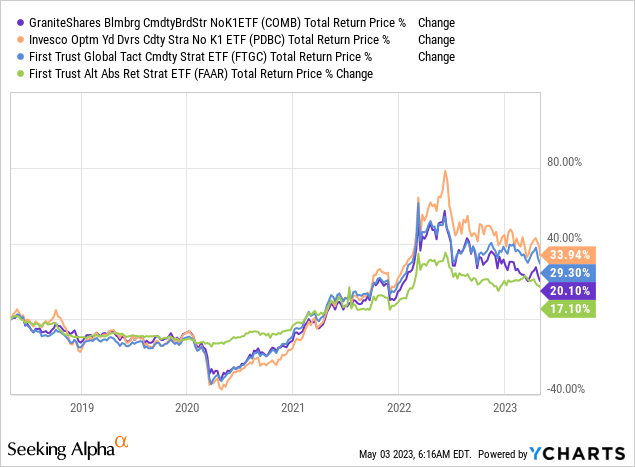
As you can see, its returns were average in the last 5 years. It only outperformed the First Trust Alternative Absolute Return Strategy ETF (FAAR) by an insignificant margin and underperformed two ETFs by a more noticeable margin. However, I was also interested to see what COMB's risk profile looks like as compared to the above competitors:
| Ticker | Maximum Drawdown | Standard Deviation Annualized | Correlation (SPY) | Beta (SPY) | Sharpe |
| COMB | -30.79% | 15.97% | 0.52 | 0.44 | 0.24 |
| PDBC | -37.58% | 19.13% | 0.52 | 0.52 | 0.35 |
| FTGC | -33.07% | 15.23% | 0.56 | 0.45 | 0.34 |
| FAAR | -13.83% | 8.83% | 0.22 | 0.1 | 0.2 |
Source: portfoliovisualizer.com (5/2/2018-5/2/2023)
The fund performed with a low annualized standard deviation in the last 5 years. However, FTGC delivered its superior returns with low volatility as well, realizing a higher Sharpe ratio. And if you place more emphasis on low correlation and volatility than returns, FAAR is the most competitive here. This is why I cannot see any reason to select COMB over other commodity funds.
If we broaden the search to passively managed competitors, we will find more alternatives too:
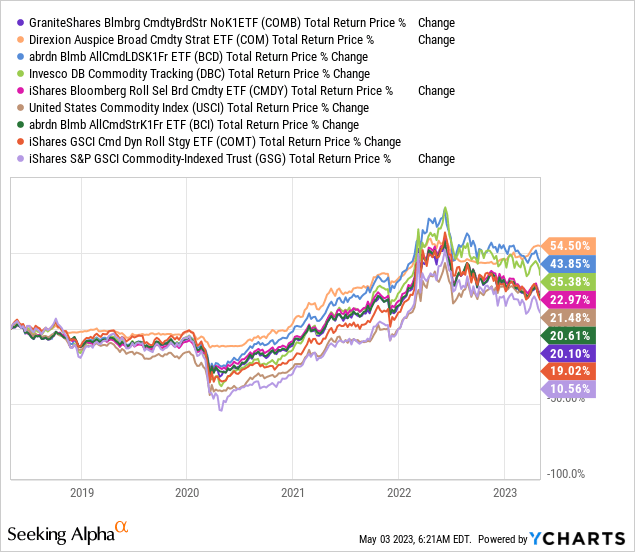
As you can see, three ETFs did much better than COMB, with Direxion Auspice Broad Commodity Strategy ETF (COM) standing out, having grown by a total of 54.5% in the last 5 years. Some risk statistics during this period also show that there are better alternatives when it comes to risk-adjusted returns too, with COM having the best record:
| Ticker | Maximum Drawdown | Standard Deviation Annualized | Correlation (SPY) | Beta (SPY) | Sharpe |
| COMB | -30.79% | 15.97% | 0.52 | 0.44 | 0.24 |
| COM | -15.06% | 9.85% | 0.38 | 0.2 | 0.78 |
| BCD | -26.11% | 14.86% | 0.52 | 0.41 | 0.48 |
| DBC | -37.77% | 19.31% | 0.53 | 0.54 | 0.36 |
| CMDY | -28.05% | 14.41% | 0.5 | 0.38 | 0.28 |
| USCI | -42.71% | 18.02% | 0.45 | 0.43 | 0.24 |
| BCI | -30.49% | 15.72% | 0.52 | 0.43 | 0.25 |
| COMT | -36.02% | 18.80% | 0.54 | 0.54 | 0.23 |
| GSG | -53.18% | 25.44% | 0.5 | 0.66 | 0.18 |
Source: portfoliovisualizer.com (5/2/2018-5/2/2023)
And if you're interested in allocating to commodities for the long term, ETNs (Exchange-Traded Notes) are a good area to look at as well. In this case, most of the well-known ETNs have outperformed COMB:
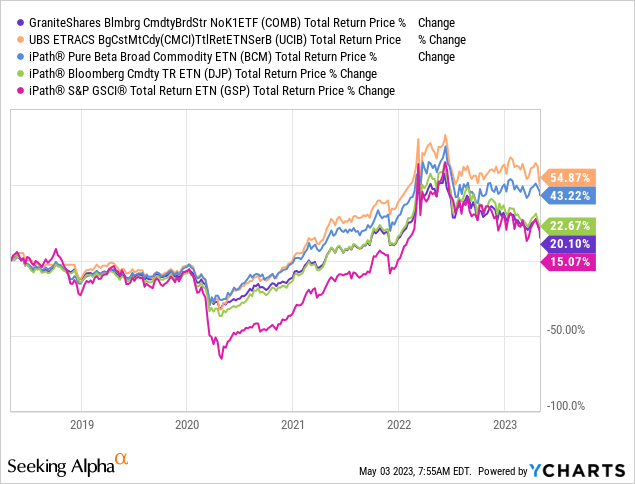
UCIB and BCM (the latter which I recently covered) have delivered much greater returns than COMB in the last 5 years. Their risk-adjusted returns are also more attractive:
| Ticker | Maximum Drawdown | Standard Deviation Annualized | Correlation (SPY) | Beta (SPY) | Sharpe |
| COMB | -30.79% | 15.97% | 0.52 | 0.44 | 0.24 |
| UCIB | -34.19% | 16.93% | 0.49 | 0.44 | 0.52 |
| BCM | -27.77% | 16.14% | 0.52 | 0.45 | 0.45 |
| DJP | -36.18% | 18.47% | 0.52 | 0.51 | 0.26 |
| GSP | -62.20% | 31.93% | 0.51 | 0.84 | 0.24 |
Source: portfoliovisualizer.com (5/3/2018-5/3/2023)
Fees
| Ticker | Expense Ratio | AUM | Inception Date |
| COMB | 0.25% | $150.94M | 05/22/2017 |
| PDBC | 0.59% | $5.18B | 11/07/2014 |
| FTGC | 0.95% | $2.97B | 10/21/2013 |
| FAAR | 0.95% | $190.38M | 05/18/2016 |
Surprisingly, COMB's expense ratio is 0.25% which is very low both on a relative and absolute basis because of its nature as an actively managed fund. However, we must also view its fees within the context of its efficiency if we want to assess its cost-effectiveness. Because it has failed to outperform its benchmark and there are actively managed funds that did better than it, I would say that its fees are nothing more than fair.
Risks
- Counterparty Risk: The fund is subject to counterparty risk as it's exposed indirectly to commodities through the use of futures contracts.
- Commodity Risk: The fund is also exposed to commodity risk because the value of the futures it trades is affected by commodity price changes.
- Credit Risk: Since the ETF also invests in various fixed-income securities, it carries credit risk too.
Verdict
COMB has a very low expense ratio for a small actively managed fund, but because there is a good number of better alternatives, I wouldn't consider it right now. But most importantly, it has failed to outperform its benchmark (though it hasn't underperformed it by much). I am always open to the idea that a fund may have other attractive attributes that I could have overlooked, such as trading volume. But COMB lacks even from this aspect on a relative basis.
If you think differently, perhaps you could let me know below. And please, leave a comment if this article helped you; feedback is also appreciated. Thank you for taking the time to read this.
This article was written by

Analyst’s Disclosure: I/we have no stock, option or similar derivative position in any of the companies mentioned, and no plans to initiate any such positions within the next 72 hours. I wrote this article myself, and it expresses my own opinions. I am not receiving compensation for it (other than from Seeking Alpha). I have no business relationship with any company whose stock is mentioned in this article.
Seeking Alpha's Disclosure: Past performance is no guarantee of future results. No recommendation or advice is being given as to whether any investment is suitable for a particular investor. Any views or opinions expressed above may not reflect those of Seeking Alpha as a whole. Seeking Alpha is not a licensed securities dealer, broker or US investment adviser or investment bank. Our analysts are third party authors that include both professional investors and individual investors who may not be licensed or certified by any institute or regulatory body.