Avantis Emerging Markets Value ETF May Be Heavily Undervalued

Summary
- As value spreads have reached all-time highs due to investors over-extrapolating growth, value stocks look extremely attractive.
- This is especially the case in emerging markets, where value is even cheaper, suggesting high expected returns for a combined emerging markets value strategy.
- Style factors remain uncorrelated in emerging markets, indicating useful diversification for a factor-tilted strategy.
- The Avantis Emerging Markets Value ETF is the most effective way to gain exposure to this distinctly undervalued asset class due to its unique evidence-based approach to value investing.
- We recommend investors hold or buy AVES if they wish to participate in the comeback of both value and emerging markets while they still can.
AsianDream/iStock via Getty Images
Executive Summary
As value spreads have reached all-time highs due to investors over-extrapolating growth, value stocks are looking extremely attractive. This is especially the case in emerging markets, where value is even cheaper. Along with emerging markets being undervalued in general, the evidence suggests that emerging markets value is trading cheaper than any other equity market. The Avantis Emerging Markets Value ETF (NYSEARCA:AVES) is the most effective way to gain exposure to this distinctly undervalued asset class, as its evidence-based approach to value investing is expected to deliver a significant net premium over the market, provide useful diversification, and profit from numerous other sources of return. Investors are recommended to hold AVES if they wish to participate in the comeback of both value and emerging markets, while they still can.
Introduction
AVES is a relatively new fund launched by Avantis Investors that invests in a set of companies across emerging markets countries and focuses on firms trading at lower valuations with higher profitability ratios. Both emerging markets and value strategies have experienced relative underperformance over the past decade which has led to a divide among investors. Some believe that these strategies are no longer profitable, while others believe that they are now undervalued. To evaluate AVES, I will first establish the current state of both value and emerging markets strategies in general, before turning to Avantis' unique approach to an emerging markets value strategy that integrates strategies from the current and historical literature. Next, I will forecast the fund's expected return and compare it with the cap-weighted index as well as competing funds. Finally, I'll model the correlations between its targeted risk factors before highlighting some potential risks.
The Current Attractiveness of Value
Value stocks, which are stocks with a lower price relative to fundamentals, have historically outperformed their more expensive counterparts in the long run. This is true regardless of how value is defined, whether it be by book-to-price, trailing earnings to price, trailing cash flows to price, or trailing dividends to price (Beck et al., 2016). Furthermore, the long-term outperformance of the value factor has been pervasive across geographical regions and markets. Funnily enough, value has even outperformed in the LEGO market (Shanaev et al., 2020)!
However, value has clearly underperformed for many years, and some investors have lost faith in it, even declaring it "dead." I argue that this sentiment is misguided, and that not only is value far from dead, but it is also poised for a massive comeback.
For one, the underperformance of value is not evidence against its legitimacy. Any strategy with excess returns will have some periods of underperformance. Otherwise, there would be no risk. In fact, there have been three periods of at least 13 years where the S&P 500 underperformed one-month Treasury bills (Swedroe, 2021). If one had given up on the S&P 500 during these periods, they would have missed out on great long-term returns. With this put into perspective, a period of underperformance is no reason to dismiss value, just as it was no reason to dismiss market beta. The long-term outperformance of value as well as its robustness across out-of-sample data is still reason to expect value strategies to be profitable.
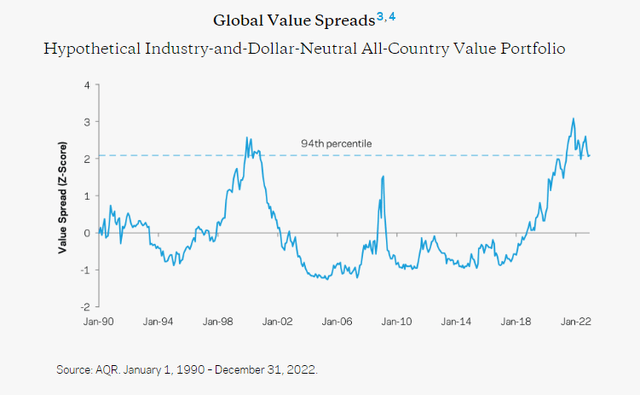
Not only that, but value looks especially promising right now; perhaps more so than ever before. This can be viewed through value spreads, which measure the difference in valuation multiples between cheap and expensive stocks within industry. In other words, they measure the cheapness of value stocks. Currently, value spreads are at all-time highs, similar to what we saw around the tech bubble that led to an amazing period for value stocks. The chart below shows that the value spread at the end of 2022 was at the 94th percentile.
Figure 1
Depiction of Global Value Spreads
One might ask if this massive cheapening of value is justified by fundamentals -if expensive companies simply outgrew cheap companies by a large margin. However, as Asness (2021) showed, this is not the case, as the underperformance of value was merely caused by changes in the value spread. By regressing the annual value factor return on annual value spread changes and a dummy variable, he found that the disappointing performance of value was explained by valuation spreads widening, and adjusting for that actually resulted in positive recent performance of value in line with its historical premium. As he put it, "investors are simply paying much more for the same fundamentals." Prior to this, Arnott et al. (2019) found a similar result by performing a return decomposition to demonstrate that "changes in the valuation spread between the growth and value portfolios explain the entire drawdown, with room to spare." Therefore, the evidence suggests that investors have over-extrapolated growth and created a bubble. If one believes that value will underperform in the future, they are essentially banking on value spreads forever widening and are betting on the growth bubble never popping, which is not a safe bet.
Now, let's look at the evidence about if value spreads provide information on forward-looking expected returns. Souza (2018) found that book-to-market spreads have significant predictive content for the value premium. This was supported by Zaremba and Umutlu (2019), who found that "the value spread is a powerful and robust predictor of strategy returns in the cross-section, subsuming other methods based on momentum, reversal, or seasonality." Furthermore, they demonstrated that going long (short) the strategies with the broadest (narrowest) value spreads produces significant four-factor model alphas, with the results being robust to many considerations. These findings are consistent with those of Yara et al. (2020), which showed that "returns to value strategies in individual equities, industries, commodities, currencies, global government bonds, and global stock indexes are predictable in the time series by their respective value spreads."
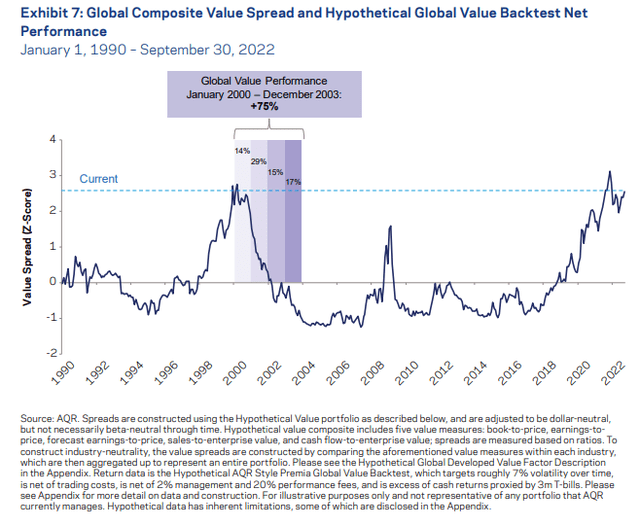
As an analogy, we can look at what followed the last time value spreads were this high, around the tech bubble. The following chart shows that as the value spread compressed in the early 2000's, value outperformed for multiple years, with a cumulative outperformance of 75% over 4 years.
Figure 2
Depiction of Global Value Spreads and Hypothetical Backtested Net Performance
In conjunction with the fact that value spreads are currently at extreme levels, the evidence points to exceptionally attractive future expected returns for value stocks. This highlights a great opportunity to tilt toward a value strategy and is a warning for those thinking about betting against value.
Emerging Markets
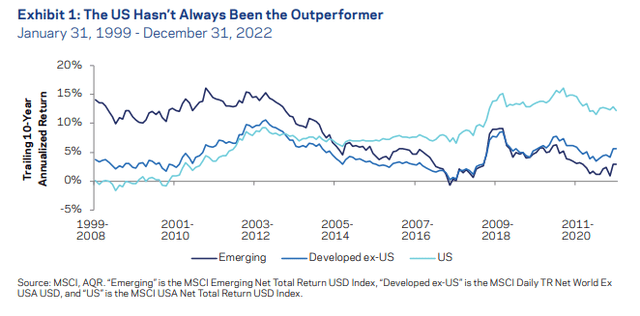
Investors in emerging markets equities should expect to receive higher returns, higher risk, and a diversification benefit. While emerging markets did deliver higher returns at the start of the century, they have disappointed over the past decade.
Figure 3
Comparison of Trailing 10-Year Annualized Return by Region
But just as with value, a recent period of underperformance does not imply future underperformance. To roughly compare forward-looking expected returns, we can run a simple earnings-based and payout-based analysis.
The first approach is the inverse of the cyclically-adjusted price-to-earnings (CAPE) ratio, which is the 10-year real earnings divided by the current price. This metric uses a more reliable estimate of sustainable earnings than simple price-to-earnings as it accounts for the cyclicality of annual earnings. It was introduced by Campbell and Shiller (1988) who showed that "a long moving average of real earnings helps to forecast future real dividends." Several studies have demonstrated that CAPE predicts country returns. Faber (2012) created a trading system to build global stock portfolios based on CAPE and found that an equal-weighted portfolio of countries with the lowest CAPE produced an average annual return of 13.5% from 1980-2011 compared to a portfolio of the most expensive countries which delivered a return of only 4.3%. Klement (2012) also found that CAPE can predict returns within a 5-to-10-year horizon. The predictive power of CAPE was further confirmed by Angelini et al. (2012), Novotny and Gupta (2015), Keimling (2016), and Ilmanen et al. (2019).
The second approach is the classic dividend discount model (DDM), where the expected real return is approximately the sum of the dividend yield (DY), expected divided or earnings per share growth, and expected change in valuations. Evidence shows that yield-based approaches have some ability to predict future returns (Ilmanen, 2022). For our purposes, we won't assume that multiple expansion will repeat. Furthermore, Dimson, Marsh, and Staunton (2006) decomposed the equity premium from 1900-2005 and demonstrated that the dividend yield is the main driver of long-term returns. So, the DDM equation is: E(r) = DY + g.
The following table compares the expected returns of U.S., developed, ex U.S. developed, and emerging markets equities based on the Shiller EP and DDM. We can take an average of these two approaches to serve as a rough estimate of each region's expected return.
Figure 4
Annual Expected Returns by Region (%)
Shiller EP (1/CAPE) | DDM (DY + g) | Combined | |||
U.S. | 3.7 | 3.2 | 3.5 | ||
Developed | 4.1 | 3.6 | 3.9 | ||
Ex U.S. Developed | 5 | 4.9 | 5 | ||
Emerging Markets | 7.5 | 5.4 | 6.5 |
Note. Data from Bloomberg (adapted from AQR, 2023). Based on data as of December 31, 2022. U.S. yield is based on S&P 500 and emerging markets on MSCI Emerging Markets Index. "Developed" is a cap-weighted average of developed markets. Following AQR, growth rate for U.S. and developed markets is 1.5% and a higher growth rate of 2% is used for emerging markets.
As you can see, emerging markets have a higher expected return than any other region. Most of it is due to the region's low CAPE, indicating attractive valuations of emerging markets countries. Of course, the expected return of an asset is just the weighted average of possible outcomes, and there is always a wide dispersion of potential outcomes for equities. There is no way to know ex-post returns. The point is not to focus on exact values but rather to demonstrate that emerging markets have comparatively higher forward-looking expected returns. While these models are relatively basic for illustrative purposes, modified approaches yield the same results (AQR, 2023; Research Affiliates, 2023).
Historically, the main drawback of investing in emerging markets has been their higher risk relative to developed markets. But as markets are becoming increasingly integrated, the risk profile of emerging markets appears to be going down. For example, Aghassi and Villalon (2023) examined returns from 1999 to December of 2022 and found that the volatility of emerging markets has come in line with that of developed markets. Furthermore, the correlation between the two groups dropped from 0.87 in the first half of the sample to 0.77 over the second half. As Harry Markowitz (1952) showed, the rational investor shouldn't view an investment's risk by itself but rather by its contribution to overall portfolio risk. Even if emerging markets happen to be more volatile in the future, their imperfect correlation will provide a diversification benefit and mitigate some portfolio risk. This suggests that a healthy emerging markets allocation is suitable even for risk-averse investors.
Lower correlations also imply a higher "diversification return" which Booth and Fama (1992) defined as the difference between the expected geometric mean (time-weighted rate of return) of a portfolio and the weighted average of the expected geometric means of its component assets. The geometric mean of an asset is often lower than its arithmetic mean due to its variance: this phenomenon is known as "variance drag." By diversifying, variance drag is reduced, and the geometric mean is therefore increased.
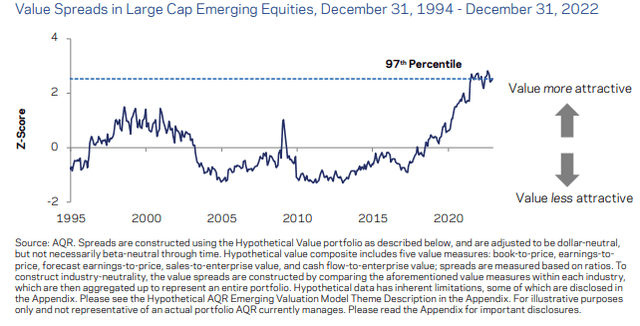
On top of higher expected returns and significant diversification, value strategies appear especially undervalued in emerging markets. As mentioned previously, extreme value spreads represent a promising future for value strategies worldwide. But in emerging markets, the value spread is even wider at 97th percentile, compared to 92nd percentile for global developed.
Figure 5
Depiction of Emerging Markets Value Spread
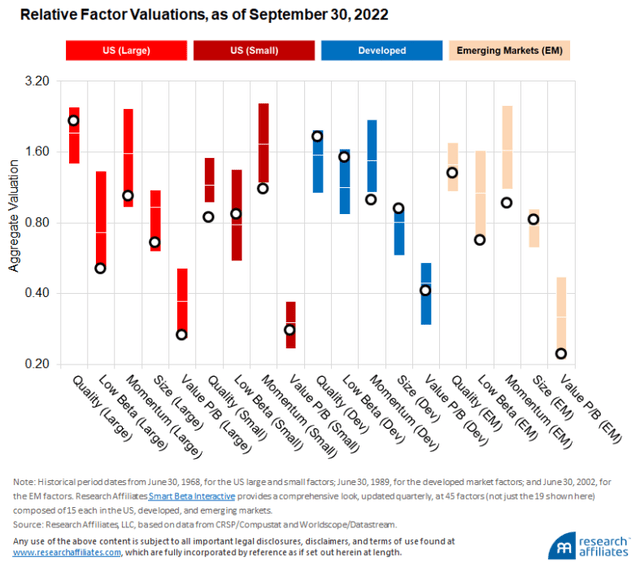
A low valuation for emerging markets value is further supported by Robert Arnott and Amie Ko of Research Affiliates (2023), who examined the value spreads of 5 different factors from 1968-2022 in 4 different market segments by using a composite value metric of: price-to-book, price-to-cash flow, price-to-dividends, and price-to-sales. They then plotted current valuations of each of these factors against their historical norms, represented in the chart below. The top and bottom of the bars indicate the 10th and 90th percentiles, respectively, of the historical relative valuation for each factor, with a white dash indicating the prior median relative valuation. Emerging markets value is represented by the rightmost bar. The chart shows that value in emerging markets is trading at historically cheap levels.
Figure 6
Depiction of Relative Factor Valuations
AVES
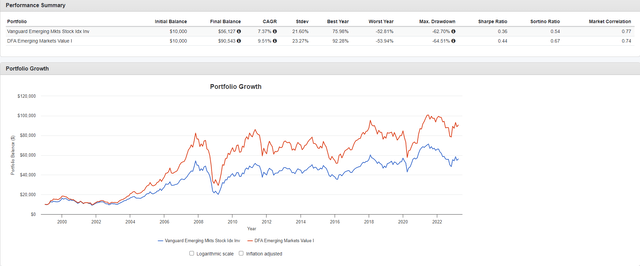
Both value and emerging markets strategies are currently undervalued and have high relative expected returns. The combination of the two looks particularly attractive, as the cheapness of value is most pronounced in emerging markets. An emerging markets value strategy would also provide a significant diversification benefit and improve many portfolios. Unfortunately, there haven't been many widely accessible funds that invest in this promising asset class. The only fund with a long track record is Dimensional's Emerging Markets Value Portfolio (I) (DFEVX). As expected, DFEVX has significantly outperformed the cap-weighted emerging markets index, with higher absolute returns and risk-adjusted returns when measured by either Sharpe ratio (excess returns divided by standard deviation of excess returns) or Sortino ratio (excess returns divided by standard deviation of the downside). The following compares the growth of $10,000 invested in DFEVX from 1999-2023 with the growth of the cap-weighted index, represented by Vanguard Emerging Markets Stock Index Fund Investor Shares (VEIEX).
Figure 7
Growth of $10,000 in DFEVX and VEIEX
However, Dimensional funds are only available to institutional investors and clients of select independent financial advisors. As a result, most investors have not been able to participate in Dimensional's success. But in 2019, members of Dimensional established Avantis Investors, which offers factor-tilted funds based on an investment philosophy that is like Dimensional's. In September of 2021, they launched AVES, which invests in a broad set of companies of all market capitalizations across emerging markets countries and focuses on firms trading at lower valuations with higher profitability ratios. While being most comparable to DFEVX, there are some notable differences that separate the two, both in terms of fund construction and investment philosophy. Perhaps the most obvious distinction is Avantis' use of a joint value and profitability metric.
Book-to-market has been the gold standard value metric since Fama and French (1992) defined it as such. Historically, book value has been a good proxy of company fundamentals, as most of a company's value was driven by assets contained in the balance sheet. In recent years, there's been concern that book value is no longer a good measure of fundamentals, since intangibles have become an increasingly large portion of many companies' valuable "assets." This concern is supported by Choi et al. (2021) who found that book-to-market has "increasingly detached from alternative valuation ratios while becoming worse at forecasting returns and growth in an absolute and relative sense." As it seems, the ideal value metric needs to account for things that don't have a book value.
This is where the profitability component of Avantis' joint metric comes into play. While simple book value doesn't show the whole story, supplementing it with profitability paints a more complete picture. Screening for profitability gives you information about whether a company is trading cheap because it actually has a higher discount rate or if it's simply not profitable. Using just book value ignores the importance of the income statement.
We can analyze the effectiveness of combining value and profitability in emerging markets by comparing the returns of four emerging markets portfolios formed on book-to-market (BM) and operating profitability (OP), documented by Kenneth French. The BM and OP breakpoints in a country are their 50% percentile for all the eligible stocks of the country. Independent 2x2 sorts on BM and OP produce four value-weight portfolios, Low BM Low OP, Low BM High OP, High BM Low OP, and High BM High OP. The mean returns, standard deviation of returns (σ) and risk-adjusted returns measured by Sharpe ratio (excess returns divided by standard deviation of excess returns) of all four portfolios and the cap-weighted emerging markets portfolio (MKT) are shown below. The risk-free rate is the one-month T-bill rate.
Figure 8
Performance of Four Emerging Markets Portfolios Formed on Book-to-market (BM) and Operating Profitability (OP) and the Cap-weighted Portfolio (MKT) (%)
Low BM Low OP | Low BM High OP | High BM Low OP | High BM High OP | MKT | |
Mean | 9.2 | 14 | 23.9 | 24.6 | 9.4 |
σ | 36 | 33.8 | 38.5 | 37.6 | 32.6 |
Sharpe Ratio | 0.19 | 0.34 | 0.56 | 0.59 | 0.22 |
Note. Data from Kenneth French's data library. Annual data from 1992 to 2022.
Value seems to be the main driver of the difference in returns between these portfolios, as the high BM low OP portfolio significantly outperformed the low BM low OP portfolio. Yet, there was still improvement by adding profitability to the high BM portfolio, both in terms of higher returns and lower volatility. Of the five, the low BM low OP portfolio performed the worst by far. The cap-weighted portfolio didn't do much better. Despite the three factor-tilted portfolios being more volatile than the market, they all had higher absolute and risk-adjusted returns. While the Sharpe ratio is likely an imperfect measurement, it remains a reasonable proxy for risk-adjusted returns due to its convenience and transferability.
The extremely high outperformance of the high BM high OP portfolio over the market is compelling enough, but further improvements on a high BM high OP portfolio can be made by utilizing a better metric for profitability. Following Ball's research (2016), Avantis uses cash-based profitability since it excludes accruals, the non-cash component of earnings. This contrasts with Dimensional's approach which uses operating profitability. Sloan (1996) originally documented a robust negative correlation between accruals and the cross section of expected returns. Ball found that, since cash-based profitability is devoid of accounting accruals adjustments, it better explains the cross section of expected returns than gross profitability, operating profitability, and net income. In fact, the cash-based profitability factor delivered a higher average annualized premium (4.88% versus 3.25%) and t-value (6.29 versus 3.65) than the operating profitability factor. Due to the load AVES places on profitability, if even a fraction of this 163 basis point outperformance persists in the future, investors will be able to significantly profit from this relative premium.
Perhaps the best synergy between value and profitability strategies is their negative correlation demonstrated in Noxy-Marx's (2013) seminal paper on profitability. This is due to more profitable firms typically being growth stocks, whereas value stocks tend to be unprofitable. In effect, the two factors end up being great hedges for each other.
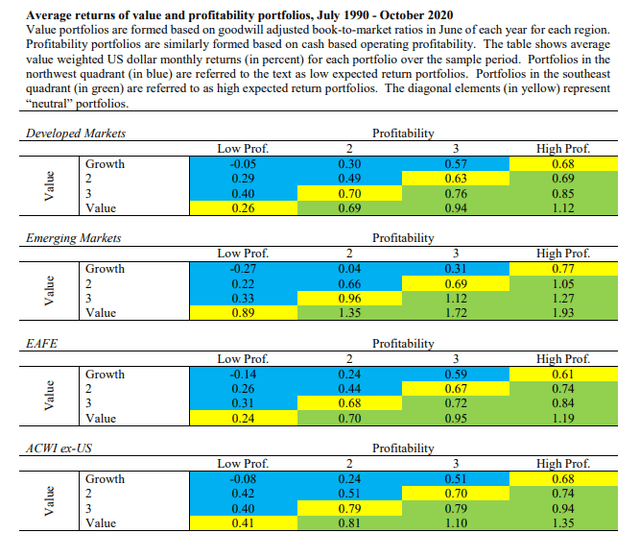
Wahal and Repetto (2020) backtested Avantis' joint value and profitability metric and found that it performed exceptionally well over the 30-year period 1990-2020 and across multiple regions, but it performed the best in emerging markets by a wide margin. Their findings are shown in the table below.
Figure 9
Monthly Returns of Value and Profitability Portfolios
Granted, back tests are inherently flawed, and we can't guarantee the future, but the extent that the metric has been successful for 30 years combined with our prior evidence indicating high relative returns in emerging markets value plus profitability is certainly a piece of evidence that points to the underlying strategy's forward-looking success.
It's important to note that Avantis' value metric is adjusted for goodwill: the premium an acquiring company pays beyond the market price of the target company. Per Wahal and Repetto (2020), goodwill balances accounted for nearly 40% of aggregate book equity for U.S. listed companies by the end of 2019. The theory behind removing goodwill is that regarding companies involved in mergers & acquisitions (M&A), the discounted value of the profits of an acquired company should not be treated differently than the future profits of the acquiring company. If this is the case, then some companies involved in M&A would be mistakenly identified as value since their book values are driven up by goodwill. Wahal and Repetto looked at the returns of a goodwill-adjusted value portfolio and a non-adjusted value portfolio over the 30-year period 1989-2019 and found that removing goodwill resulted in an extra monthly return of 2.7 bp.
While not explicitly targeted, Avantis performs screens for both the investment and momentum factors. Titman, Wei, and Xie (2004) demonstrated that high investment (high asset growth) companies tend to underperform low investment companies. This is likely due to companies becoming more aggressive when their discount rates are low, leading to poor future performance. Fama and French (2014) have even adopted the investment factor in their five factor model, noting that small companies with low book-to-market, low profitability, and high investment have significantly underperformed. By excluding these stocks, AVES is expected to increase its long-term return.
Momentum is well-established as arguably the strongest performing factor by many empirical tests (Berger et al., 2009). AVES doesn't target momentum explicitly, likely due to multiple reasons such as the lack of a risk-based explanation for the factor, but it wisely tries to avoid betting against it. By delaying the purchase (sale) of stocks with large negative (positive) 6-month returns, AVES can implicitly trade momentum without having to deal with the high transaction costs incurred by explicitly targeting momentum due to the inherent high turnover nature of momentum strategies.
To summarize the approach, AVES is based on a scientific methodology that invests in different sources of excess return. Using a goodwill-adjusted value metric combined with cash-based profitability is in line with the current and historical evidence as an effective way to capture both the profitability premium and the especially attractive expected value premium. Negative screens for investment and momentum factors ensure that investors don't suffer from a bet against them. For more information on Avantis' methodology, see the document by McInnis and Ong (2021).
Some passive investors might be put off by the apparent active management in the fund. While it is true that active managers tend to underperform a passive strategy, AVES is not a traditional actively managed fund. Its methodology is entirely rule-based, and there is no individual stock picking or reliance on manager skill in such a way. These systematic rule-based strategies have consistently been found to be profitable when designed correctly, as much of the previously mentioned evidence has shown. Multiple decades of real-world success by Dimensional has also shown the viability of such strategies. If an investor is still uncomfortable with deviating from a strictly passive index, then they shouldn't do so. At the end of the day, it's important to invest in something that you're comfortable with and can stick to.
It is always important to consider fees when evaluating funds. The current expense ratio of AVES is 36 bp, which is higher than that of a cap-weighted index. That would not be an apples-to-apples comparison, though, since AVES is a systematic strategy that focuses on assets with higher expected returns. When compared to similar funds such as DFEVX (44 bp), the recent Dimensional Emerging Markets Value ETF (DFEV) (43 bp), Schwab Fundamental Emerging Markets Large Company Index ETF (FNDE) (39 bp), and WisdomTree Emerging Markets SmallCap Dividend Fund (DGS) (58 bp), AVES is cheaper. Additionally, the expected premiums generated by the fund should far exceed costs. For example, the historical premium for removing goodwill alone makes up for the expense ratio. As we saw, a simple high BM high OP portfolio dramatically outperformed the market benchmark even without the profitable improvements of AVES. For what it is, AVES appears relatively cheap.
To further substantiate the claim that AVES should deliver a premium over the market net of fees, and to compare the expected return with competing factor-tilted emerging markets ETFs, a factor regression analysis can be performed to roughly estimate expected premiums over the market. Essentially, a multiple linear regression is used to obtain factor loadings, which indicate the level of exposure to different risk factors. The factor loadings are multiplied by their respective factor premiums to obtain the return contribution of each factor. The factor premiums are proxied by historical factor returns multiplied by 0.68. This figure is derived from McLean and Pontiff (2015) who estimated a 32% post-publication premium decay as investors trade to exploit published anomalies. So, the conservative assumption is to subtract a 32% "haircut" from historical factor premiums. The sum of these values minus the expense ratio is the premium over the cap-weighted index. This approach is noisy due to factor loadings being dependent on definitions of factors, and other costs such as taxes being omitted. Unfortunately, there is no perfect method to estimate asset factor premiums, and utilizing factor regressions remains a straightforward and simple approach. Figure 10 contains the expected factor premiums, over the market, of AVES and three competing ETFs (DFEV, FNDE, and DGS) using the Fama-French five factor model (MKT, SMB, HML, RMW, CMA). The Fama-French factors are chosen primarily due to the availability of data in emerging markets and their explanatory power when accounting for transaction costs (Detzel et al., 2021)
Figure 10
Expected Fama-French Factor Premiums of Factor-Tilted Emerging Markets ETFs (Annualized % Returns)
AVES | DFEV | FNDE | DGS | |
Size (SMB) | -0.2 | 0 | -0.2 | 0.2 |
Value (HML) | 1.3 | 1.6 | 2 | 0.6 |
Profitability (RMW) | 0.8 | 0.5 | -0.3 | 0.3 |
Investment (CMA) | 0.4 | -0.2 | 0.6 | 0.5 |
Total Net Factor Premium | 1.9 | 1.4 | 1.8 | 1 |
Note. Data from Kenneth French's data library, Morningstar Inc, and Commodity Systems Inc.
In line with expectations, all four funds show a premium of at least 100 bp over the cap-weighted index. Notably, AVES looks better than all other options due to its emphasis on profitability. It's important to note that these assumptions don't consider the relatively high current attractiveness of value caused by extremely high value spreads in emerging markets. After considering that, the case for targeting value in emerging markets becomes even stronger. If value experiences a massive return in the future, it might be the case that FNDE will start to outperform, as it has the highest value loading of these options. But that is the tradeoff for enjoying the negative correlation between value and profitability. Plus, it's unlikely that AVES investors would be disappointed if a historic value surge occurred. Rather, they would be overjoyed. It's not about maximizing returns in the best-case scenario. Otherwise, investors shouldn't even consider going long any of these ETFs, and instead opt for a highly leveraged long-short value portfolio to maximize value exposure. AVES has more to fall back on should value disappoint due to its high profitability loading. Alongside the wide body of evidence backing its methodology, AVES is likely the best candidate for an emerging markets value ETF.
Factor Diversification
Since the primary risk long-only equity investors are exposed to is market beta, it would be especially important to note the potential diversification benefit of spreading risk across other factors. Kartsakli and Schlumpf (2018) document the performance of the Fama-French factors during market tail events, defined as the 10 worst market scenarios. As it turns out, the value, profitability, investment, and momentum factors all performed well above usual during these tail events, with the size factor being the only exception. Focusing on global factors over the period 1990-2018, value returned 6.8% annually on average during tail events, compared to only 1.8% for every other period. The profitability factor returned 6.8% during tail events versus 2.7% otherwise, and the investment factor returned 8.2% versus -1.4% otherwise. This is a remarkable finding, as it shows that the main factors targeted in AVES generate more returns precisely when they're needed most.
These findings, as well as Novy-Marx's (2013) finding that profitability is a good hedge for value, are limited for our purposes since they don't examine emerging markets specifically. To test if the diversification potential across factors disappears in emerging markets, we can refer to the returns of the Fama-French emerging five factors from Kenneth French's data library. Figure 11 contains the correlation matrix derived from monthly returns, and figure 12 is derived from annual returns.
Figure 11
Correlation Matrix of Fama-French Emerging Five Factors and the Risk-Free Rate ((RF)), Monthly Returns
Mkt-RF | SMB | HML | RMW | CMA | RF | |
Mkt-RF | 1 | |||||
SMB | -0.21473 | 1 | ||||
HML | 0.087064 | -0.06375 | 1 | |||
RMW | -0.04256 | -0.22238 | -0.00527 | 1 | ||
CMA | -0.04472 | -0.12953 | 0.009327 | 0.79711 | 1 | |
RF | -0.04469 | 0.084021 | -0.00898 | 0.49605 | 0.49772 | 1 |
Note. Based on data from July 1989 to March 2023.
Figure 12
Correlation Matrix of Fama-French Emerging Five Factors and the Risk-Free Rate (RF), Annual Returns
Mkt-RF | SMB | HML | RMW | CMA | RF | |
Mkt-RF | 1 | |||||
SMB | 0.159351 | 1 | ||||
HML | 0.434 | 0.258153 | 1 | |||
RMW | -0.2072 | 0.602389 | -0.17936 | 1 | ||
CMA | -0.00279 | 0.90894 | 0.181807 | 0.696465 | 1 | |
RF | -0.14634 | -0.42228 | -0.07052 | -0.4242 | -0.36943 | 1 |
Note. Based on data from 1990 to 2022.
Fortunately, a lack of correlation remains across most factors remain when we restrict our sample to emerging markets. Thus, the market-neutral risk exposures of AVES can be thought of as a useful hedge against its beta, with exception of value, which is still a diversifier.
Risks
Despite the many attractive qualities of AVES, investors must be prepared for numerous risks. By virtue of being a fund with very high relative expected returns, it follows that it is also higher risk. We saw previously that a portfolio tilted toward value and profitability was more volatile than the market. The same was true for DFEVX, a similar fund of which we have more data for. Granted, both had significantly higher risk-adjusted returns, likely due to the lack of correlation among factors. It is also true that there is no guarantee that future expected premiums will be realized. As mentioned previously, expected return is just the weighted average of all possibilities, and it should be viewed as just one point in a wide dispersion of outcomes. The actual realized return is very unlikely to be the expected return. There is a chance that value spreads will keep widening, resulting in continued value underperformance. It is also possible that factor premiums disappear altogether, which could even include the equity risk premium in general. After all, there have been multiple periods of considerable length where the S&P 500 underperformed treasury-bills. Moreover, correlations aren't set in stone, and there's always a chance that they will rise, especially in a crisis period.
This has historically been the case in emerging markets, which have demonstrated a negative impact on portfolio skewness, known as co-skewness (Harvey, 2000). Skewness is a measure of the asymmetry in a data set. Plenty of research, including Lin et al. (2019), have shown that risk-averse investors try to avoid skewness. Co-skewness is an assets contribution to total portfolio skewness and is often considered a measure of risk. As Harvey showed, emerging markets have exhibited co-skewness when combined with a global portfolio.
While the risk of emerging markets have declined in recent years, there are still heightened levels of risk from some sources, including currency risk (uncertainty in exchange rates) and concerns about the competitiveness of China (Phylaktis and Ravazzolo, 2004). While taking on such geographical risks should demand a risk premium, especially as China's fundamental risk appears to be already priced in (Aghassi and Villalon, 2023), very risk-averse investors might prefer to avoid them.
Lastly, tracking error, defined as the standard deviation of the difference in returns between an asset or portfolio and a benchmark, represents the largest behavioral risk for investors. Active managers need to manage tracking error as their performance is often evaluated relative to a benchmark (e.g., beating the market or matching an index). Individual investors often compare their own performance relative to a benchmark, usually a market index. When investors see an asset underperforming for a long time, they might become inclined to sell it. Over many years of underperformance, which is common in long-term strategies such as value and emerging markets, it can become difficult for investors to feel like they're missing out. For this reason, it's not recommended to adopt a long-term strategy like AVES unless one understands the potential risks and is committed to the strategy. If an investor is uncomfortable deviating from a market index and is perfectly content with where they're at, then there is no need to do so.
Conclusion
For investors seeking higher expected returns that understand and are prepared for possible risks, AVES is a promising vehicle to gain exposure to several sources of expected returns. By targeting companies trading at low prices relative to fundamentals, it will be equipped to profit from the historically attractive value factor. Likewise, by focusing on emerging markets equities, it provides useful diversification to a global portfolio and is located where value spreads are at their highest. Its evidence-based methodology that utilizes cash-based profitability allows for a more accurate valuation metric and provides a hedge against both value exposure and market risk. Finally, its expected return is not only greater than the cap-weighted index, but competing funds as well, indicating that it is the best implementation of an emerging markets value strategy. Investors are encouraged to reassess their portfolio and consider the addition of this heavily undervalued fund.
We would like to thank Donovan Co for his research for this piece.
This article was written by
Analyst’s Disclosure: I/we have no stock, option or similar derivative position in any of the companies mentioned, and no plans to initiate any such positions within the next 72 hours. I wrote this article myself, and it expresses my own opinions. I am not receiving compensation for it (other than from Seeking Alpha). I have no business relationship with any company whose stock is mentioned in this article.
Seeking Alpha's Disclosure: Past performance is no guarantee of future results. No recommendation or advice is being given as to whether any investment is suitable for a particular investor. Any views or opinions expressed above may not reflect those of Seeking Alpha as a whole. Seeking Alpha is not a licensed securities dealer, broker or US investment adviser or investment bank. Our analysts are third party authors that include both professional investors and individual investors who may not be licensed or certified by any institute or regulatory body.
