BUL: Don't Buy Pacer's Cash Cows Growth ETF

Summary
- BUL applies a free cash flow yield screen on 150 "pure growth" large- and mid-cap stocks. Fees are 0.60% and the ETF has $39 million in assets under management.
- Unlike other Pacer Cash Cows ETFs, BUL is market-cap-weighted. However, it's also heavily concentrated with 84% of assets in its 25 holdings. The remaining 16% is allocated to 25 others.
- An analysis of BUL's performance reveals its inconsistency. It ranked among the best growth ETFs in 2021 and 2022, but poorly against 30 peers in 2019, 2020, and 2023 YTD.
- There is also a substantial earnings momentum issue with BUL's current portfolio. Energy stocks are underperforming YTD, have below-average EPS Revision Scores, and aren't producing significant earnings surprises this quarter.
- There may be short-term opportunities that come up as certain sectors are favored. However, as a long-term play, there appear to be numerous other superior solutions. BUL is a sell.
- Looking for a portfolio of ideas like this one? Members of Hoya Capital Income Builder get exclusive access to our subscriber-only portfolios. Learn More »
Bet_Noire
Investment Thesis
The Pacer US Cash Cows Growth ETF (NYSEARCA:BUL) selects 50 large- and mid-cap growth stocks based on trailing free cash flow yields. Its value-style selection from a group of pre-screened growth stocks results in a uniquely concentrated fund you won't find anywhere else. This article evaluates whether the strategy has merit because BUL's high 0.60% expense ratio certainly suggests it should. After assessing annual performance and evaluating BUL's strategy and fundamentals, I've concluded that BUL is not a fund you should buy. I hope you enjoy the data provided in this article, including a list of over a dozen other growth ETFs with a better track record than BUL.
BUL Overview
Strategy Discussion
Pacer ETF fact sheets always do an excellent job explaining how the fund works. In short, the selection process begins with the S&P 900 Pure Growth Index, a collection of 150 (20%) large- and mid-cap companies that exhibit the most robust growth characteristics. S&P Dow Jones Indices creates Style Baskets based on three growth and three value factors, highlighted below and described in more detail here.
S&P Dow Jones Indices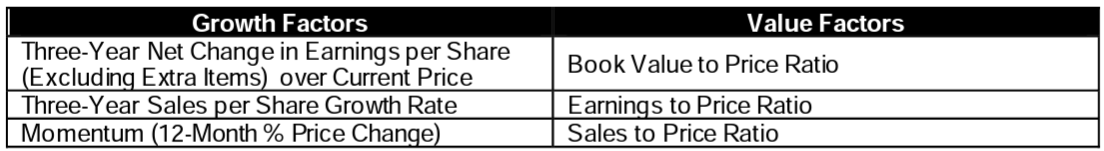
BUL's Index then applies a free cash flow yield screen to select the 50 companies. The fact sheet names three relevant terms:
1. Free Cash Flow: a company's cash flow from operations minus capital expenditures (expenses, interest, taxes, long-term investments)
2. Enterprise Value: a company's market capitalization adjusted to eliminate any capital structure bias (i.e., by adding debt and subtracting cash or cash equivalents).
3. Free Cash Flow Yield: measures a company's total free cash flow relative to its enterprise value. This is an internal statistic and does not constitute investor yield.
The free cash flow yield screen is a valuation screen. The combination of significant free cash flow and a low enterprise value drives up the free cash flow yield. BUL overweights these companies because they presumably are undervalued. The fact sheet provides an overview of the process:
Pacer ETFs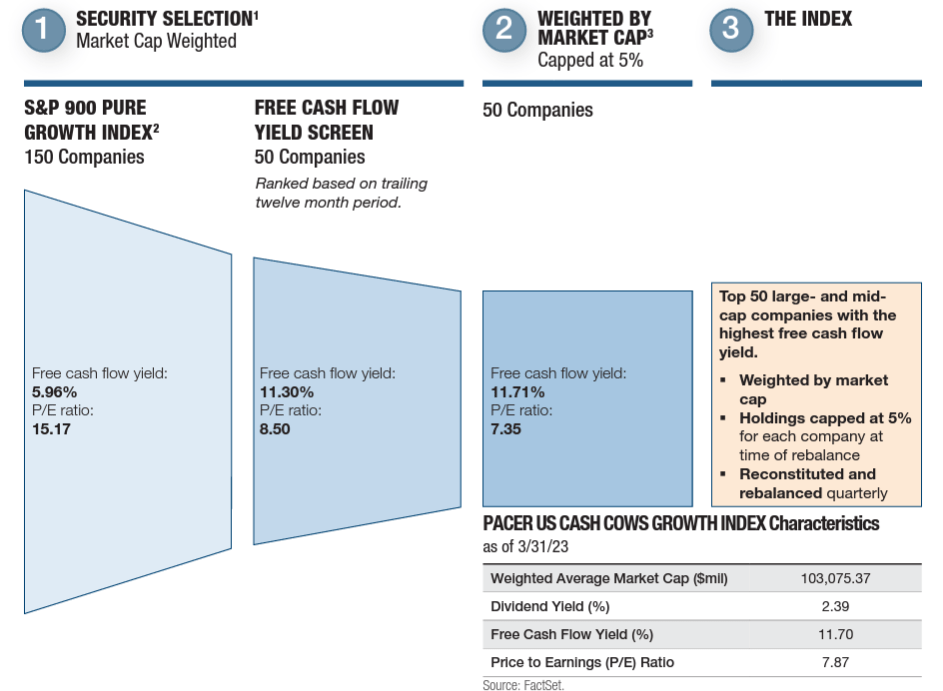
It's odd how the Index is market-cap-weighted. Typically, the approach is reversed, and the S&P 900 Pure Growth Index is a perfect example. It's factor-weighted, while the parent Index is market-cap-weighted. In BUL's case, we start with a market-cap-weighted Index (the S&P 900 Index), switch to a factor-based Index (the S&P 900 Pure Growth Index), then move back to a market-cap-weighting scheme. I won't speculate why other Pacer ETFs don't work this way. For example, COWZ and CALF, which I last reviewed here, weigh by free cash flow. However, holdings are capped at 5% for each stock and reconstitute and rebalance quarterly, consistent with other Pacer ETFs.
BUL is difficult to benchmark against. It's a common theme with Pacer ETFs, and their approach is inconsistent. To illustrate, COWZ lists the Russell 1000 Value Index as its primary benchmark even though it selects stocks from the entire Russell 1000 Index. CALF, which applies a similar methodology with small-cap stocks, selects from the whole S&P SmallCap 600 Index but uses the same Index, not the S&P SmallCap 600 Value Index, as its primary benchmark. BUL makes more sense because it benchmarks against the S&P 900 Pure Growth Index. However, we're still left wondering if it's appropriate to compare BUL with factor-weighted ETFs like the S&P 500 and 400 Pure Growth ETFs (RPG and RFG), plain vanilla market-cap-weighted ETFs like SPYG and SCHG, or GARP ETFs like the Invesco S&P 500 GARP ETF (SPGP). I prefer to provide more data rather than less in these situations, so let's look at BUL's performance against several of its competitors since its 2019 launch next.
Performance Analysis
The following table highlights annual returns for 31 large-cap growth ETFs with as much history as BUL. I used my judgment to compile this list, but I let FactSet classifications guide me. All data is sourced from Portfolio Visualizer and presented on a total returns basis through April 2023, assuming you reinvested dividends.
The Sunday Investor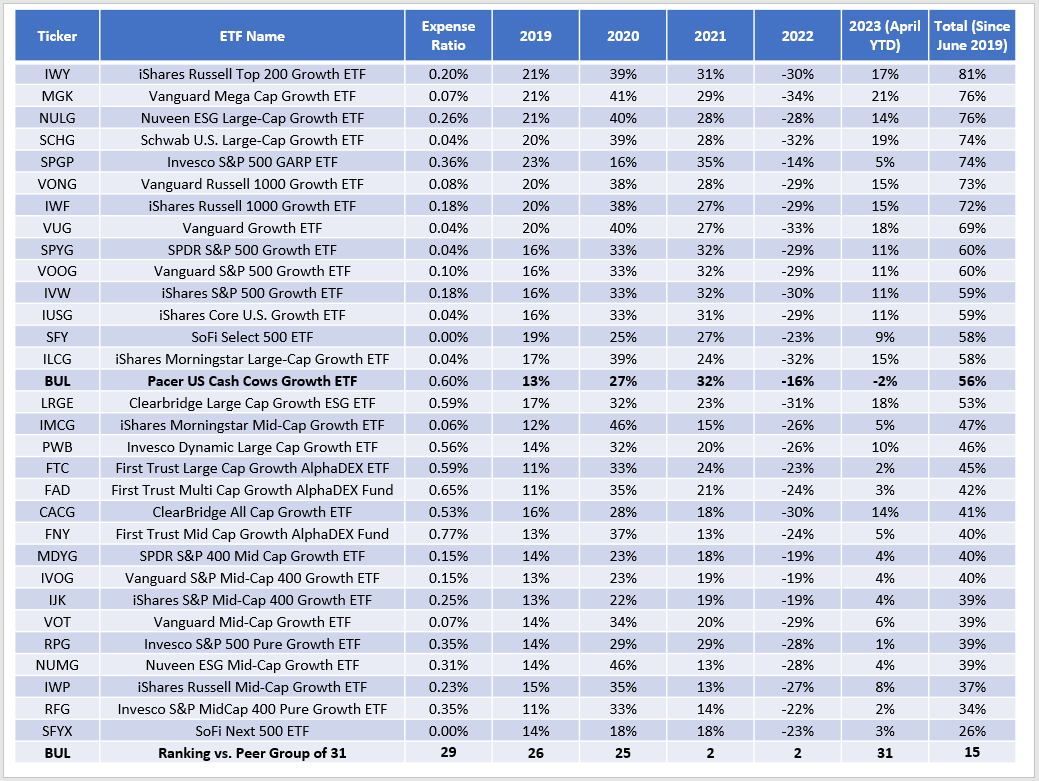
BUL is the 29th most expensive fund with a 0.60% expense ratio and delivered average returns since June 2019 (#15/31). However, returns could be more consistent. From June 2019 to December 2019, BUL ranked #26/31. It followed up with a 27% gain in 2020 that ranked #25/31, then delivered a 32% gain and a 16% decline in 2021-2022, second best behind SPGP both years. In 2023, BUL's 2% loss places it at the bottom of the peer group. Based on this inconsistent data, I don't accept BUL as a suitable core holding. There are short-term tactical opportunities, but if you're not inclined to trade frequently, the plain vanilla growth ETFs are more rewarding. In addition, SPGP has coincidentally tracked the S&P 500 GARP Index since June 2019 and produced the following relative rankings:
- 2019 (since June): 1
- 2020: 31
- 2021: 1
- 2022: 1
- 2023 (April YTD): 21
- Total Return (since June 2019): 5
These ranking charts are essential because they reveal information not easily seen in traditional performance charts. An ETF may look great on paper, but its returns could be heavily skewed, as with BUL. You can benchmark BUL against RPG and RFG, and the long-term results look great. However, it's telling that so many market-cap-weighted ETFs outperformed. BUL received a boost because it's market-cap-weighted.
Are Pacer's Quarterly Reconstitutions Beneficial?
Many readers assume Pacer ETFs' quarterly updates are beneficial, allowing the fund to adapt quickly to changing market conditions. However, we wouldn't see such inconsistent rankings if that were true. I initially pointed this out in a March 2022 review of COWZ, advising readers to plan an exit strategy for when inflation eases because the ETF wouldn't move quickly enough out of the commodity-related assets responsible for its excellent recent returns. Even other analysts make the same false assumption, and I would challenge them to explain the rankings data above. COWZ is still 36% Energy because Energy stocks have excellent free cash flow figures after the runup in oil prices. Since markets are forward-looking, I'm more interested in what free cash flow is moving forward, and if Seeking Alpha Factor Grades are any indication, the picture isn't nearly as rosy as before. Here are the Grades for BUL's top five Energy holdings, which total 26% of the portfolio.
Seeking Alpha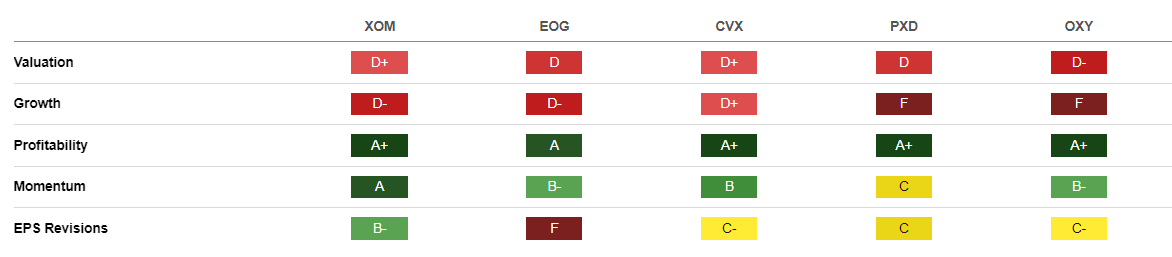
As shown, all have perfect Profitability Grades, but their EPS Revision Grades are poor compared to others in the sector. The same goes for the Valuation and Growth Grades; year-to-date returns are also weak. Even XOM is trailing the 10-20% returns for the market-cap-weighted growth ETFs listed earlier.
Seeking Alpha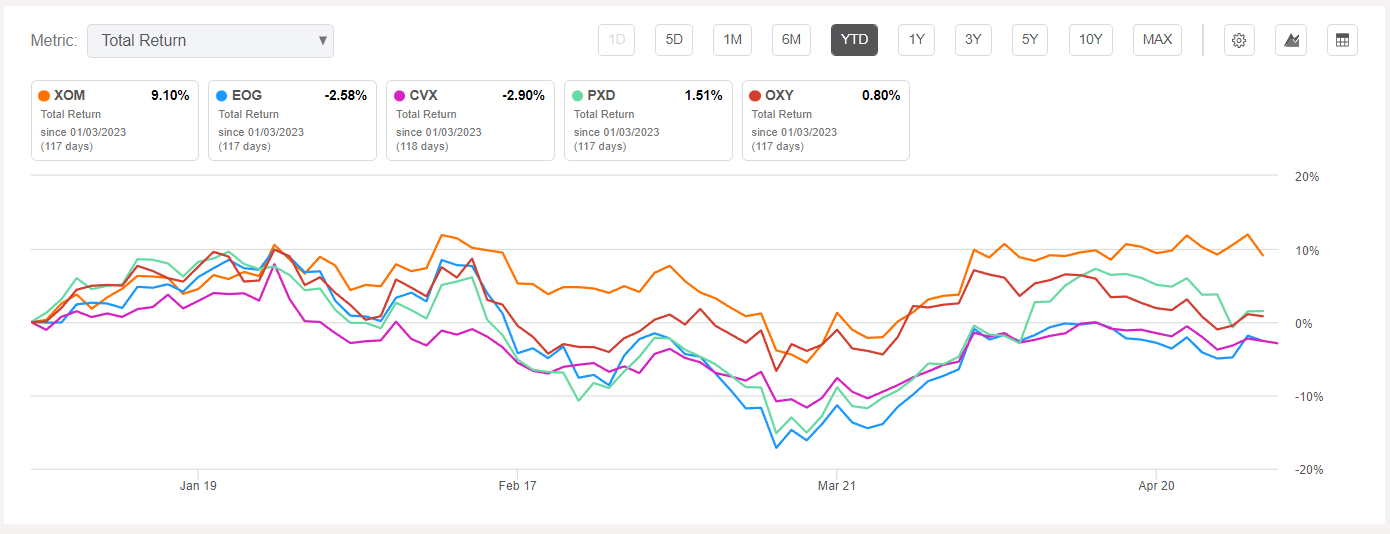
BUL Analysis
Portfolio Turnover
BUL underwent some significant changes recently, but it's only partially free-cash-flow-yield related. When S&P Style Indexes reconstituted to end 2022, many Energy stocks, including Exxon Mobil and Chevron (CVX), moved to the Pure Growth Index. I touched on this in my January 2023 SPDR S&P 500 Value ETF (SPYV) review. These changes impact BUL more than other ETFs like SPGP. In BUL's case, high portfolio turnover is layered on the high turnover of the parent Index, the S&P 900 Pure Growth Index. In SPGP's case, high turnover is layered on the low turnover of the parent Index, the S&P 500. The result is a portfolio turnover rate of around 170% in 2020 and 2021.
Pacer ETFs Semi-Annual Report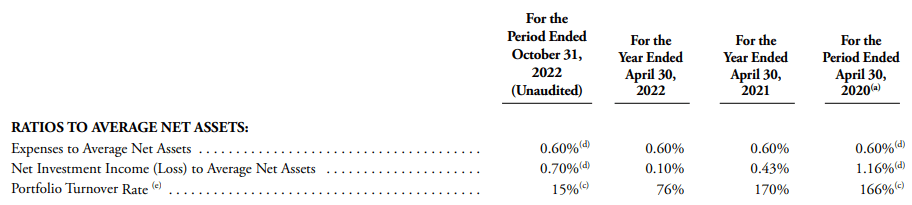
For the year ending April 2022, turnover was lower at 76%, and while the rate is only 15% for the six months ending October 31, 2022, that figure will substantially increase once the next annual report is released. I checked BUL's July 2022 holdings, and none of the top 12 are present today, with only ten (14% of the weight) remaining. Meta Platforms (META) stands out because it switched to the S&P Value Index to close the year. Also removed were Apple (AAPL) and Alphabet (GOOGL).
Top Ten Holdings
The fund's top three holdings are Vertex Pharmaceuticals (VRTX), Exxon Mobil, and EOG Resources (EOG). Six in the list are Energy stocks, while VRTX, GILD, BMY, and ABBV represent the Biotechnology (Health Care) industry. Its remarkable concentration gives additional weight to BUL as a short-term tactical solution rather than a core long-term holding.
Pacer ETFs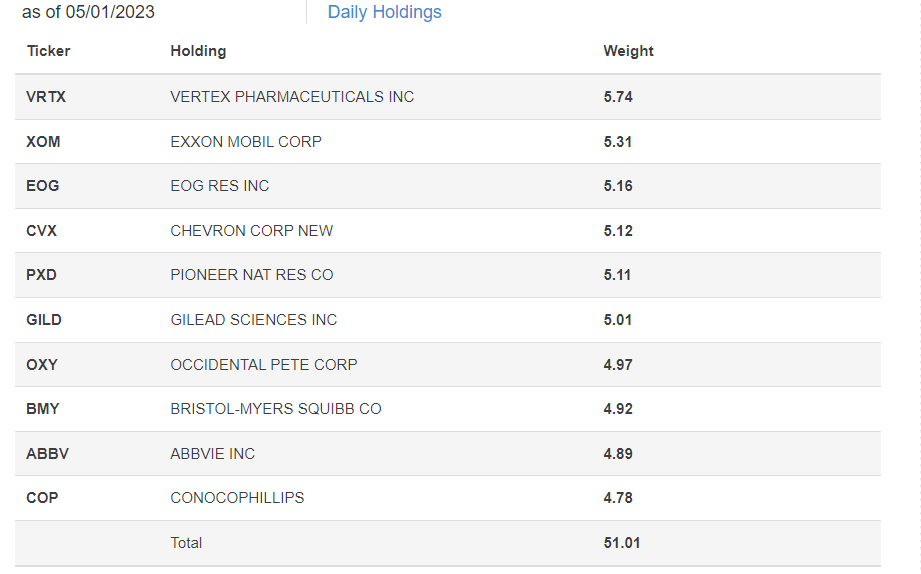
BUL's sector exposures are listed below, alongside SPYG and SPGP. Total Energy exposure is 46%, followed by 33% in Health Care and 13% for Materials. The remaining 8% is primarily Industrials, so BUL is also concentrated at the sector level.
Morningstar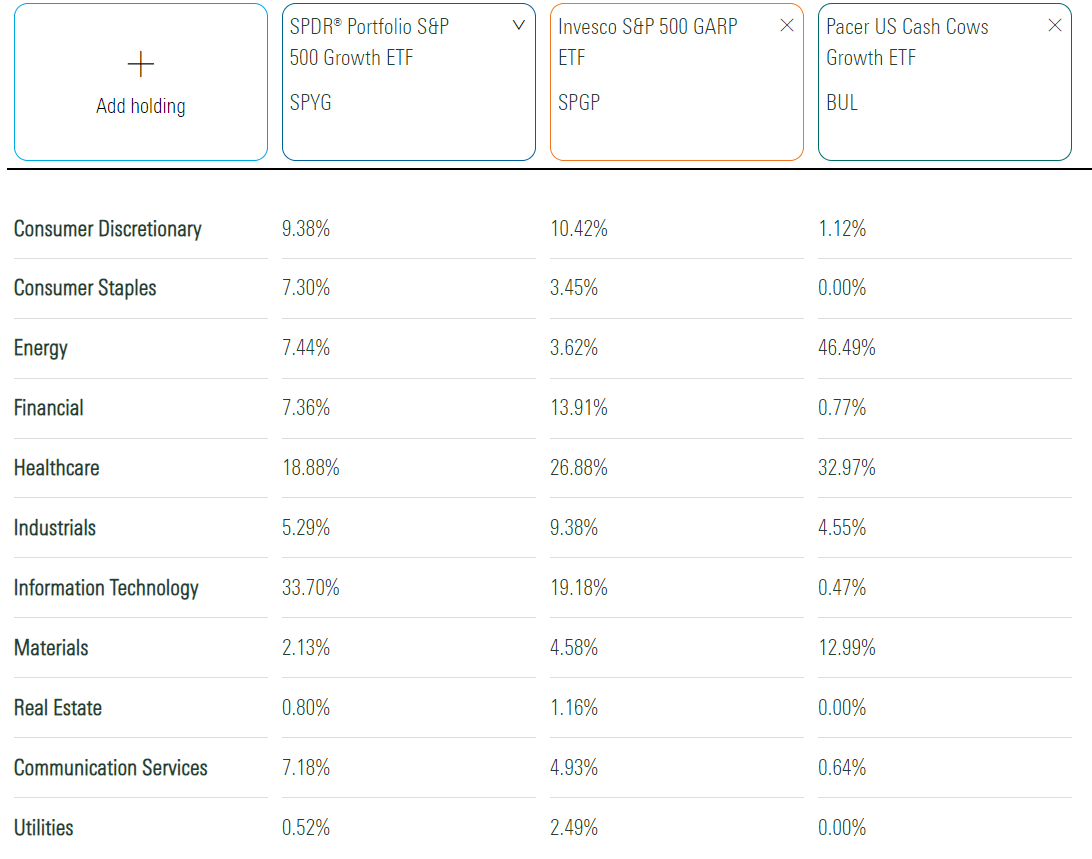
BUL Fundamentals By Company
Finally, I'd like to provide some fundamental metrics for BUL's top 25 holdings. Due to high portfolio turnover, this may not be relevant in a few months. Still, it's a good snapshot of where we are today compared to SPGP and SPYG.
The Sunday Investor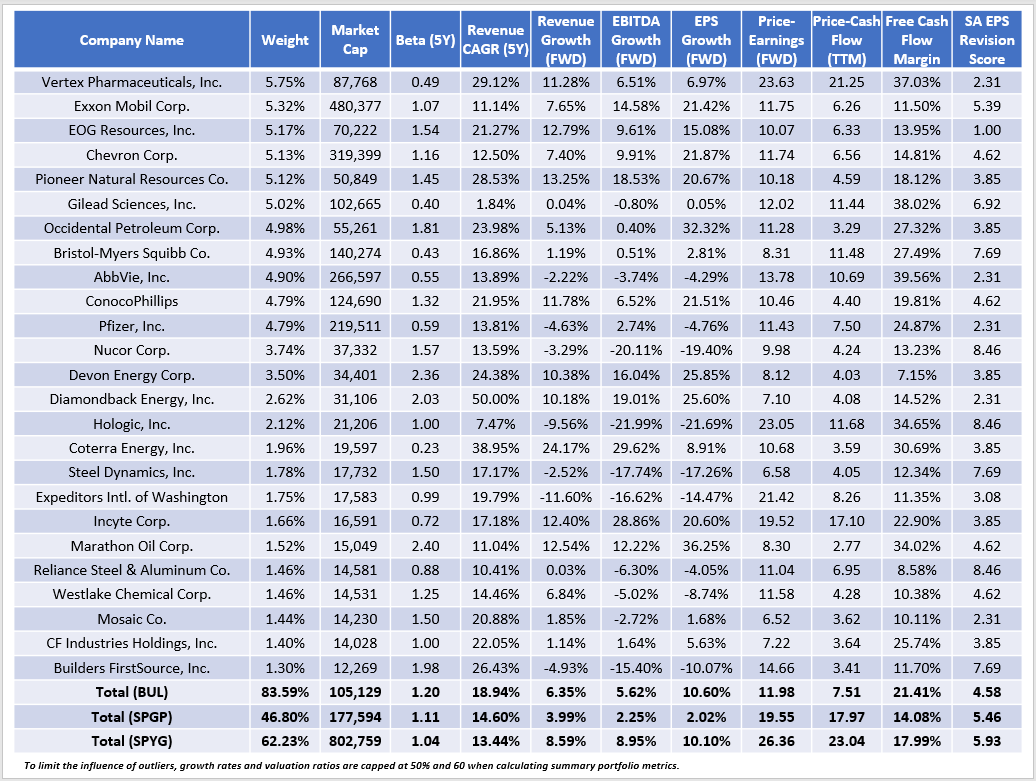
BUL's 1.20 five-year beta is the highest of the three, indicating it's the most volatile. The Energy stocks are primary contributors, but Exxon Mobil is one of the safer bets. It's an instance where the market-cap-weighting scheme is beneficial. Still, investors should be more flexible and use a low-cost sector ETF like XLE or VDE if they are bullish on Energy.
BUL also has excellent free cash flow margins: 21.41% on a trailing twelve-month basis compared to 14.08% and 17.99%. It's unsurprising, given that's the focus, and BUL's constituents trade at 11.98x forward earnings, well below SPGP's 19.55x and SPYG's 26.36x. There's a strong value proposition here, but I would be more comfortable if it weren't so concentrated. The top 25 holdings comprise 84% of the portfolio.
When applying the free cash flow yield screen, it's normal for the growth rate to decline. BUL has an estimated 6.35%, 5.62%, and 10.60% sales, EBITDA, and EPS growth rates. All figures are better than SPGP's, which I expressed concern about in January. However, the significant decline in BUL's expected sales growth rate from its trailing five-year figure (18.94% to 6.35%) is also concerning. Lower sales generally mean less free cash flow, which is reflected in a poor 4.58/10 EPS Revision Score. That means Wall Street consensus earnings estimates are declining faster than the broader growth market.
In addition, Yardeni Research publishes aggregate S&P 500 sales and earnings surprise figures each quarter. Through April 26, 2023, the Energy sector's earnings surprise was 5.5%, below the 8.0% aggregate S&P 500 figure. Exxon Mobil and Chevron reported an 8.73% and 3.93% earnings surprise on April 28, 2023, but Exxon's sales results disappointed (3.90%) miss.
Yardeni Research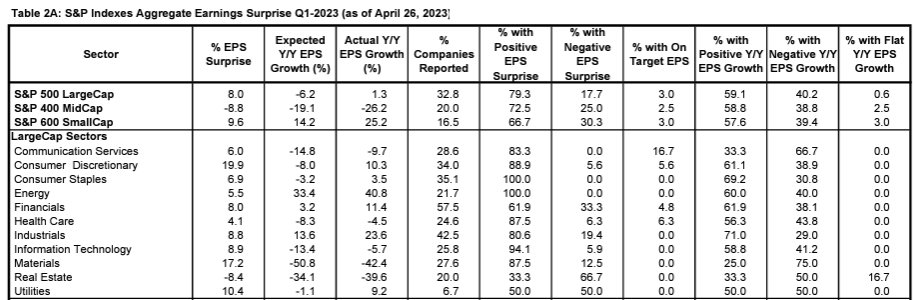
Exxon Mobil and Chevron reported an 8.73% and 3.93% earnings surprise on April 28, 2023, but Exxon's sales results disappointed (3.90%) miss, leading to a downgrade at Goldman Sachs. Other heavily-weighted stocks like Gilead Sciences (GILD) and AbbVie (ABBV) missed earnings expectations by 10.85% and 1.37%, respectively. In short, earnings momentum is not on BUL's side.
Investment Recommendation
Like other Pacer ETFs, BUL is a free cash flow yield driven ETF that's difficult to benchmark against. Short-term historical returns are impressive, but BUL's strengths and weaknesses are revealed by assessing annual rather than compounded performance. BUL ranked poorly in 2019, 2020, and 2023 YTD but was the second-best-performer in 2021 and 2022. These inconsistent results suggest it's an incredible but risky opportunity. Your short-term view on BULL likely rests on how you view the Energy and Health sector. As for its long-term results, BUL's 56% gain since June 2019 ranked only #15/31. The strategy has yet to be proven, and we should demand that for a fund with a 0.60% expense ratio.
Finally, my fundamental analysis revealed how many top holdings have poor earnings momentum. SPYG's EPS Revision Score was higher, and other, more defensive funds score even better. The Vanguard Dividend Appreciation ETF (VIG) is one fund I'm again bullish on. Given these results, I rate BUL a sell, and I look forward to continuing the discussion in the comments section below.
The Sunday Investor Joins Income Builder
The Sunday Investor has teamed up with Hoya Capital to launch the premier income-focused investing service on Seeking Alpha. Members receive complete early access to our articles along with exclusive income-focused model portfolios and a comprehensive suite of tools and models to help build sustainable portfolio income targeting premium dividend yields of up to 10%.
Whether your focus is High Yield or Dividend Growth, we've got you covered with actionable investment research focusing on real income-producing asset classes that offer potential diversification, monthly income, capital appreciation, and inflation hedging. Start A Free 2-Week Trial Today!

This article was written by

I perform independent fundamental analysis for over 850 U.S. Equity ETFs and aim to provide you with the most comprehensive ETF coverage on Seeking Alpha. My insights into how ETFs are constructed at the industry level are unique rather than surface-level reviews that’s standard on other investment platforms. My deep-dive articles always include a set of alternative funds, and I am active in the comments section and ready to answer your questions about the ETFs you own or are considering.
My qualifications include a Certificate in Advanced Investment Advice from the Canadian Securities Institute, the completion of all educational requirements for the Chartered Investment Manager (CIM) designation, and a Bachelor of Commerce degree with a major in Accounting. In addition, I passed the CFA Level 1 Exam and am on track to become licensed to advise on options and derivatives in 2023. In November 2021, I became a contributor for the Hoya Capital Income Builder Marketplace Service and manage the "Active Equity ETF Model Portfolio", which as a total return objective. Sign up for a free trial today! Hoya Capital Income Builder.
Analyst’s Disclosure: I/we have no stock, option or similar derivative position in any of the companies mentioned, and no plans to initiate any such positions within the next 72 hours. I wrote this article myself, and it expresses my own opinions. I am not receiving compensation for it (other than from Seeking Alpha). I have no business relationship with any company whose stock is mentioned in this article.
Seeking Alpha's Disclosure: Past performance is no guarantee of future results. No recommendation or advice is being given as to whether any investment is suitable for a particular investor. Any views or opinions expressed above may not reflect those of Seeking Alpha as a whole. Seeking Alpha is not a licensed securities dealer, broker or US investment adviser or investment bank. Our analysts are third party authors that include both professional investors and individual investors who may not be licensed or certified by any institute or regulatory body.