IIM And IQI: High-Quality Muni Funds, But Leverage Adds Volatility And Risks

Summary
- IIM and IQI are leveraged municipal bond closed-end funds.
- This leverage meant sharper downside moves when rates were rising, but it could also mean sharper upside moves if rates reverse lower.
- This is a continuation of looking at muni funds more broadly as a potential move into higher-quality debt.
- This idea was discussed in more depth with members of my private investing community, CEF/ETF Income Laboratory. Learn More »
Wirestock/iStock via Getty Images
Written by Nick Ackerman, co-produced by Stanford Chemist. This article was originally published to members of the CEF/ETF Income Laboratory on April 19th, 2023.
In our recent update on Nuveen Select Tax-Free Income Portfolio (NXP) and Nuveen AMT-Free Municipal Value Fund (NUW), I highlighted why municipal bonds could be a fairly attractive place to park capital. If the Fed is done raising rates aggressively, we could see some stabilizing here. If they cut rates in a year or two, we could even potentially capture some upside.
Additionally, those funds carry no or very low leverage levels compared to most closed-end funds. Most CEFs carry leverage in an attempt to enhance returns. That meant they should be relatively lower risk compared to their leveraged counterparts.
Sticking to that sort of theme, a reader suggested taking a look at two other municipal bond funds. This time from Invesco, but these are leveraged plays. Therefore, that introduces back in the risk of greater volatility. The two funds we'll be taking a look at today are Invesco Value Municipal Income Trust (NYSE:IIM) and Invesco Quality Municipal Income Trust (NYSE:IQI). Invesco is a smaller player in terms of total AUM, but that doesn't mean they still can't provide some attractive management.
When comparing IIM and IQI against NXP and NUW since the beginning of 2022, we can clearly see the negative impacts of leverage. While negative, the total NAV returns for NXP and NUW were superior as the Fed began raising interest rates. The total share price returns for all these funds except for NXP sank lower, which sets up for discounts expanding on these funds.
YCharts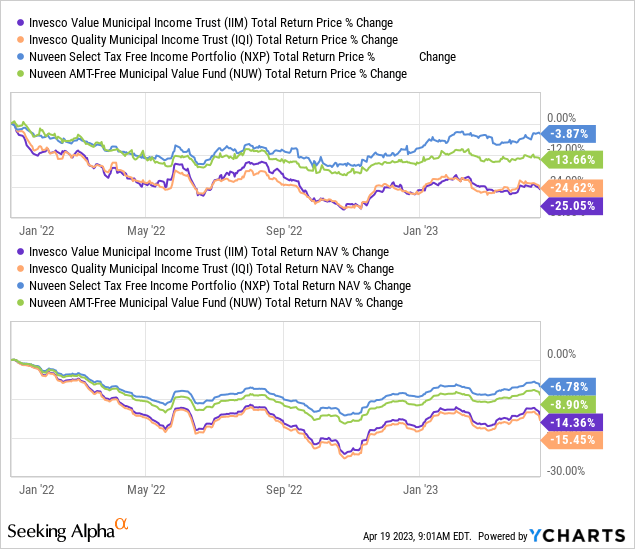
However, on a YTD basis, IIM and IQI had started to outperform as yields started to drop. Yields were dropping merely on the expectation that the Fed would be closer to being done as we saw some bank collapses, highlighting that some things in the financial system were starting to break.
YCharts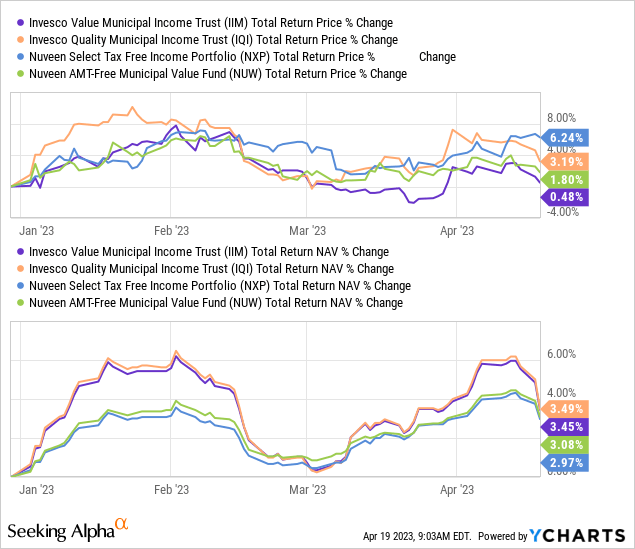
That really helped out these funds, but even more recently, the results of IIM and IQI have started to trend lower once again in the last week or so. Perhaps unsurprisingly, it came on the back of the 10-Year Treasury Rate once again heading higher from lower early April levels.
YCharts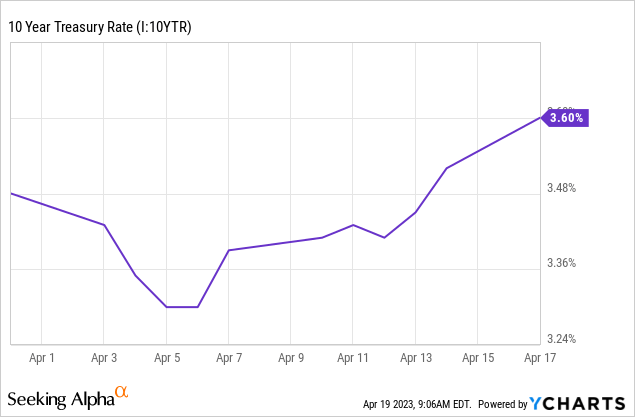
To summarize these comparisons looking at these funds, expect IIM and IQI to be more aggressive plays against NXP and NUW, which utilize low or no leverage. That isn't necessarily a good or bad thing, but it does increase the volatility of the funds. Should rates reverse or stabilize, IIM and IQI could continue their outperformance, as we saw on a YTD basis. However, should inflation start to kick back up and the Fed need to turn aggressive once again, NXP and NUW should be the ones to offer a relatively softer decline.
Simply put, NXP and NUW are relatively more conservative plays on expected rate stabilization, and IIM and IQI will be the more aggressive plays within the municipal CEF wrappers.
Invesco Value Municipal Income Trust
- 1-Year Z-score: -1.19
- Discount: -10.78%
- Distribution Yield: 4.61%
- Expense Ratio: 0.95%
- Leverage: 35.92%
- Managed Assets: $964.93 million
- Structure: Perpetual
IIM's investment objective is "to provide current income which is exempt from federal income tax." To achieve that objective, they invest in "a diversified portfolio composed substantially of investment-grade municipal securities."
The fund's effective leverage is fairly high when compared to most other CEFs. For muni CEFs, this tends to be fairly normal. I suspect the idea is that municipal bonds are fairly safe instruments, so leveraging up significantly isn't usually a big problem.
However, with rising interest rates, we see higher leverage costs. That's why the fund's total expense ratio, when including leverage, rose from 1.44% last fiscal year to 2.57% in the last annual report. So that doesn't yet reflect the further increases in borrowing costs that have happened since with a couple more Fed rate hikes.
They had floating rate notes outstanding of around $191 million in their last semi-annual report. This had an average annual interest rate of 1.89% at that time. The latest report put the borrowings there at $162.5 million, with an average rate of 2.52%.
They also carry preferred shares as leverage, but these are variable rate muni term preferred shares or VMTP, which will also experience higher leverage costs. Of the $233.1 million outstanding VMTP, they were paying 1.86% at the end of the semi-annual report. The latest report shows us once again how borrowing costs are rising. The $233.1 outstanding now costs them 2.68%.
Since these reports, they have taken down some of their TOB (tender option bond) assets even further to $113.49 million, as shown in the last fact sheet. That also will impact the income generation of the portfolio.
Their fiscal year-end is February, and we just got the most recent annual report. It gave us a clearer picture and we can see that they reported earnings of $0.044 in their last fact sheet for February. This is relevant because the NII per share reported in their semi-annual report, when divided by six, comes to $0.055.
Dealing with such small figures, it can be hard to see the difference, but that actually is a 20% decline. It's also still slightly above where the fund's last distribution. The steady decline in the payout again is a symptom of the higher leverage costs here eating into the NII. The Fed put in another 25 basis point hike and is highly anticipated to do another 25 basis point hike. That could suggest added pressure here, meaning no stop to the distribution trims just yet. The last distribution paid compared to a year ago is lower by 26.95%.
IIM Distribution Over The Last Year (CEFConnect)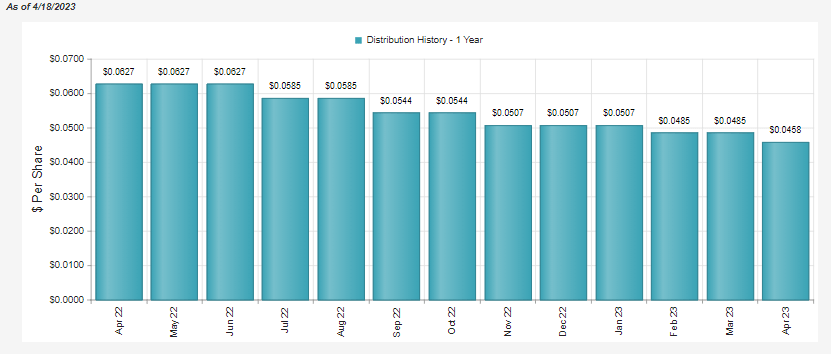
This is also reflected in their last UNII report for both of IIM and IQI. In that case, the 3-month average NII earnings were $0.0453. That had put the coverage ratio at 93.4%, but they've since trimmed again. This has been a similar case with IQI, which I've highlighted as well.
Invesco UNII Report (Invesco)
So while you get a higher comparable distribution yield up front compared to non-leveraged funds, you are dealing with steady declines in the payout. In this case, the last distribution works out to a rate of 4.61%. NUW is at a distribution rate of 3.55%, and NXP is 3.99% for some context. They've been able to increase their distributions recently.
With that being said, we are still looking at a higher-quality portfolio. These are actually similar weights to credit qualities that we saw in NUW and NXP.
IIM Credit Quality (Invesco)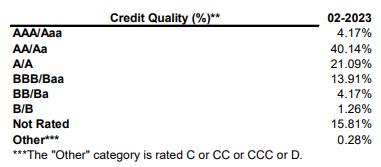
The top five states include California and New York as the largest, with a meaningful amount in Texas and Illinois as well. Seeing California as a significant weighting is a seemingly common sight now that I've been looking at muni funds more closely.
IIM State Exposure (Invesco)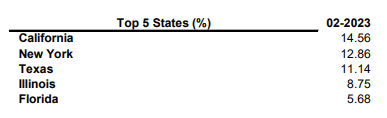
The benefit of this is for some investors they can benefit from potential state tax exemptions as well if they live in these places. Being these are large population states, with California being the largest, it's more likely to be appealing to more investors.
The duration of IIM in the last fact sheet came to 8.73 years; on a duration option-adjusted basis, it was higher at 9.47 years. The leverage-adjusted OAD (option-adjusted duration) comes up substantially to 13.04 years. That means for every 1% change in interest rates, that should move the fund's underlying portfolio by percentages around these values. That measures their underlying interest rate sensitivity, but other factors move prices too.
One area that can make IIM more attractive is the fund's discount. Though the discount has contracted from some of its deepest levels more recently, over the longer term, this would indicate an appealing entry point. It is trading well below the average of the last decade.
YCharts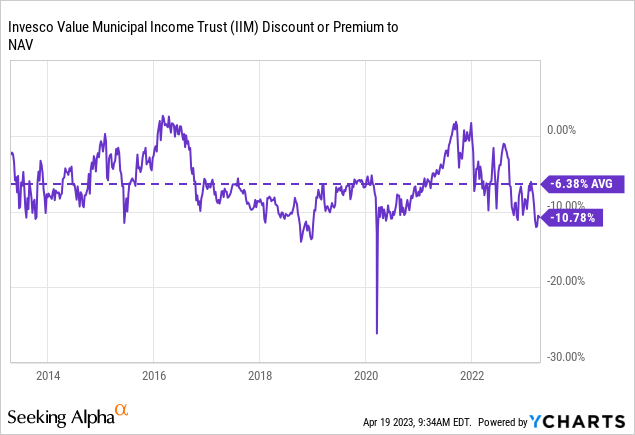
Invesco Quality Municipal Income Trust
- 1-Year Z-score: -1.48
- Discount: -12.20%
- Distribution Yield: 4.66%
- Expense Ratio: 0.95%
- Leverage: 37.77%
- Managed Assets: $872.42 million
- Structure: Perpetual
IQI's investment objective is "to provide current income which is exempt from federal income tax." To achieve that objective, they invest in "a diversified portfolio composed substantially of investment-grade tax-exempt municipal securities."
No, I didn't just copy and paste that from IIM, but I could have. Much of what has been presented broadly about IIM can be mirrored for IQI. These funds even share the same three portfolio managers.
IQI's total expense ratio comes to 2.57%, which was an increase from 1.54% in the prior year. While that is the same exact total expense ratio as IIM in the last year, IQI had the higher expense ratio in fiscal 2022 by a bit.
They've gone with the same form of borrowings based on what their last annual report reflects. In this case, their floating rate notes outstanding were nearly the same in their semi-annual report ($141 million) and came in at an average interest rate of 1.94%. By their annual report recently, the outstanding borrowings were down around $120.2 million with an interest rate of 2.73%. The TOB assets are down to $95.65 million in their last fact sheet. That's a drop of 32% in their leverage compared to 40% for IIM.
Their VMPT outstanding of $227.5 million carried an average annualized dividend rate of 2.76%. Both are a touch higher than IIM's leverage costs but still come to the same expense ratio.
We saw the coverage ratio above was lacking on a three-month basis in their UNII report. The last fact sheet reflects earnings of $0.0362. That's down from the semi-annual report of $0.04333, or a decline of 16.46%. That's better than the 20% decline that IIM exhibited, which could be reflected in IQI's TOB leverage experiencing a smaller drop.
Still, the fund has had the same fate in terms of its distribution rate. The upfront yield from this fund is still higher than NXP and NUW, but that cost is reducing distributions for the duration that the Fed remains on the rate hiking path. In the last year, the distribution was cut by 20.85% from where it was a year ago. Small consolation, but it beats out the nearly 27% decline for IIM.
IQI Distribution Over The Last Year (CEFConnect)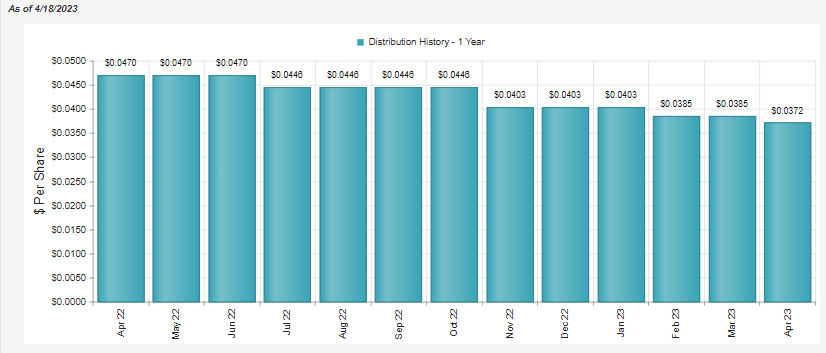
IQI has a modified duration of 9.22 years and a duration option-adjusted of 9.77 years. The leverage-adjusted OAD comes to 13.98 years. That's somewhat in the same range as IIM but could be viewed as slightly more interest rate sensitive. The average coupon of the underlying bonds comes to 4.43% compared to IIM's 4.40%. The average market price for IIM is $97.51, while IQI's comes in at a similar $97.32.
Naturally, with such close figures, we see that the credit quality of their portfolio comes in at similar weightings too. AA and A carrying the largest allocations, making up 61.05% of IQI's portfolio. Virtually similar to the 61.23% shown for IIM.
IQI Credit Quality (Invesco)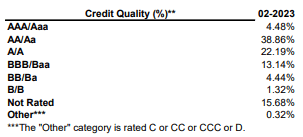
They don't get too fancy with their state allocations, either. Once again, lining up quite similarly to what we saw for IIM. This isn't too surprising given the same exact managers and the same exact investment objective and investment policy.
IQI State Exposure (Invesco)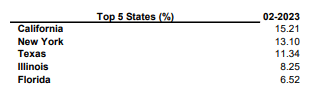
With all that being said, it's perhaps surprising to see that IQI is the fund that trades at the wider discount. However, this isn't just recently, the fund has carried a larger discount regularly in the last decade.
YCharts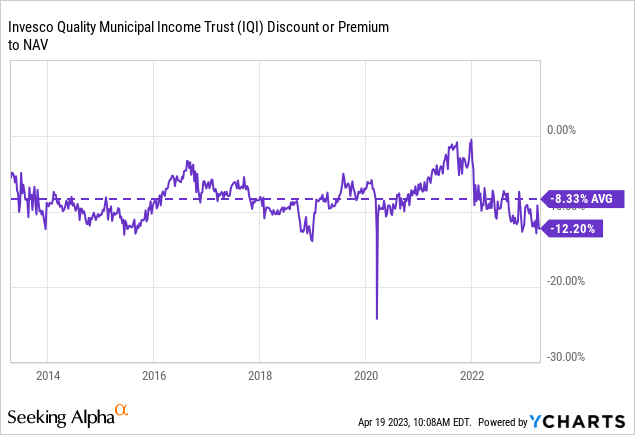
In absolute terms, the differential for IIM between its current discount and average is 4.4 points. For IQI, it comes in at a differential of 3.87 points. So technically, on that basis, IIM could be looking like the better value if history is any guide, despite IQI being at an absolutely larger discount.
Perhaps investors are discounting IQI more because of weaker long-term performance. IQI is slightly older, launching in September 1992, while IIM launched in February 1993. The chart below goes back as far as YCharts would allow for a comparison. The divergence between the funds appears to have started in 2008/09's GFC. Before that, they had identical charts.
YCharts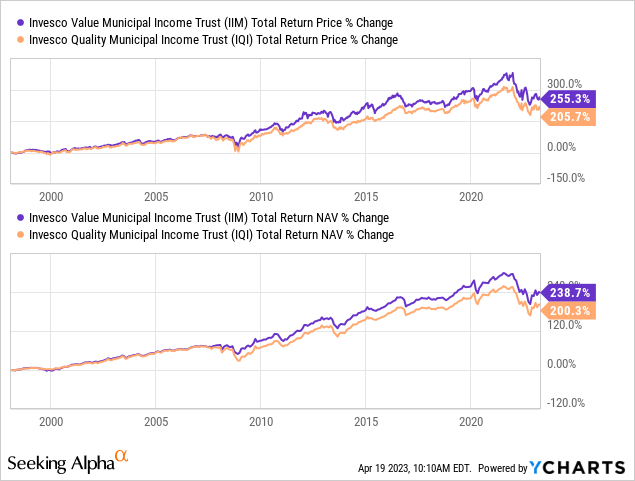
Conclusion
In looking at more muni funds, IIM and IQI were suggested to provide some coverage. Of course, the idea to look at muni funds now is because they've been slammed by higher interest rates as the Fed raises rates. The Fed is expected to raise rates one more time at this point, but hold them there going forward. A stabilization in rates could benefit these municipal funds (and all fixed-income funds, really.) An actual cut in rates could be even better and a potential catalyst for sparking some upside moves. Until that potential cut though, investors can benefit from mostly federally tax-exempt distributions.
The main risks here will be if the Fed needs to start raising interest rates again to combat inflation if it begins to tick higher. Additionally, IIM and IQI being leveraged will experience greater volatility due to amplified moves in either direction. Meaning that it can benefit and enhance returns to the upside should things go well, but it also increases the downside potential moves to amplify the risks.
Profitable CEF and ETF income and arbitrage ideas
 At the CEF/ETF Income Laboratory, we manage ~8%-yielding closed-end fund (CEF) and exchange-traded fund (ETF) portfolios to make income investing easy for you. Check out what our members have to say about our service.
To see all that our exclusive membership has to offer, sign up for a free trial by clicking on the button below!

This article was written by

---------------------------------------------------------------------------------------------------------------
I provide my work regularly to CEF/ETF Income Laboratory with articles that have an exclusivity period, this is noted in such articles. CEF/ETF Income Laboratory is a Marketplace Service provided by Stanford Chemist, right here on Seeking Alpha.
Analyst’s Disclosure: I/we have a beneficial long position in the shares of NUW either through stock ownership, options, or other derivatives. I wrote this article myself, and it expresses my own opinions. I am not receiving compensation for it (other than from Seeking Alpha). I have no business relationship with any company whose stock is mentioned in this article.
Seeking Alpha's Disclosure: Past performance is no guarantee of future results. No recommendation or advice is being given as to whether any investment is suitable for a particular investor. Any views or opinions expressed above may not reflect those of Seeking Alpha as a whole. Seeking Alpha is not a licensed securities dealer, broker or US investment adviser or investment bank. Our analysts are third party authors that include both professional investors and individual investors who may not be licensed or certified by any institute or regulatory body.