
 Yahoo Finance
 The 25 Hardest Places To Sell a Home
- Oops!Something went wrong.Please try again later.
- ZG

The housing market has done surprising things over the pandemic. When the economy took an especially tough hit, in 2020, the housing market did not follow suit. Mortgage rates hit all-time lows of below 3%, and buyers scrambled to lock in lower rates. This surge in demand drove home prices higher, making the market attractive to sellers.
See the List: GOBankingRates' Best Banks of 2023
Related: 3 Things You Must Do When Your Savings Reach $50,000
The average rate on a 30-year fixed-rate mortgage increased to 6.73% in the first week of this month, according to Freddie Mac's benchmark rate analysis. Just a year ago, the 30-year fixed rate was 3.89%. According to the National Association of Realtors (NAR), the median existing-home sales price went up 1.3% to $359,000 in January compared to January 2022.
To help locate housing markets that may be in distress, GOBankingRates analyzed the 190 largest metropolitan housing markets according to Zillow's Housing Data and found the 25 hardest places to sell a home. Primary factors considered were the difference between list and sale prices, average price cut and average number of days on Zillow.
The resulting list of 25 cities is ranked in reverse order, with the most difficult city in which to sell a home listed last. Depending on your point of view, these cities could represent opportunities for buyers, as sellers that have a tough time getting their list price are likely to drop it. However, if sellers keep dropping their prices in a market, it can start a downward spiral, meaning your home price could fall below what you paid for it. Talking with a good local agent is a good place to start if you're looking to buy and want to get the temperature of a certain area. Here are the cities in which it's hardest to sell a home.
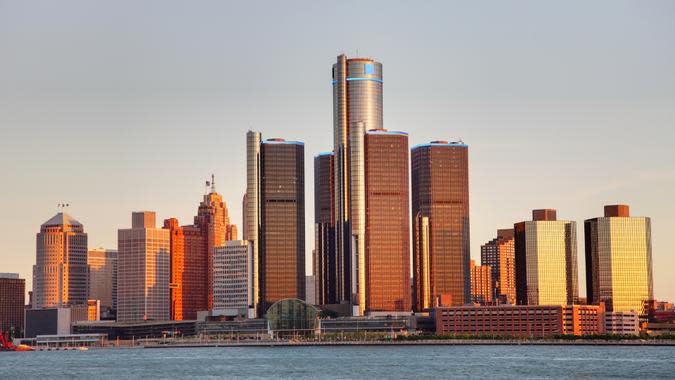
25. Detroit, Michigan
Median list price in 2022: $218,231
Median sale price in 2022: $238,492
Difference between list price and sale price: $20,261
Average number of homes on the market in 2022: 9,889
Median days on market: 8
Percentage of listings with price cut: 17.63%
Median price cut in 2022: 4.35%
Live Richer Podcast: Overcome Your Fear of Asking For the Raise You Deserve

24. Baltimore, Maryland
Median list price in 2022: $140,927
Median sale price in 2022: $134,048
Difference between list price and sale price: -$6,880
Average number of homes on the market in 2022: 984
Median days on market: 12
Percentage of listings with price cut: 17.36%
Median price cut in 2022: 4.41%
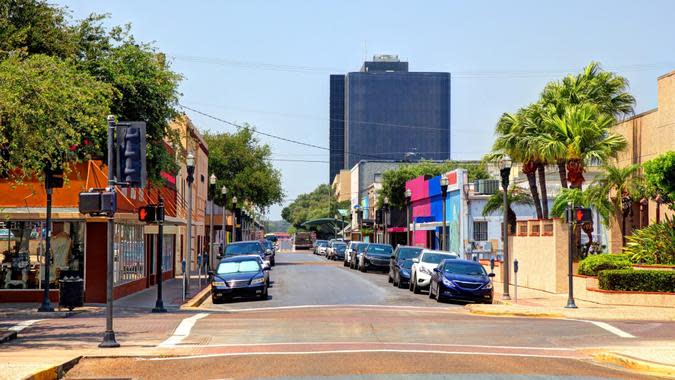
23. McAllen, Texas
Median list price in 2022: $243,908
Median sale price in 2022: $209,738
Difference between list price and sale price: -$34,170
Average number of homes on the market in 2022: 1,337
Median days on market: 27
Percentage of listings with price cut: 13.08%
Median price cut in 2022: 3.66%
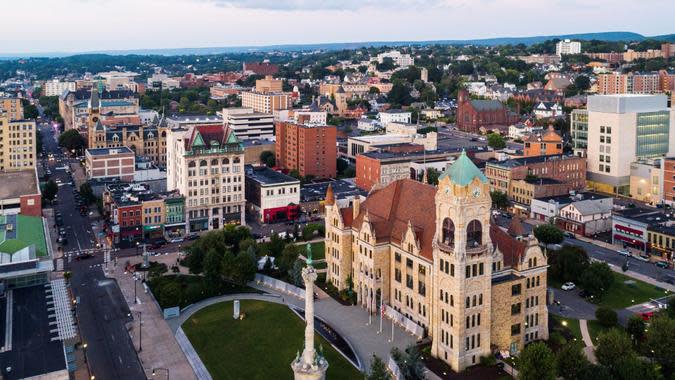
22. Scranton, Pennsylvania
Median list price in 2022: $184,463
Median sale price in 2022: $165,151
Difference between list price and sale price: -$19,312
Average number of homes on the market in 2022: 930
Median days on market: 11
Percentage of listings with price cut: 13.79%
Median price cut in 2022: 5.21%

21. Canton, Ohio
Median list price in 2022: $164,833
Median sale price in 2022: $160,445
Difference between list price and sale price: -$4,388
Average number of homes on the market in 2022: 743
Median days on market: 7
Percentage of listings with price cut: 15.90%
Median price cut in 2022: 5.39%

20. Boise, Idaho
Median list price in 2022: $556,652
Median sale price in 2022: $494,633
Difference between list price and sale price: -$62,018
Average number of homes on the market in 2022: 2,145
Median days on market: 11
Percentage of listings with price cut: 26.51%
Median price cut in 2022: 2.74%
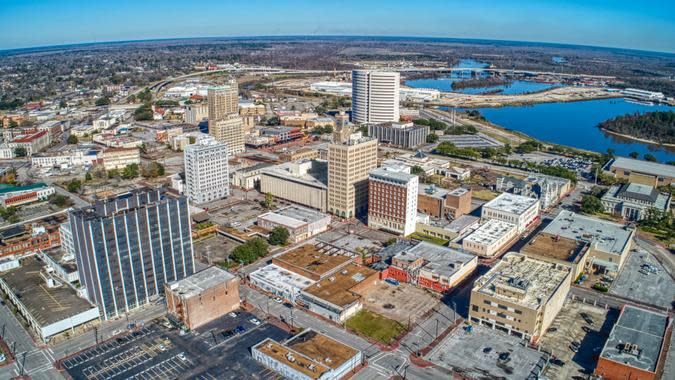
19. Beaumont, Texas
Median list price in 2022: $213,694
Median sale price in 2022: $200,369
Difference between list price and sale price: -$13,325
Average number of homes on the market in 2022: 1,200
Median days on market: 18
Percentage of listings with price cut: 20.03%
Median price cut in 2022: 3.78%
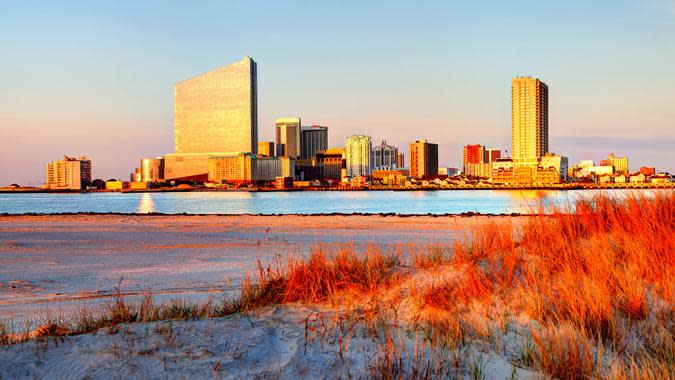
18. Atlantic City, New Jersey
Median list price in 2022: $319,532
Median sale price in 2022: $297,374
Difference between list price and sale price: -$22,158
Average number of homes on the market in 2022: 966
Median days on market: 22
Percentage of listings with price cut: 13.11%
Median price cut in 2022: 4.45%

17. Bridgeport, Connecticut
Median list price in 2022: $740,758
Median sale price in 2022: $627,486
Difference between list price and sale price: -$113,273
Average number of homes on the market in 2022: 1,797
Median days on market: 20
Percentage of listings with price cut: 12.47%
Median price cut in 2022: 4.13%

16. Chicago, Illinois
Median list price in 2022: $312,249
Median sale price in 2022: $299,143
Difference between list price and sale price: -$13,107
Average number of homes on the market in 2022: 22,955
Median days on market: 12
Percentage of listings with price cut: 18.70%
Median price cut in 2022: 3.14%
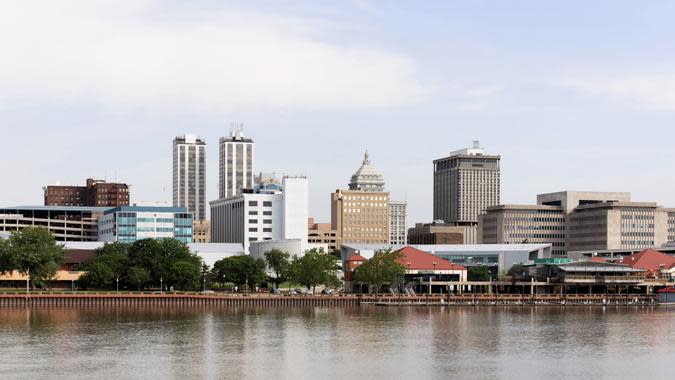
15. Peoria, Illinois
Median list price in 2022: $124,973
Median sale price in 2022: $130,840
Difference between list price and sale price: $5,868
Average number of homes on the market in 2022: 1,138
Median days on market: 10
Percentage of listings with price cut: 20.67%
Median price cut in 2022: 4.56%
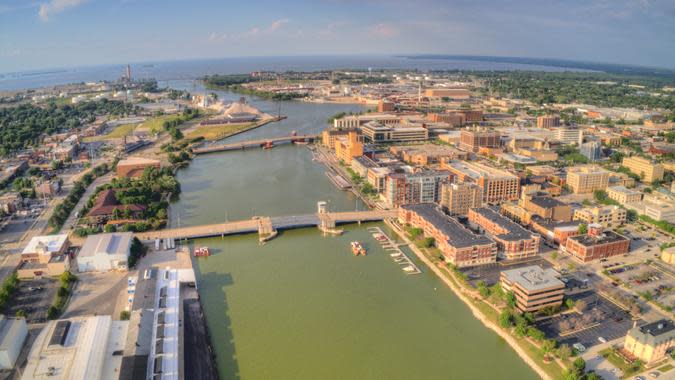
14. Green Bay, Wisconsin
Median list price in 2022: $252,411
Median sale price in 2022: $238,464
Difference between list price and sale price: -$13,946
Average number of homes on the market in 2022: 738
Median days on market: 43
Percentage of listings with price cut: 6.30%
Median price cut in 2022: 4.00%

13. Santa Maria, California
Median list price in 2022: $1,024,354
Median sale price in 2022: $761,976
Difference between list price and sale price: -$262,378
Average number of homes on the market in 2022: 464
Median days on market: 10
Percentage of listings with price cut: 12.70%
Median price cut in 2022: 4.04%

12. Flint, Michigan
Median list price in 2022: $156,277
Median sale price in 2022: $173,909
Difference between list price and sale price: $17,633
Average number of homes on the market in 2022: 1,018
Median days on market: 9
Percentage of listings with price cut: 19.54%
Median price cut in 2022: 5.06%
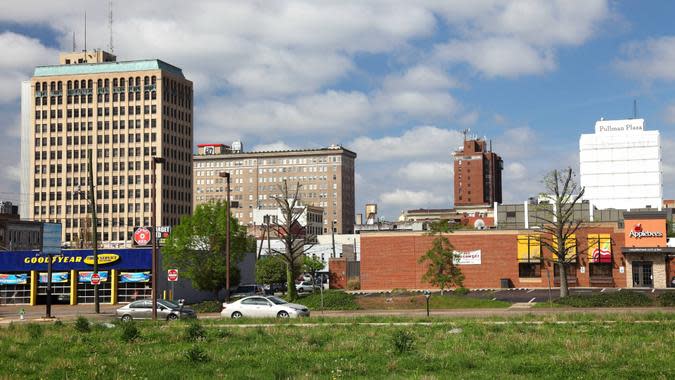
11. Huntington, West Virginia
Median list price in 2022: $160,633
Median sale price in 2022: $150,212
Difference between list price and sale price: -$10,422
Average number of homes on the market in 2022: 734
Median days on market: 15
Percentage of listings with price cut: 16.17%
Median price cut in 2022: 4.99%

10. Pittsburgh, Pennsylvania
Median list price in 2022: $203,746
Median sale price in 2022: $206,905
Difference between list price and sale price: $3,159
Average number of homes on the market in 2022: 5,054
Median days on market: 14
Percentage of listings with price cut: 18.80%
Median price cut in 2022: 4.46%

9. Miami, Florida
Median list price in 2022: $595,779
Median sale price in 2022: $483,191
Difference between list price and sale price: -$112,588
Average number of homes on the market in 2022: 12,577
Median days on market: 15
Percentage of listings with price cut: 14.93%
Median price cut in 2022: 3.71%
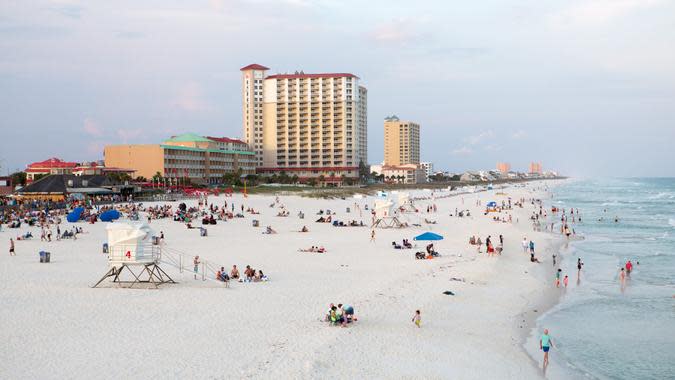
8. Pensacola, Florida
Median list price in 2022: $313,054
Median sale price in 2022: $285,514
Difference between list price and sale price: -$27,540
Average number of homes on the market in 2022: 1,710
Median days on market: 27
Percentage of listings with price cut: 17.61%
Median price cut in 2022: 3.62%

7. Naples, Florida
Median list price in 2022: $815,448
Median sale price in 2022: $674,524
Difference between list price and sale price: -$140,924
Average number of homes on the market in 2022: 1,577
Median days on market: 11
Percentage of listings with price cut: 19.54%
Median price cut in 2022: 3.89%
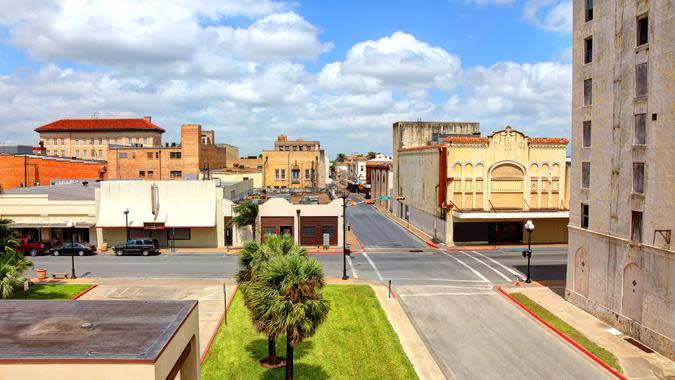
6. Brownsville, Texas
Median list price in 2022: $262,956
Median sale price in 2022: $223,167
Difference between list price and sale price: -$39,790
Average number of homes on the market in 2022: 534
Median days on market: 26
Percentage of listings with price cut: 12.57%
Median price cut in 2022: 4.69%

5. Binghamton, New York
Median list price in 2022: $160,775
Median sale price in 2022: $151,461
Difference between list price and sale price: -$9,314
Average number of homes on the market in 2022: 554
Median days on market: 18
Percentage of listings with price cut: 16.98%
Median price cut in 2022: 4.87%

4. Youngstown, Ohio
Median list price in 2022: $131,602
Median sale price in 2022: $135,107
Difference between list price and sale price: $3,505
Average number of homes on the market in 2022: 1,089
Median days on market: 13
Percentage of listings with price cut: 17.44%
Median price cut in 2022: 5.51%

3. Santa Cruz, California
Median list price in 2022: $1,278,167
Median sale price in 2022: $1,213,559
Difference between list price and sale price: -$64,607
Average number of homes on the market in 2022: 320
Median days on market: 14
Percentage of listings with price cut: 13.41%
Median price cut in 2022: 5.85%
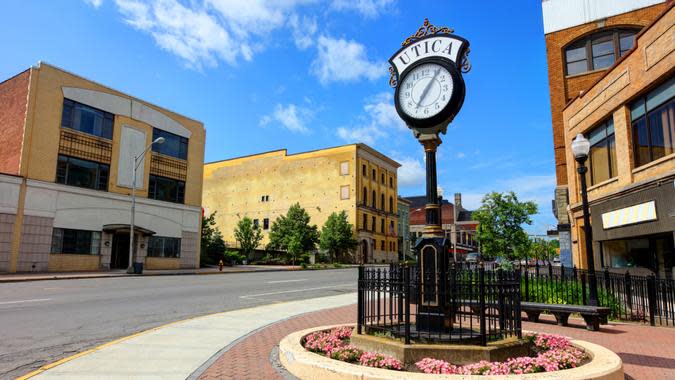
2. Utica, New York
Median list price in 2022: $179,979
Median sale price in 2022: $167,933
Difference between list price and sale price: -$12,046
Average number of homes on the market in 2022: 505
Median days on market: 20
Percentage of listings with price cut: 16.28%
Median price cut in 2022: 5.34%

1. New York, New York
Median list price in 2022: $617,454
Median sale price in 2022: $557,381
Difference between list price and sale price: -$60,073
Average number of homes on the market in 2022: 28,532
Median days on market: 28
Percentage of listings with price cut: 11.42%
Median price cut in 2022: 4.01%
More From GOBankingRates
Jordan Rosenfeld contributed to the reporting for this article.
Methodology: GOBankingRates analyzed the 190 largest metropolitan housing markets for which Zillow provides complete data to find the 25 hardest places to sell a home. GOBankingRates first found the 2022 average median list price and 2022 average median sale price for homes in each metropolitan area by averaging Zillow's monthly estimates of each figure for January through August 2022. Then, GOBankingRates calculated the (1) typical difference between the list and sale price for homes in each area in 2022. GOBankingRates then similarly analyzed Zillow's monthly estimates of other housing market metrics to find each metro area's (2) average housing market inventory in 2022, (3) 2022 average median number of days homes spent on the market, (4) 2022 average share of listings that took a price cut while on the market, and (5) 2022 average median price cut taken by homes on the market, measured as a percent of the prior list price. All cities were then scored against each other and ranked, with a larger difference between list and sale prices, larger housing market inventory, greater typical number of days spent on the market, greater share of listings taking a price cut, and larger price cuts taken indictaing places where it is more difficult to sell a home. Zillow's smoothed estimates for single family residences were used for all metrics. In the calculation of final scores, factor (2) was weighted half as heavily as all other factors. All data was compiled on and up to date as of September 27, 2022.
This article originally appeared on GOBankingRates.com: The 25 Hardest Places To Sell a Home