IGV: Further Upside Is Likely (Technical Analysis)

Summary
- A strong bullish outlook for IGV is evident with robust quarterly candles and a rebound from crucial key Fibonacci levels.
- To confirm a bullish breakout, IGV price needs to break above $315, and investors may consider buying the ETF on any correction as long as the $235 level holds.
- Long-term inflationary concerns and potential recession risks should be monitored closely by investors as they could impact the technology sector and IGV's performance.
Bet_Noire
The current economic landscape features a complex interplay of inflationary pressures, monetary policy, and consumer sentiment, all of which hold significant implications for the performance of the iShares Expanded Tech-Software Sector ETF (BATS:IGV). With the recent easing of inflationary pressures and the possibility of more accommodative monetary policies, the short-term outlook for IGV appears bullish, especially as the technology sector generally prospers in such environments. Nevertheless, investors must remain vigilant regarding the elevated long-term inflation outlook and the potential for consolidation and volatility. This article presents a technical analysis of IGV, utilizing a price action methodology on quarterly, monthly, and weekly charts, which unveils bullish patterns and anticipates price growth, contingent upon breaking key levels. The article extends the analysis from the previous piece in order to determine the forthcoming trends in the IGV market.
Current Economic Environment
The recent retreat of the Consumer Price Index (CPI) from its highs signals a potential short-term easing of inflationary pressures, which could prompt the Federal Reserve to adopt more accommodative monetary policies. This development is particularly advantageous for the IGV, as looser monetary conditions support growth and innovation in the technology sector. The looser monetary conditions reduce the cost of borrowing for businesses. The lower borrowing costs make it easier for technology companies to access capital for investment in research and development, product innovation, and business expansion. This increased access to funding can foster innovation and growth in the sector. In this context, IGV is well-positioned to benefit from any favorable shifts in the economic landscape, bolstering the bullish outlook for the ETF.
However, it is crucial to consider that the long-term inflation outlook remains elevated, and this could lead to periods of consolidation and heavy volatility for IGV. While the bullish implications of the current environment cannot be ignored, investors should be prepared for potential wide-ranging price fluctuations as the market grapples with the juxtaposition of short-term relief and long-term inflationary concerns. Despite these challenges, the overall outlook for IGV remains positive, and investors who can navigate the turbulence are likely to be rewarded in the long run.
The recent upswing in the University of Michigan's Consumer Sentiment Index, bouncing from 50 for the first time since the index began declining following the Covid-19 recession, carries bullish implications for the IGV. As consumer sentiment improves, so does the likelihood of increased consumer spending on technology products and services, which positively impact the growth and profitability of the companies within the technology sector. As a result, the shift in sentiment provides a tailwind for IGV, supporting its performance and potentially attracting more investors to the technology sector as optimism around economic recovery gains momentum.
University of Michigan's Consumer Sentiment index (fred.stlouisfed.org)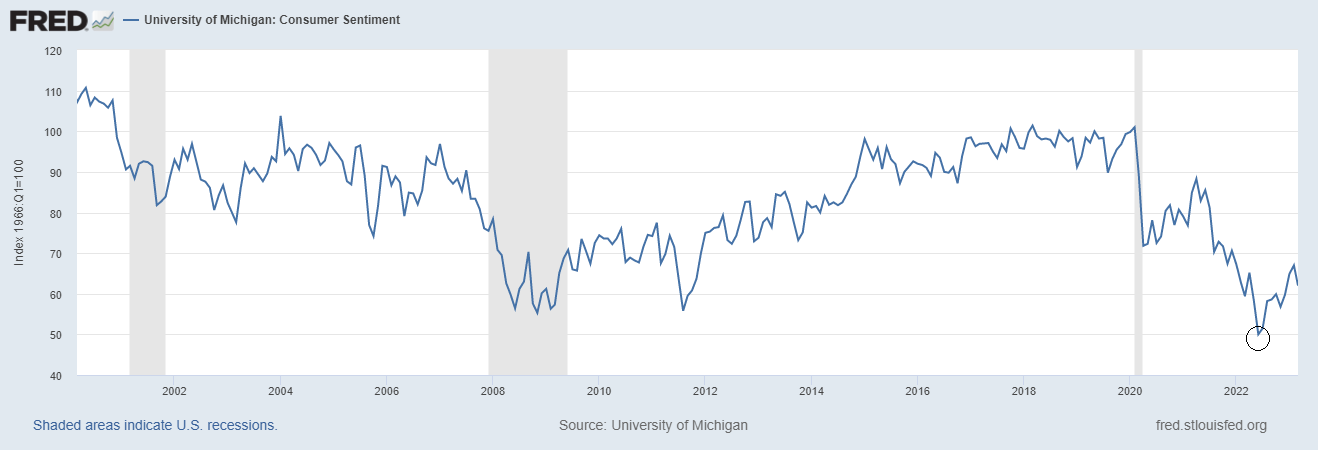
Bullish Prospects for IGV
Previous Discussion
In a previous article, the bullish outlook for IGV was examined using technical analysis, which identified strong support and inflection points. The discussion highlighted that a price break from $280 would likely propel the price toward the $300 to $310 range. As expected, the price successfully broke through the $280 level and reached $305.63, which falls within the aforementioned range. This level also serves as strong resistance, coinciding with the resistance from the neckline of the head and shoulders pattern.
Present Outlook
Given the strong rebound from the trendline support region, the long-term outlook for IGV can be assessed using the quarterly chart below. This chart reveals a robust bullish outlook for IGV, with the price accelerating higher in a parabolic manner. Parabolic price increases often bring significant volatility, leading to substantial corrections along the way. The 47.54% decline in IGV's price from its 2021 high of $448.75 to its 2022 low of $235.41 is considered normal and signifies a healthy market. The last quarter of 2022 displayed a beautiful reversal from support, and the first quarter of 2023 exhibited a strongly bullish candle, closing at its highs. This price action over the past six months suggests strong bullish momentum, supporting a bullish view of the market.
IGV Quarterly Chart (stockcharts.com)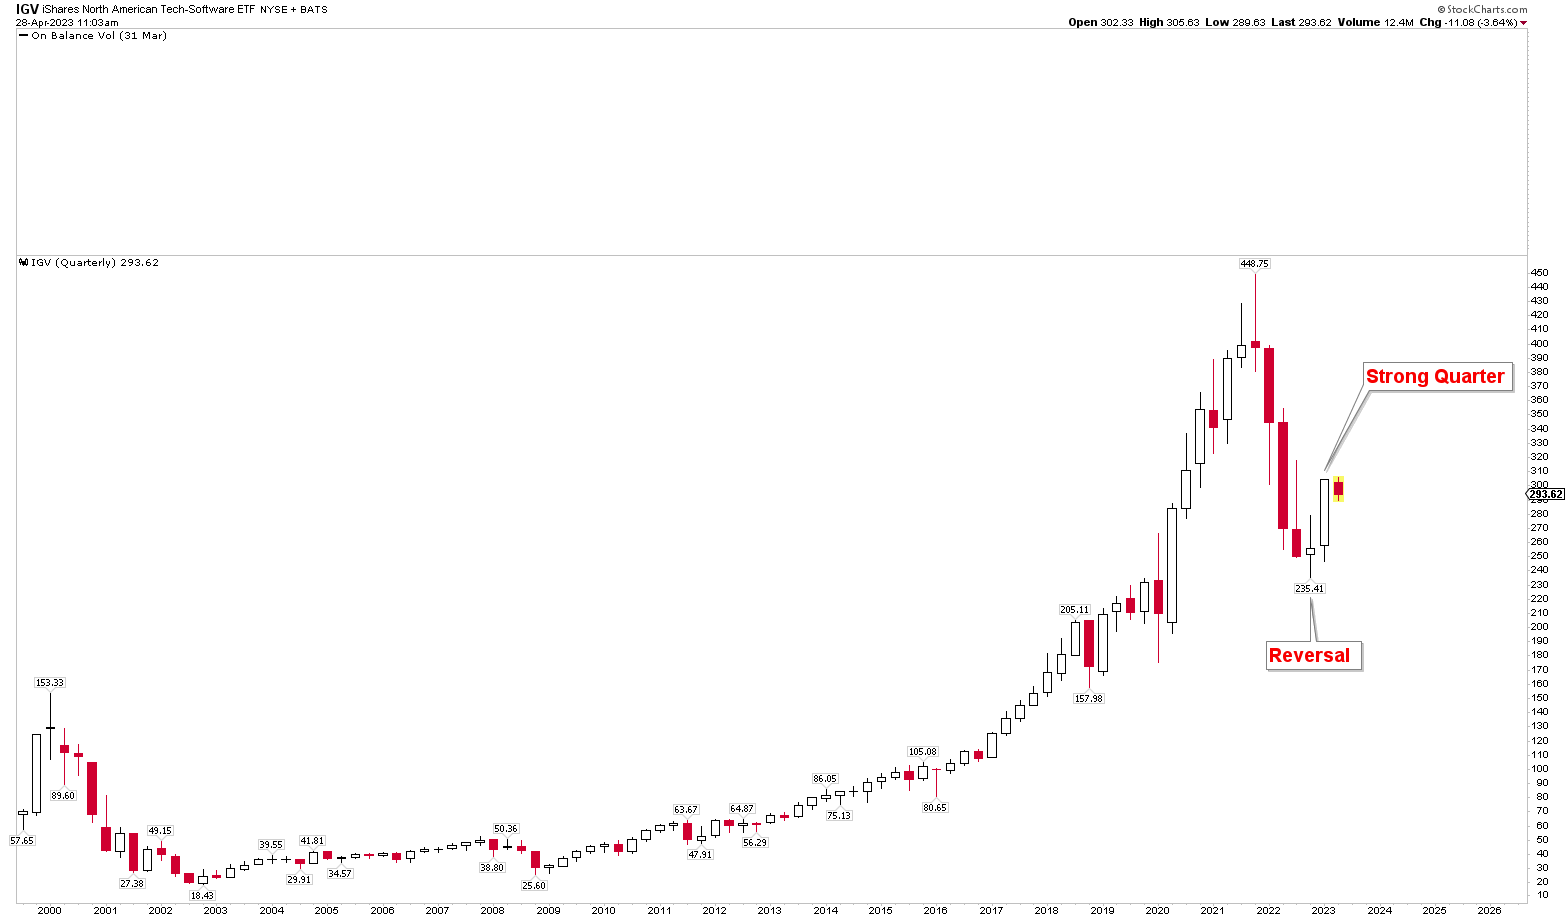
To further comprehend the IGV outlook, the monthly chart below showcases the key Fibonacci levels in the market. These levels are drawn from the November 2008 lows of $25.60 to the November 2021 highs of $448.75. The chart reveals that the price found support at the 50% retracement level and rebounded forcefully to break above the 38.2% retracement level. The monthly candle for March 2023 closed above the 38.2% level, indicating a breakout. The April 2023 candle is also poised to close above this level, confirming the breakout. Additionally, the April 2023 candle appears to be an inside bar, with its price range falling within that of March 2023, suggesting price compression in the market. This compression implies that if the price breaks out above the highs of April 2023, it is likely to continue rising with high acceleration toward higher levels. The RSI is currently trading at the mid-level of 50, presenting resistance at current levels. To further strengthen the bullish outlook for IGV, the RSI must start closing above 50.
IGV Monthly Chart (stockcharts.com)
What's Next?
The subsequent outlook for IGV is discussed using the weekly chart, which still exhibits consolidation within wide ranges. The chart below displays a rising channel marked by a red dotted line, with $235 serving as the trendline support, from which the IGV price successfully bounced. This bounce has brought the price towards the neckline of the head and shoulders pattern, situated between the $300-$310 range. However, the current level of this red neckline lies at $315. To confidently consider a bullish breakout targeting higher levels, the IGV price must close above $315.
IGV Weekly Chart (stockcharts.com)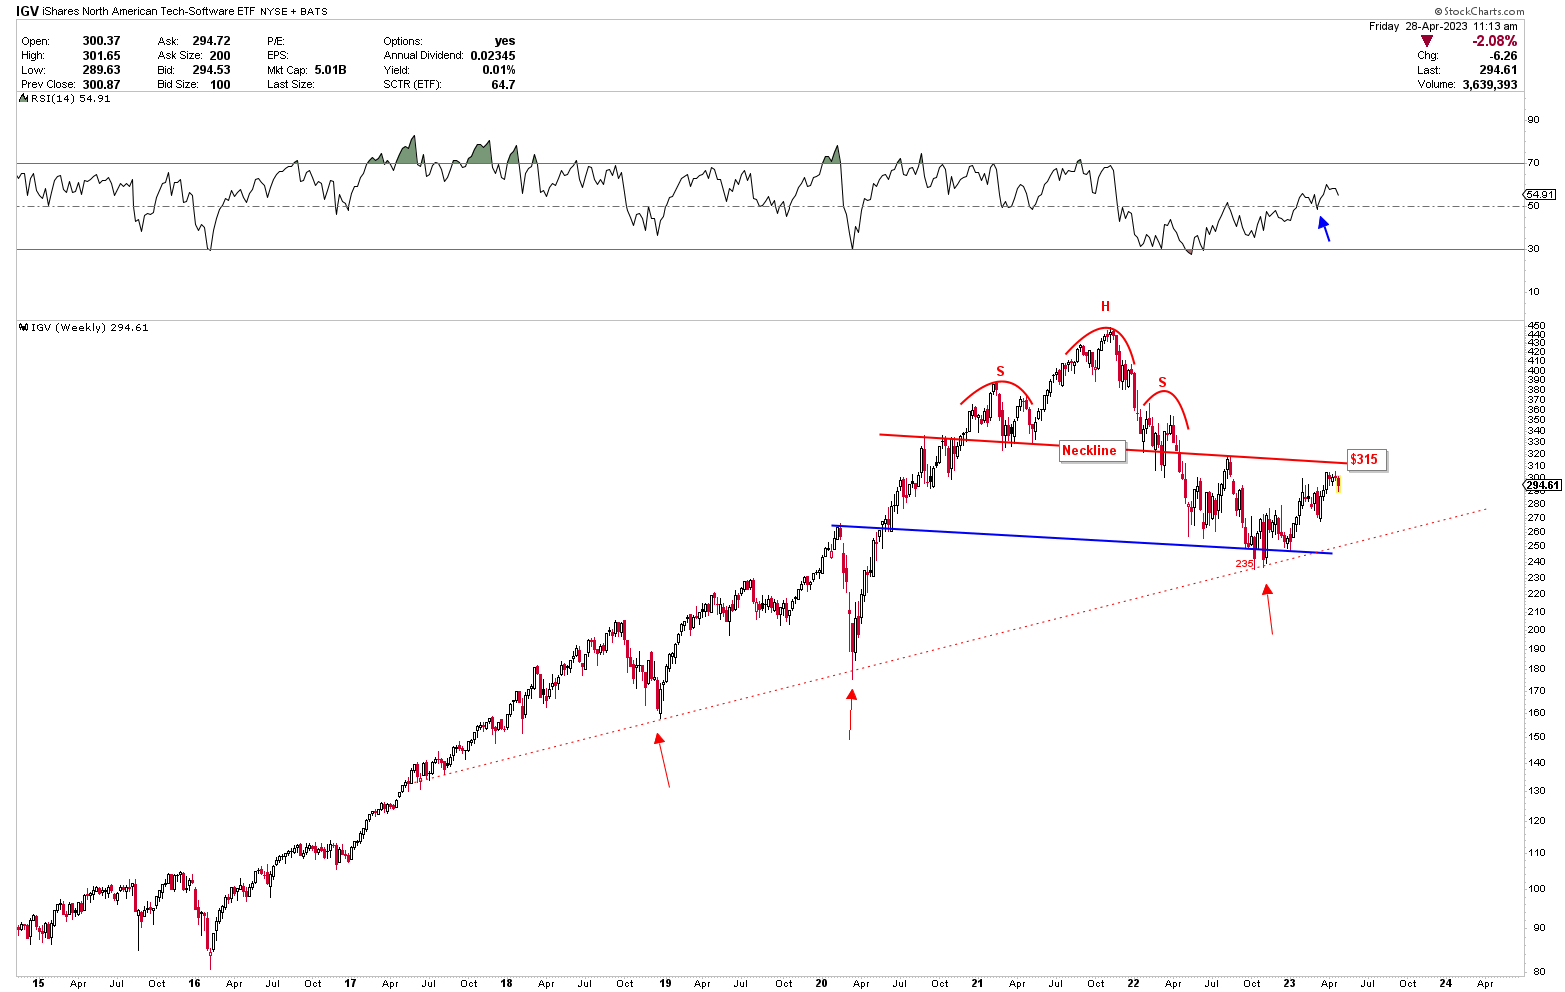
As previously discussed, the price has found support as anticipated and is now trading at the inflection point where a breakout above $315 is required. The quarterly and monthly charts discussed above depict a strong bullish price pattern, suggesting that the price is likely to break higher. The current trading range is bounded by the red and blue lines, between $235 and $315. A break of either level will trigger the next move. Investors may consider buying on any correction in the IGV market, with the 38.2% Fibonacci retracement level serving as strong support in the market.
Market Risk
As technical analysis suggests bullish implications for IGV, the potential recession in 2023 introduces risks to the IGV market. The ETF may face challenges if the broader economy undergoes a downturn. Recessions typically result in reduced consumer spending, lower corporate investment, and tighter financial conditions, all of which can negatively impact the technology sector and, consequently, IGV. During economic downturns, consumers often cut back on discretionary spending, potentially leading to decreased demand for technology products and services. This decline can affect the revenue and profitability of companies within the tech sector, potentially causing a drop in IGV's value. Moreover, recessions often prompt companies to reduce investments in technology infrastructure and software as they seek to cut costs and conserve cash. This decrease in spending can adversely impact IGV's performance, as many of its constituent companies rely heavily on revenues generated from sales to other businesses.
While technical analysis currently supports the price at a strong support region, it is crucial to note that if IGV fails to break above $315 and instead falls below $235, bearish pressure in the market could negate the short-term bullish momentum. Therefore, investors should closely monitor these key levels to mitigate investment risks.
Conclusion
In conclusion, despite the potential challenges posed by long-term inflationary concerns, IGV stands to benefit from the current economic environment marked by the short-term easing of inflationary pressures, accommodative monetary policies, and improving consumer sentiment. The technical analysis reveals a robust bullish outlook for IGV, bolstered by strong quarterly candles and a rebound from crucial Fibonacci levels. A break above $315 is needed to confirm a bullish breakout, and given the price action observed in the quarterly and monthly charts, the likelihood of upward momentum for IGV is significant. Investors may consider buying the ETF on any correction, provided the $235 level remains intact. A breakout above $315 could pave the way for higher prices.
This article was written by

Analyst’s Disclosure: I/we have no stock, option or similar derivative position in any of the companies mentioned, and no plans to initiate any such positions within the next 72 hours. I wrote this article myself, and it expresses my own opinions. I am not receiving compensation for it (other than from Seeking Alpha). I have no business relationship with any company whose stock is mentioned in this article.
Seeking Alpha's Disclosure: Past performance is no guarantee of future results. No recommendation or advice is being given as to whether any investment is suitable for a particular investor. Any views or opinions expressed above may not reflect those of Seeking Alpha as a whole. Seeking Alpha is not a licensed securities dealer, broker or US investment adviser or investment bank. Our analysts are third party authors that include both professional investors and individual investors who may not be licensed or certified by any institute or regulatory body.