HPS: Paying More Than It Earns

Summary
- The HPS fund focuses on preferred equities and corporate bonds.
- It pays an attractive 9.4% distribution yield.
- However, like its sibling funds HPI and HPF, it does not earn its distribution with 5 and 10Yr average annual returns of 1.6% and 4.3%.
- For investors considering the preferred shares asset class, I would recommend the passive VRP ETF instead.
Torsten Asmus
A few months ago, I wrote articles reviewing the John Hancock Preferred Income Fund (HPI) and the John Hancock Preferred Income Fund II (HPF). Overall, my view on the John Hancock preferred income funds were not favourable. In my opinion, both HPI and HPF are amortizing 'return of principal' funds that do not earn their distributions. To round out my analysis, I have decided to review the John Hancock Preferred Income Fund III (NYSE:HPS), to determine whether it shares the same problems as its sibling funds.
Fund Overview
The John Hancock Preferred Income Fund III is a closed-end fund ("CEF") focused on high current income from a portfolio of preferred stocks and preferred convertible securities.
The HPS fund is managed by the same team behind HPI and HPF (Figure 1). However, it is the largest of the three funds with $428 million in net assets. The HPS fund uses leverage to enhance returns. As of March 31, 2023, the fund's effective leverage is 39.2%. The fund charged a 1.81% net expense ratio in fiscal 2022.
Figure 1 - HPS managed by the same team behind HPI and HPF (jhinvestments.com)
Portfolio Holdings
The HPS fund has 129 positions with an effective duration of 3.2 years. Figure 2 shows the fund's asset allocation as of March 31, 2023. 42% of the fund was invested in corporate bonds and 56% was invested in preferred stocks. HPS's asset allocation is very similar to its sibling funds HPF and HPI.
Figure 2 - HPS asset allocation (jhinvestments.com)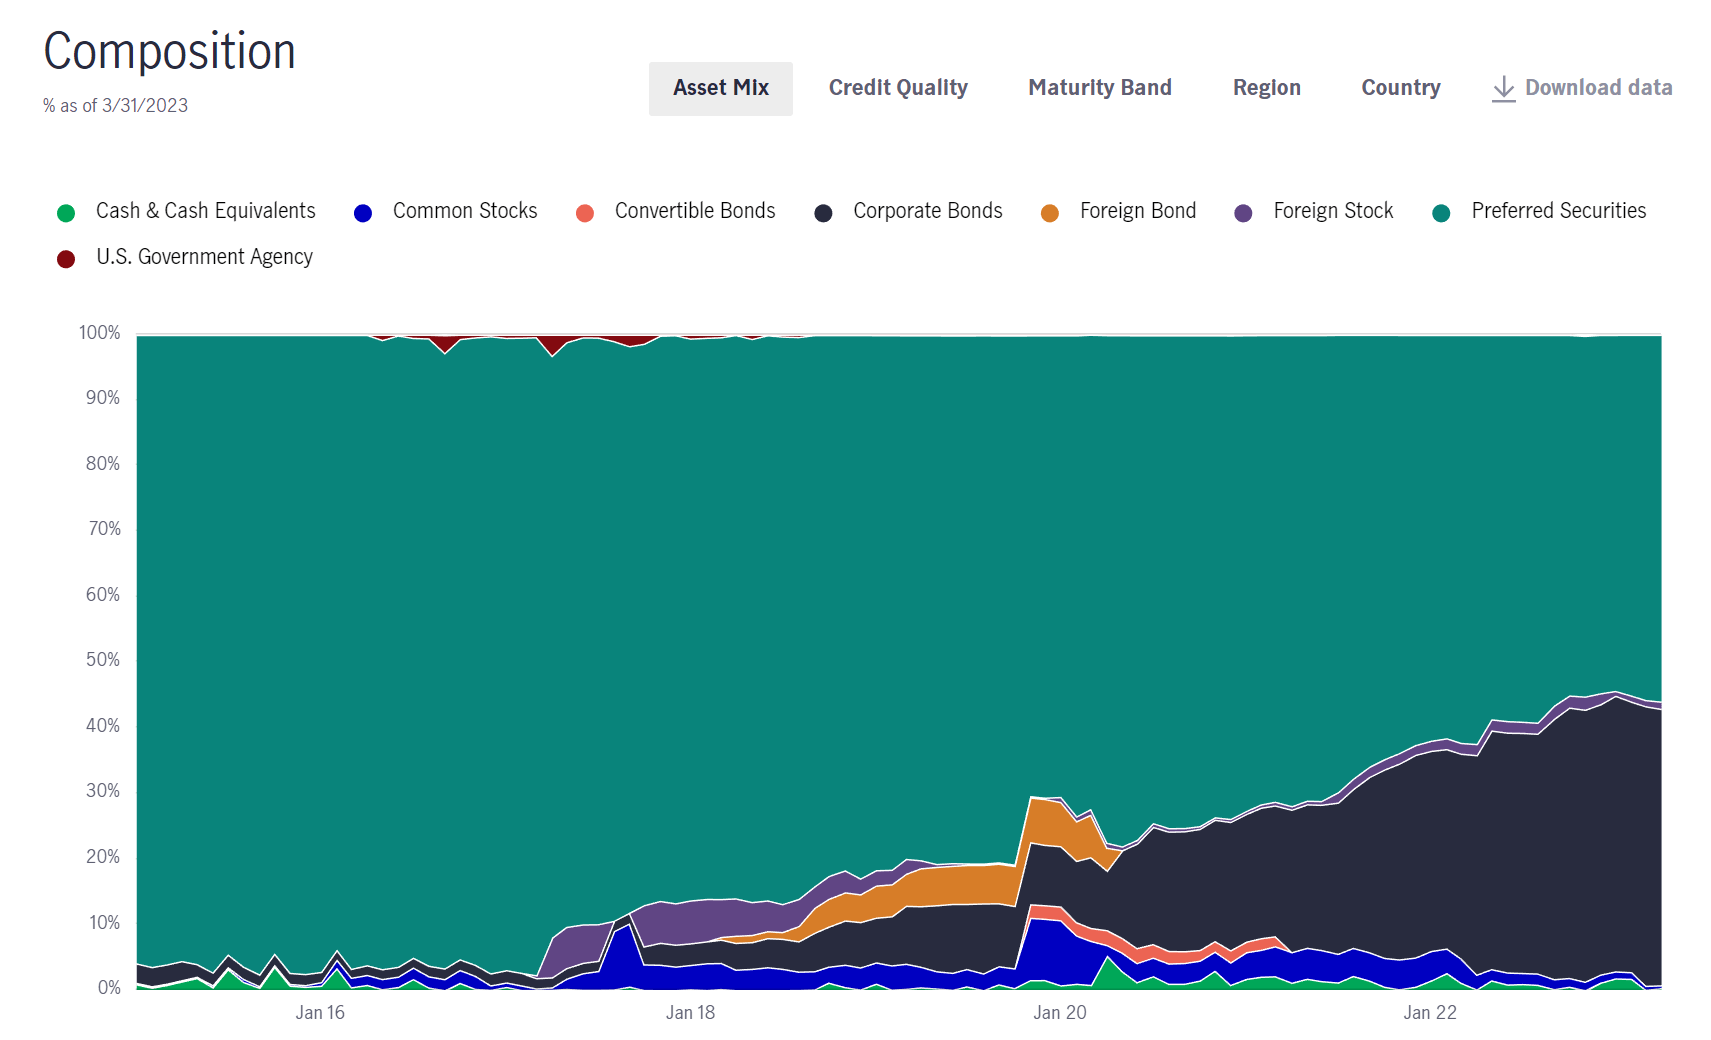
The fund's 10 largest issuers are shown in Figure 3. Overall, these comprise 56.8% of the fund, which is fairly concentrated.
Figure 3 - HPS largest issuers (jhinvestments.com)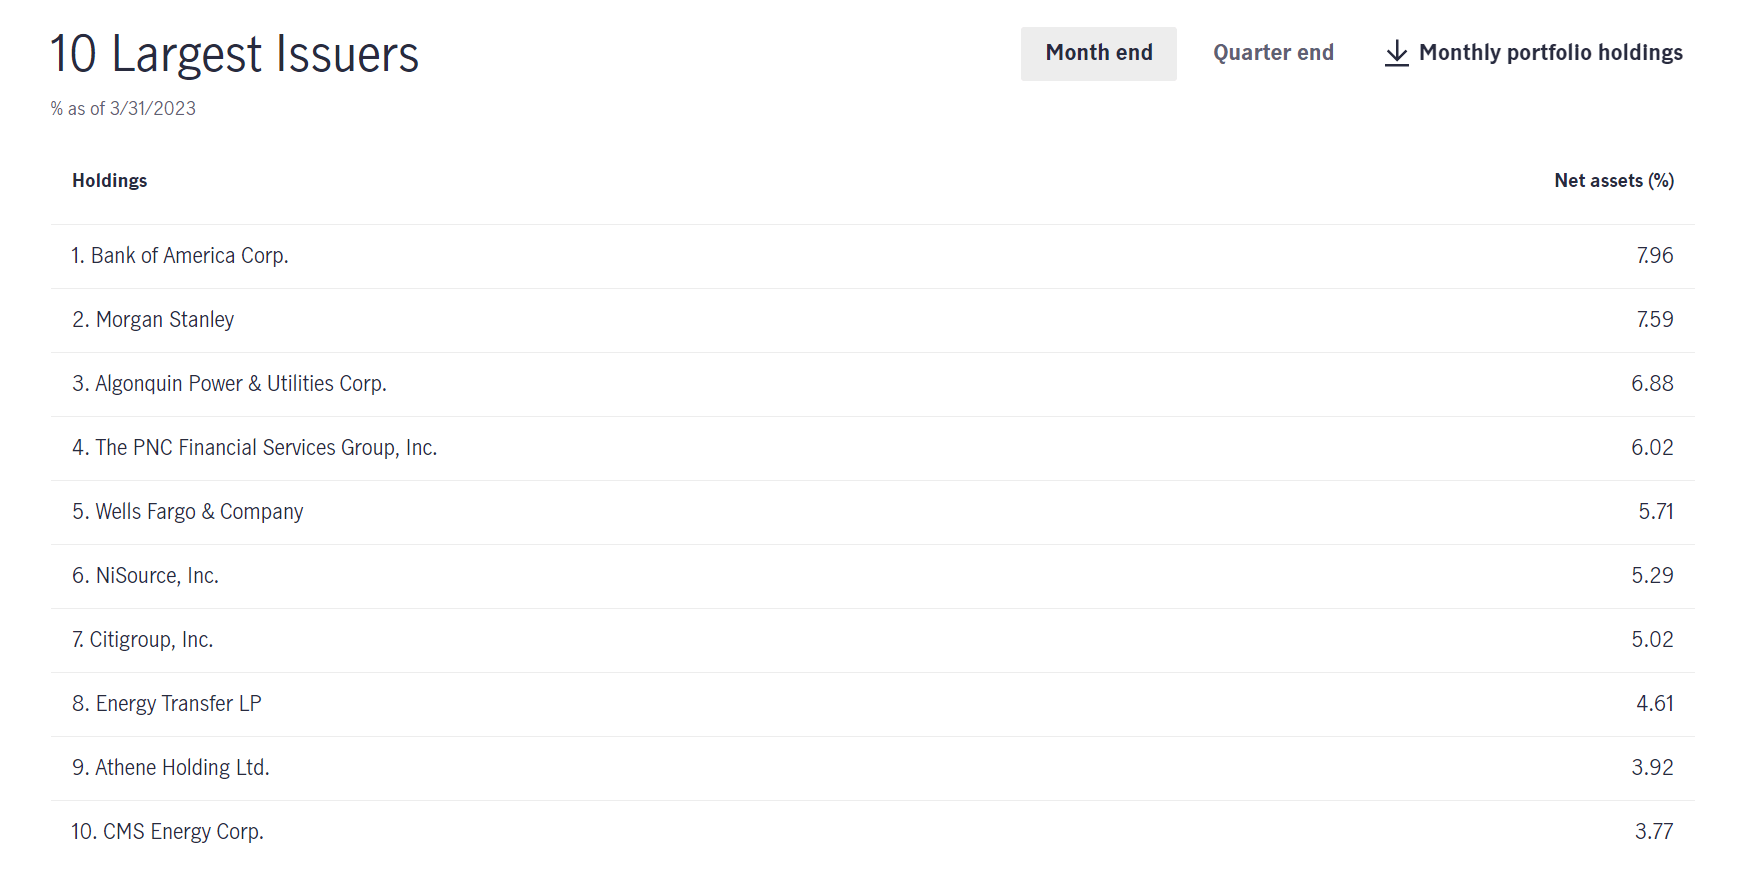
Returns
Historically, the HPS fund has delivered very modest returns, with 3/5/10/15Y average annual returns of 8.5%/1.6%/4.3%/6.1% respectively to March 31, 2023 (Figure 4).
Figure 4 - HPS historical returns (morningstar.com)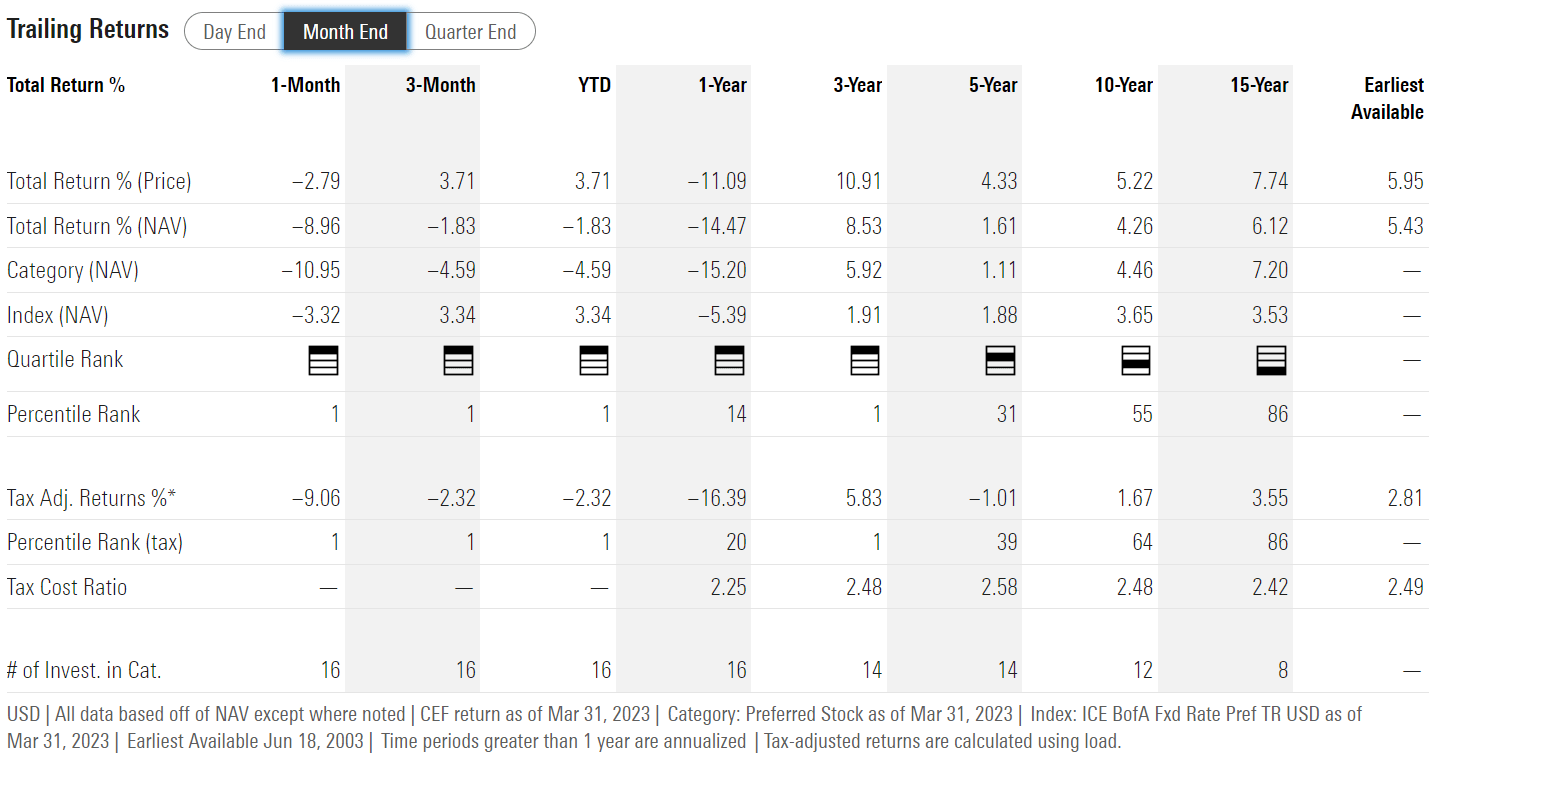
Investors should note that the 3Yr number may be flattered by the starting period, March 2020, which coincided with the bottom of the COVID pandemic. I believe longer-term 5 and 10Yr average annual returns is more representative of HPS' earnings potential.
Distribution & Yield
The HPS fund pays a generous monthly distribution of $0.11 which annualizes to a 9.4% forward yield. On NAV, the HPS fund is yielding 9.9%.
Like its sibling funds HPI and HPF, the HPS fund has used return of capital ("ROC") to fund part of its annual distribution (Figure 5).
Figure 5 - HPS financial summary (HPS 2023 semi-annual report)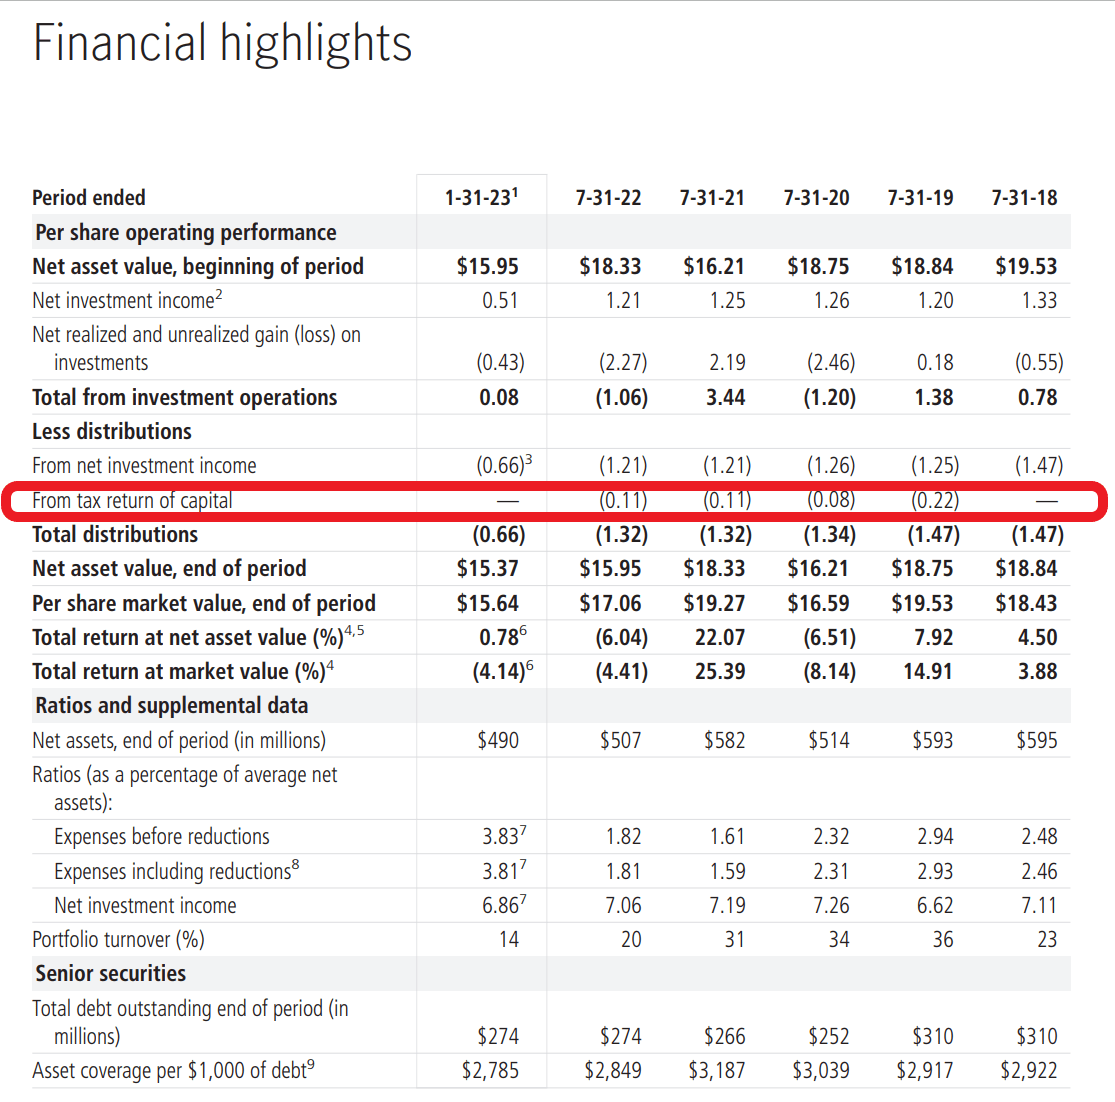
Given its generous 9.9% of NAV distribution but mediocre long-term returns of 1.6% over 5 years and 4.3% over 10 years, the HPS fund appears to be yet another amortizing 'return of principal' fund that does not earn its distribution.
While HPS' NII shortfall relative to its distribution is not huge at $0.11 or 8.3% in fiscal 2022, investors could lose in other ways without even realizing it. The best measure of whether a fund earns its distribution is to look at the fund's long-term NAV performance. A high-yielding fund that earns its distribution should have a flat to rising NAV over time. Unfortunately, the HPS fund has a negative trending NAV (Figure 6).
Figure 6 - HPS has a negative trending NAV (morningstar.com)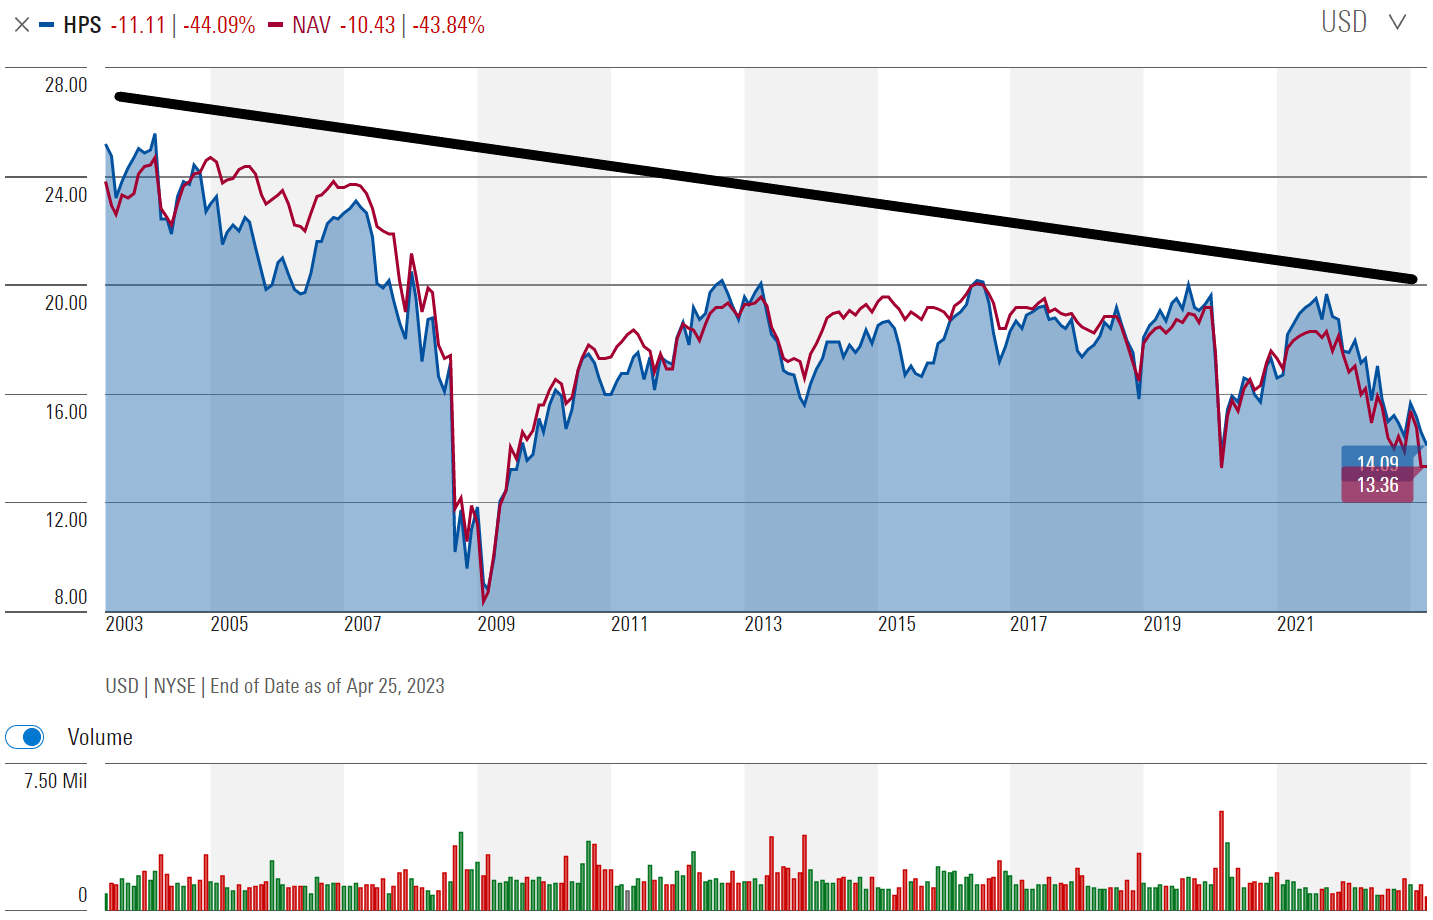
HPS's distribution history also confirms my concerns, as the fund's distribution has shrunk from $2.14 / share in 2004 when the fund was first launched to $1.32 since 2020 (Figure 7).
Figure 7 - HPS has cut its distribution over time (Seeking Alpha)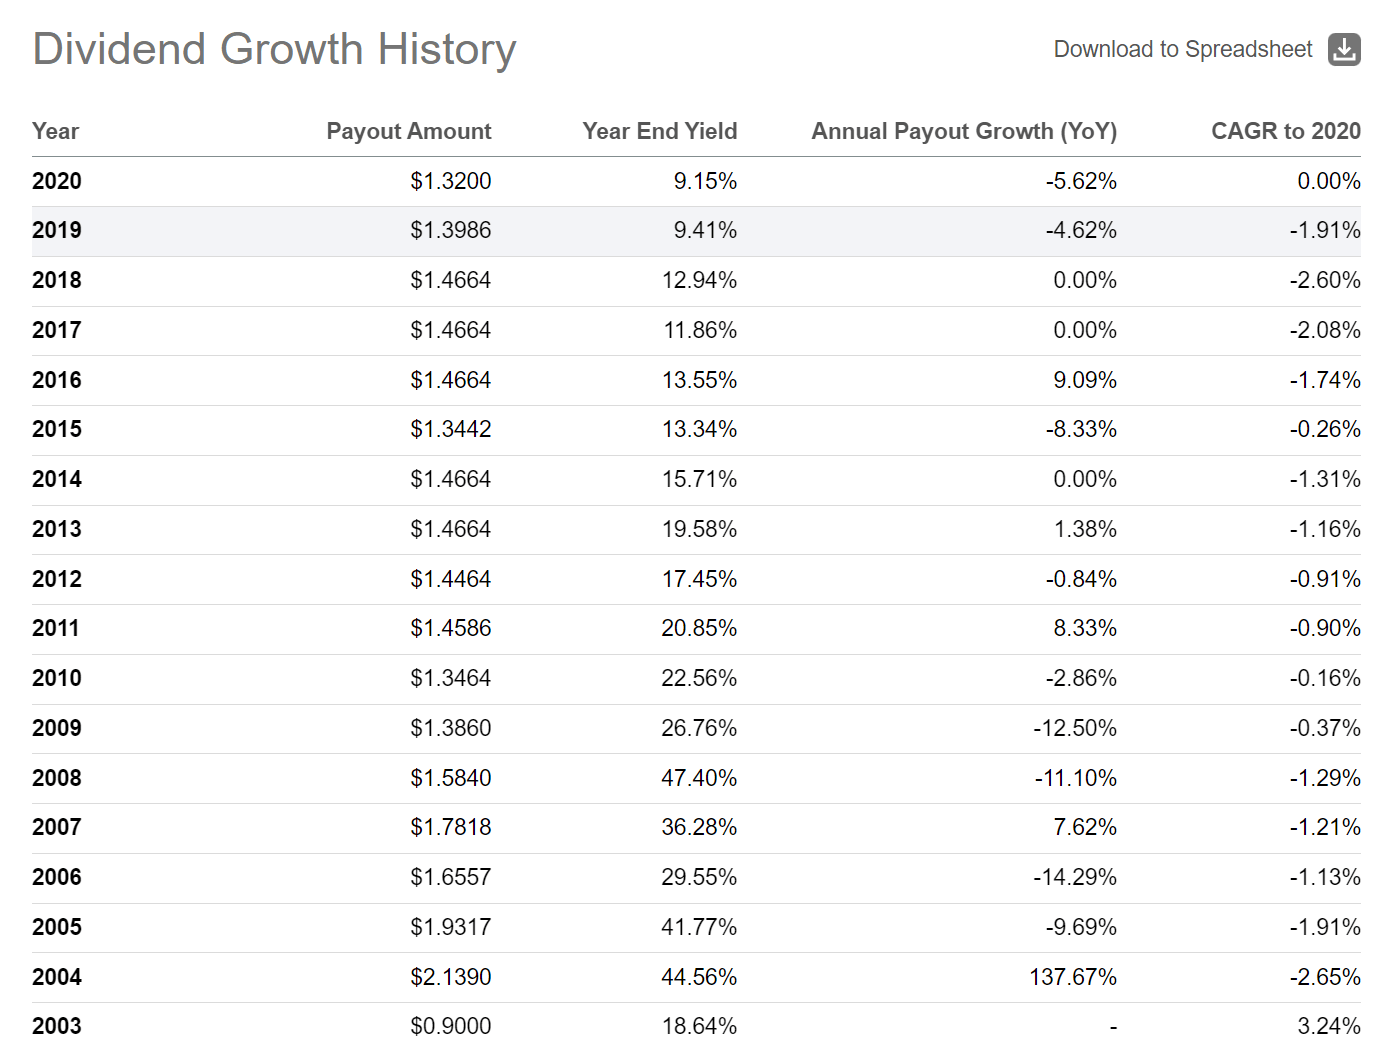
Long-term investors in HPS have ended up losing both principal and income.
Updated Peer Comparison
In addition to analyzing funds by themselves, I often compare funds using a proprietary 'scorecard' that lines up the important returns and risk metrics between different funds for easy comparison and contrast (Figure 8).
Figure 8 - HPS vs. peers (Author created with data from Morningstar, Seeking Alpha, and company reports)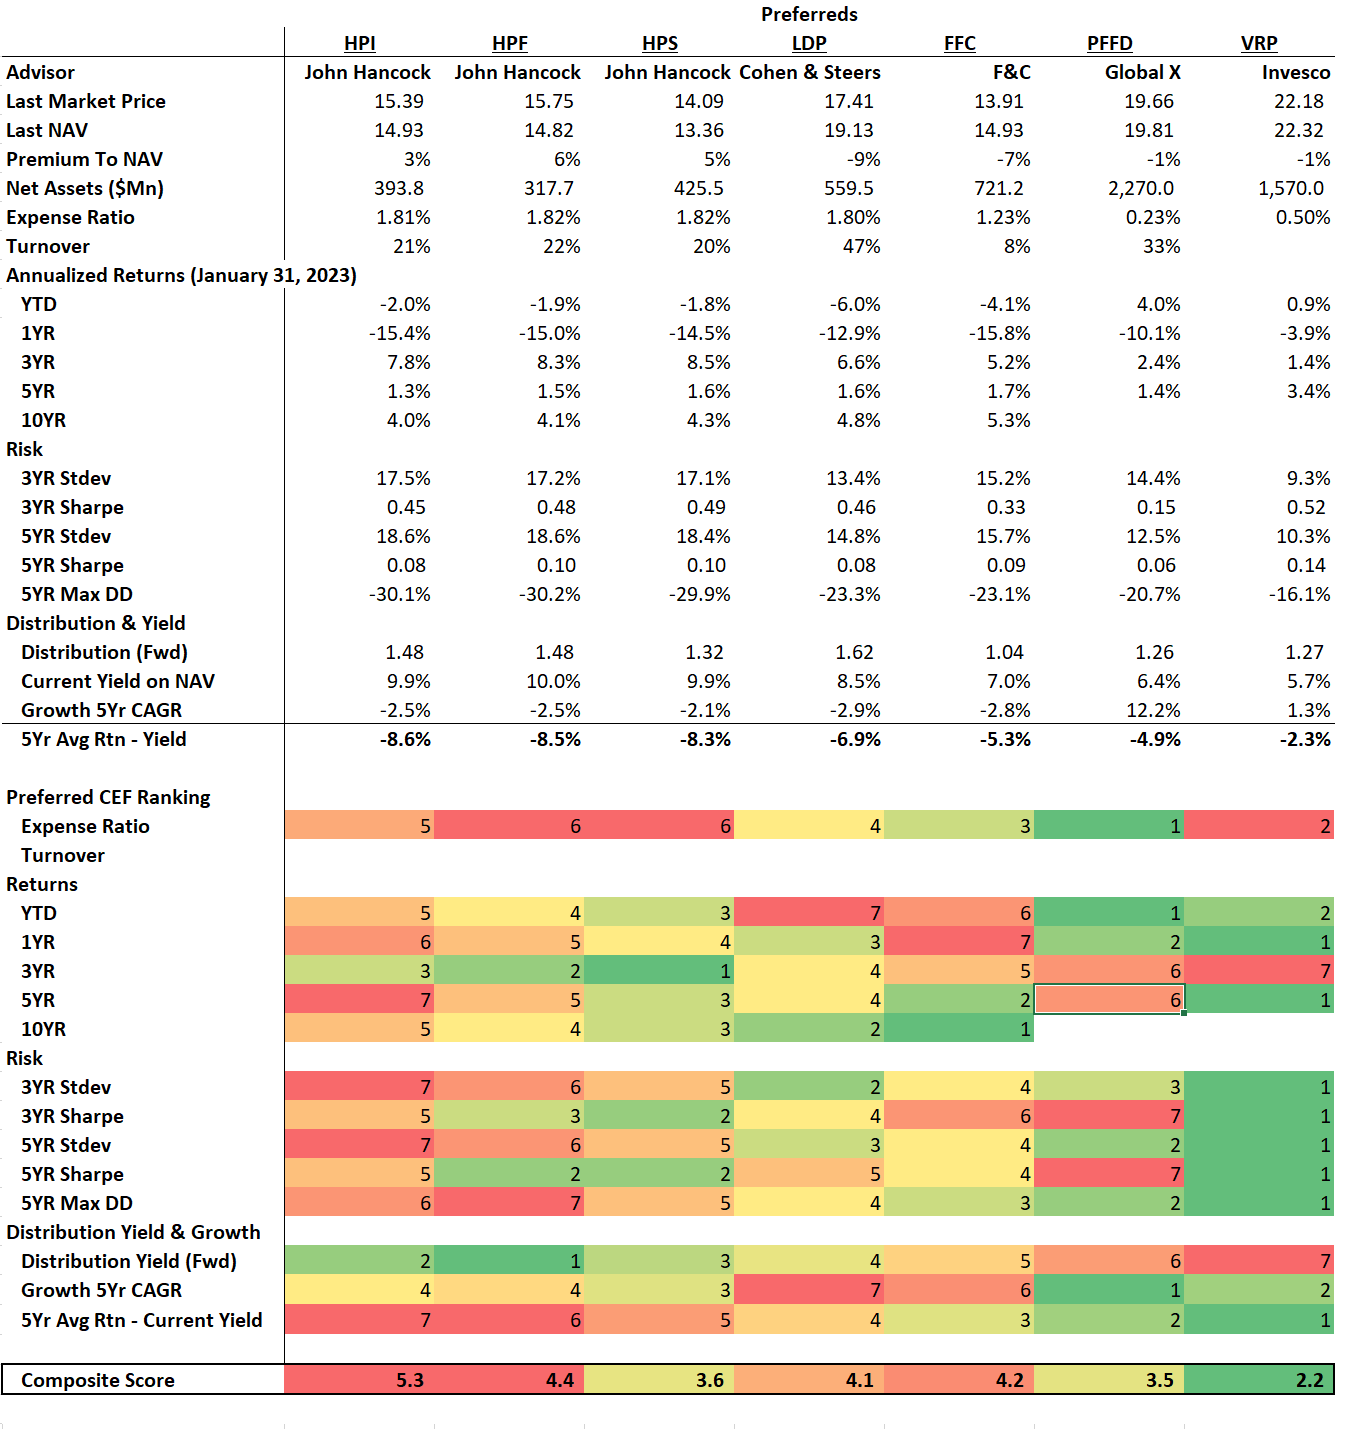
The three John Hancock preferred income funds all perform similar to each other, with the HPS fund delivering slightly higher returns and slightly lower volatility. However, investors should note that compared to peers, the John Hancock funds have much higher volatilities.
Returns-wise, the active CEFs all have similar long-term returns, with 5-Yr average annual returns clustered around 1.5% p.a. In contrast, the passive Invesco Variable Rate Preferred ETF (VRP) has a 5-Yr average annual return of 3.4%. This result is because the VRP ETF did not have as large a decline as the active CEFs in 2022 due to the floating rate nature of its returns. Fixed rate preferred equities trade like bonds and declined in price when interest rates rose.
Although the John Hancock funds pay the highest distribution yields, they also have the largest gap between their distribution rates as a % of NAV versus their 5-Yr average annual returns of the fund.
Overall, I find the HPS fund performs slightly better than its siblings,. However, in terms of overall returns and risk, it lags behind the passive VRP ETF.
Conclusion
As I suspected, the John Hancock Preferred Income Fund III is another amortizing 'return of principal' fund characterized by high distribution yields that outpace its average annual total return. Compared to its sibling funds HPI and HPF, the HPS fund does perform slightly better in terms of returns and risk. However, all the active CEFs focused on preferred shares underperform the passive VRP ETF.
This article was written by

Analyst’s Disclosure: I/we have no stock, option or similar derivative position in any of the companies mentioned, and no plans to initiate any such positions within the next 72 hours. I wrote this article myself, and it expresses my own opinions. I am not receiving compensation for it (other than from Seeking Alpha). I have no business relationship with any company whose stock is mentioned in this article.
Seeking Alpha's Disclosure: Past performance is no guarantee of future results. No recommendation or advice is being given as to whether any investment is suitable for a particular investor. Any views or opinions expressed above may not reflect those of Seeking Alpha as a whole. Seeking Alpha is not a licensed securities dealer, broker or US investment adviser or investment bank. Our analysts are third party authors that include both professional investors and individual investors who may not be licensed or certified by any institute or regulatory body.