SDY: Dividend Aristocrats Sag Vs. SPX This Year, Waiting For Better Days

Summary
- The high-dividend factor has been weak compared to the broad market this year after a stellar 2022.
- I see SDY as a hold - the valuation is not overly compelling while the technicals are also unimpressive.
- A return to the value trade would be a boon to SDY investors, but growth remains firm in 2023.
courtneyk
The growth trade continues to work in 2023. Top-performing factors include IPO names (those that went public in 2020 through 2021), large-cap growth (dominated by mega-cap tech), and simply the growth factor.
High-dividend equities have been lackluster - underperforming the S&P 500 by about 8% year-to-date. I now have a hold rating on SDY after issuing a sell rating on the fund in July last year.
Factor Returns Year-To-Date
Koyfin Charts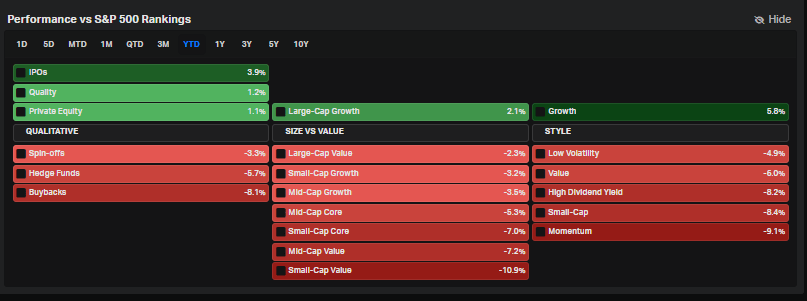
According to the issuer, the SPDR S&P Dividend ETF (NYSEARCA:SDY) offers investors exposure to the highest-yielding stocks in the S&P Composite 1500 Index via tracking the S&P High Yield Dividend Aristocrats Index. The fund follows a passively managed approach whereby it owns shares of firms that have a history of increasing dividends every year for at least 20 consecutive years. Stocks within the Index are weighted by indicated yield (annualized gross dividend payment per share divided by price per share) and weight-adjusted each quarter.
SDY features a modest 0.35% annual expense ratio, and the fund has a long track record with its November 2005 inception. Holding 121 individual stocks with a 3-5-year EPS growth rate of just under 7%, there's diversification along with a value tilt with SDY. The forward price-to-earnings ratio is under 17, a slight discount to the S&P 500's P/E a bit above 18.
The weighted-average market cap of the fund is $60.2 billion as of April 26, 2023, according to SSGA funds. Total assets are high at more than $22 billion while typical daily volume is near 300,000 shares per day. Tradeability is strong with the ETF as evidenced by its low two basis point 30-day median bid/ask spread. Lastly, the dividend yield is 2.57% - significantly above the rate of the S&P 500.
Digging into the portfolio, data from Morningstar show that there's further diversification with SDY when x-raying the style box. While light on growth, there's significant blend exposure along with owning large, mid, and small caps. While leaning value on the style factor profile, the quality of the firms is somewhat low, but volatility is also modest.
SDY: Portfolio & Factor Profiles
Morningstar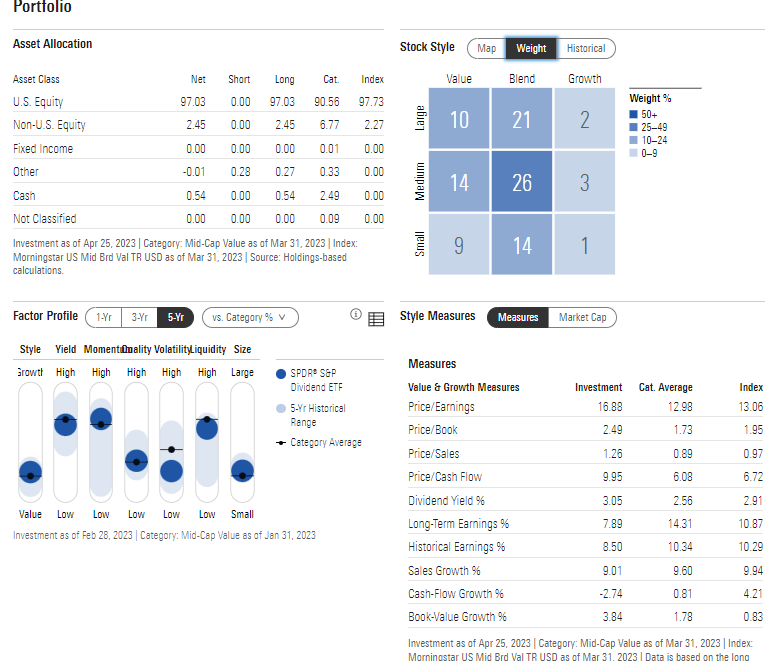
Cyclicals and defensive sectors are the largest weights. The so-called TMT sectors (tech, media, telecom) sum to less than 10%. High-growth sectors make up more than 40% of the SPX, so this is where SDY really differs from the broad market. Should growth lead, SDY will likely steeply underperform. And we have seen that this year, but SDY boasted strong alpha in 2022.
SDY Sector Weights
SSGA Funds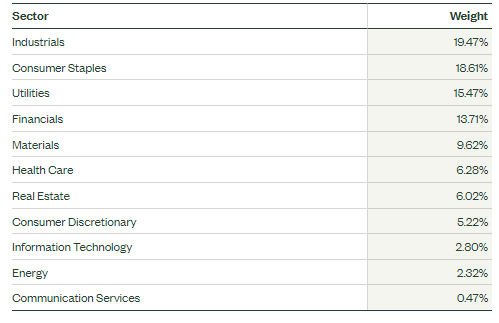
Large-cap U.S. dividend equities tend to perform poorly to the broader market from early May through the middle of July, so short-term traders should take caution if history is any guide, according to data from Equity Clock.
SDY: Bearish Near-Term Relative Seasonal Trends
Equity Clock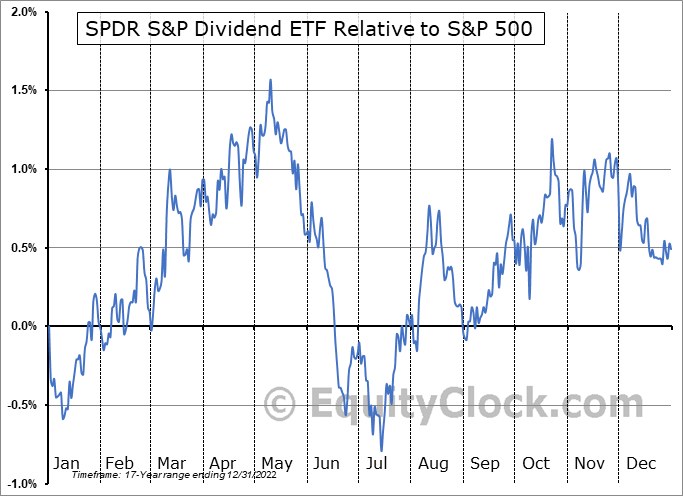
The Technical Take
SDY's chart shows a protracted trading range. The share price has ranged from $110 to $133 for the last two years. The fund tested and held its pre-COVID high of $109 at its October 2022 nadir, but the bulls have not been able to get the ETF above highs notched during the first half of last year. With a very flat long-term 200-day moving average, notice how the RSI momentum indicator at the top of the chart shows declining momentum as the trading range presses on. That is a somewhat bearish sign and may portend an eventual revisit to the range lows. I will be watching the $117 price point in the near term as support. Overall, the chart is sideways and suggests a hold recommendation.
SDY: A 2-Year Trading Range, Momentum Waning
Stockcharts.com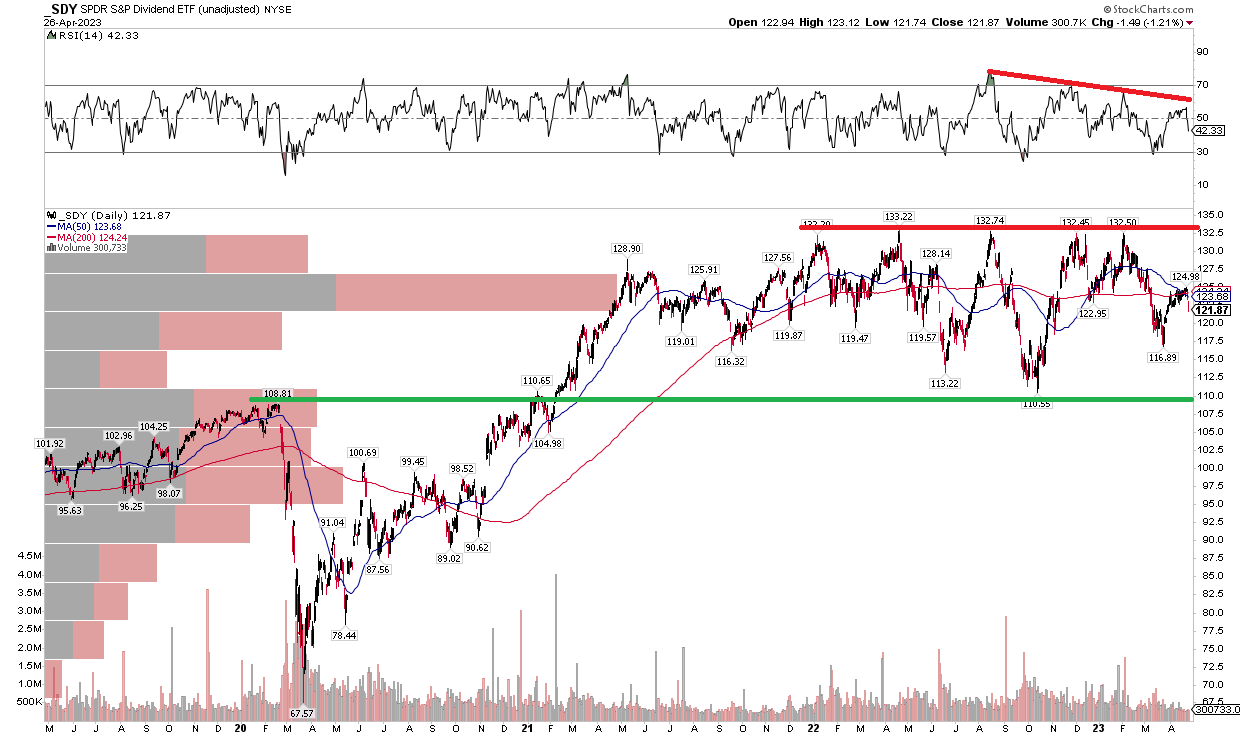
The Bottom Line
The valuation of SDY is decent, but not a tremendous buy while the technicals paint a similar picture. I am a hold on SDY.
This article was written by

Analyst’s Disclosure: I/we have no stock, option or similar derivative position in any of the companies mentioned, and no plans to initiate any such positions within the next 72 hours. I wrote this article myself, and it expresses my own opinions. I am not receiving compensation for it (other than from Seeking Alpha). I have no business relationship with any company whose stock is mentioned in this article.
Seeking Alpha's Disclosure: Past performance is no guarantee of future results. No recommendation or advice is being given as to whether any investment is suitable for a particular investor. Any views or opinions expressed above may not reflect those of Seeking Alpha as a whole. Seeking Alpha is not a licensed securities dealer, broker or US investment adviser or investment bank. Our analysts are third party authors that include both professional investors and individual investors who may not be licensed or certified by any institute or regulatory body.