NOBL Vs. SDY: Which Dividend Aristocrats ETF Reigns Supreme?

Summary
- NOBL and SDY are two leading Dividend Aristocrats ETFs offered by ProShares and State Street. Each have a 0.35% expense ratio, but SDY has twice the assets under management.
- SDY selects from the much wider S&P 1500 Composite Index while NOBL is limited to the S&P 500 Index. In addition, SDY is yield-weighted, but NOBL weights constituents equally.
- An analysis of past performance makes it difficult to pick a winner. NOBL is the more consistent performer, but SDY has already fully recovered from the nine-month drawdown in 2022.
- To break the tie, I examined each ETF's fundamentals at the industry level. It became clear that NOBL had the best dividend growth prospects, driven by superior earnings growth and momentum and a higher profitability score.
- Both should provide solid downside protection in a recession, but if you're looking to merge dividend consistency with dividend growth, NOBL is the winner.
- Looking for a portfolio of ideas like this one? Members of Hoya Capital Income Builder get exclusive access to our subscriber-only portfolios. Learn More »
designer491
Investment Thesis
The ProShares S&P 500 Dividend Aristocrats ETF (BATS:NOBL) and the SPDR S&P Dividend ETF (NYSEARCA:SDY) have delivered outstanding returns over the last decade with less risk. However, dividend consistency seekers only need one. This article differentiates the two based on past performance, dividends, and current fundamentals at the industry level. I conclude that NOBL is the better choice based on superior profitability, earnings growth, and earnings momentum, and thus, it is more likely to grow distributions. It's a close call, but I look forward to explaining why in more detail below.
ETF Overview: NOBL vs. SDY
Strategy Discussion
NOBL and SDY track U.S. Dividend Aristocrats, a title given to companies with outstanding dividend growth track records. For NOBL, the selection universe is the S&P 500 Index, and constituents must raise dividends for at least 25 consecutive years. For SDY, constituents must be a member of the S&P Composite 1500 Index, which includes large, mid, and small-caps with a minimum of $1.5 billion in float-adjusted market capitalization ($2 billion for new entrants). Furthermore, the dividend growth minimum is 20 years. The respective Indexes and fund expense ratios are in the table below.
Morningstar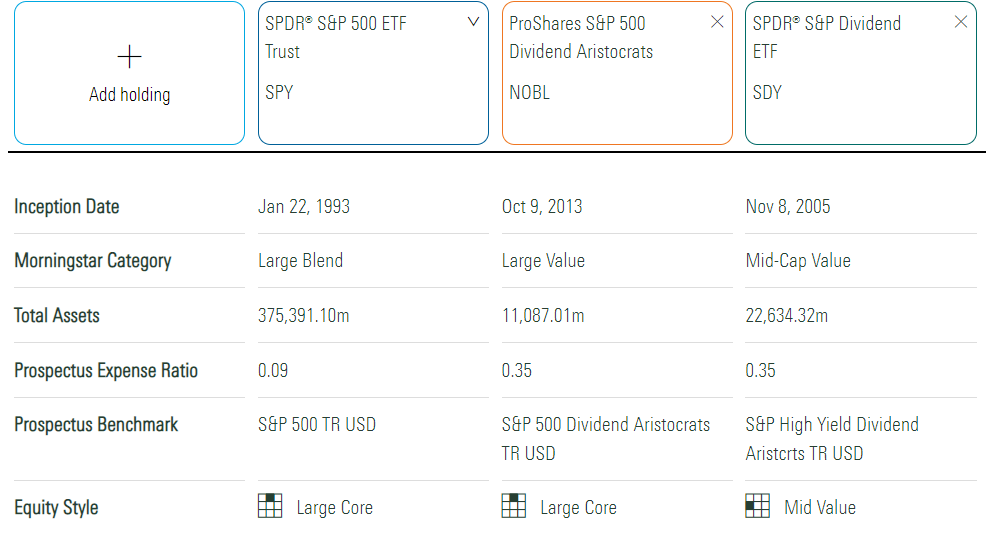
Morningstar classifies NOBL in the Large Core category, while SDY is Mid Value because of its selection universe. Both ETFs have a 0.35% expense ratio, but SDY is more established with a November 2005 inception date. In addition, NOBL is equal-weighted, while SDY is yield-weighted. The added diversification plus a higher focus on dividend yield is a crucial differentiator for SDY. Along with its longevity, this may explain why it has twice the AUM as NOBL.
NOBL Top Ten Holdings
Since NOBL is an equal-weight ETF, its top ten holdings reflect the best performers since the last rebalancing. In this case, West Pharmaceutical Services (WST) has soared 46% YTD, and Clorox (CLX) is up 16% YTD.
ProShares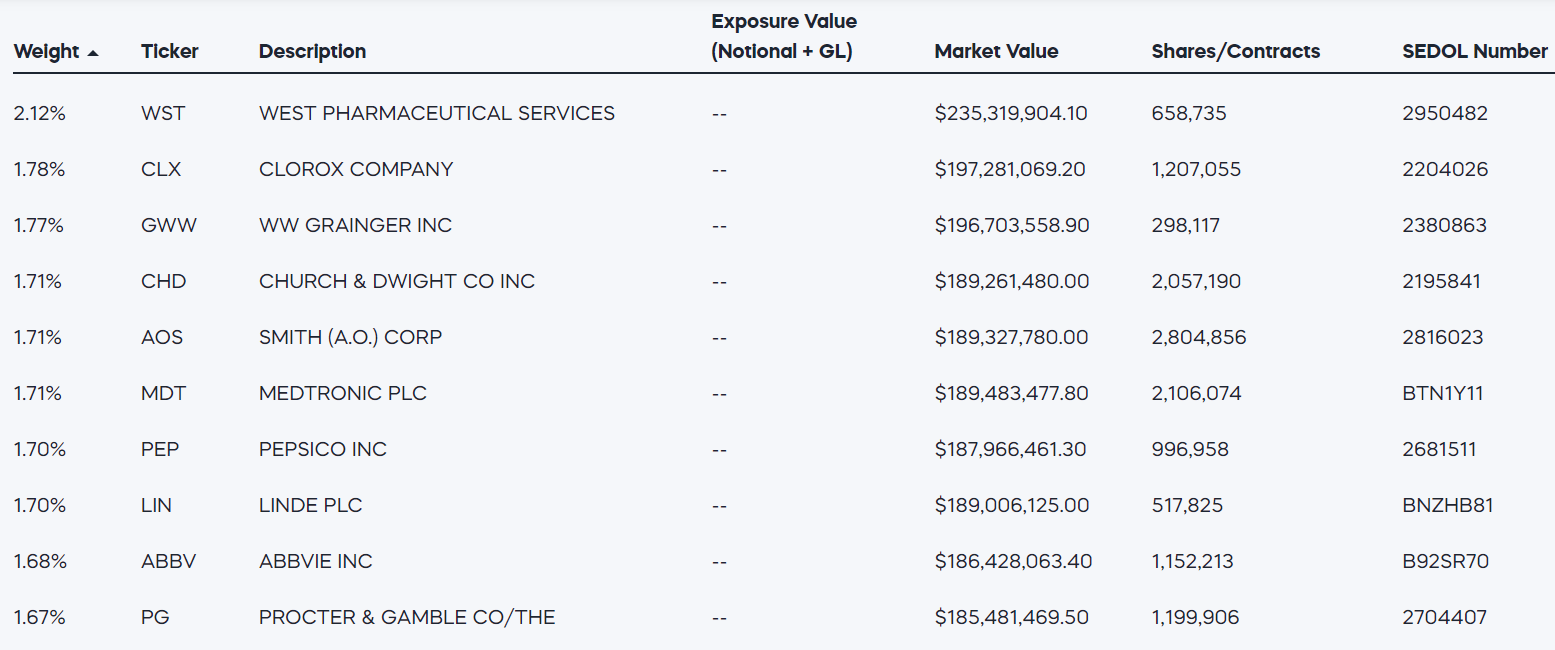
SDY Top Ten Holdings
SDY's top ten holdings are listed below. Since it's yield-weighted, Walgreens Boots Alliance (WBA), 3M (MMM), and National Retail Properties (NNN) top the list. Except for T. Rowe Price Group (TROW) and Essex Property Trust (ESS), all currently yield above 3.50%.
State Street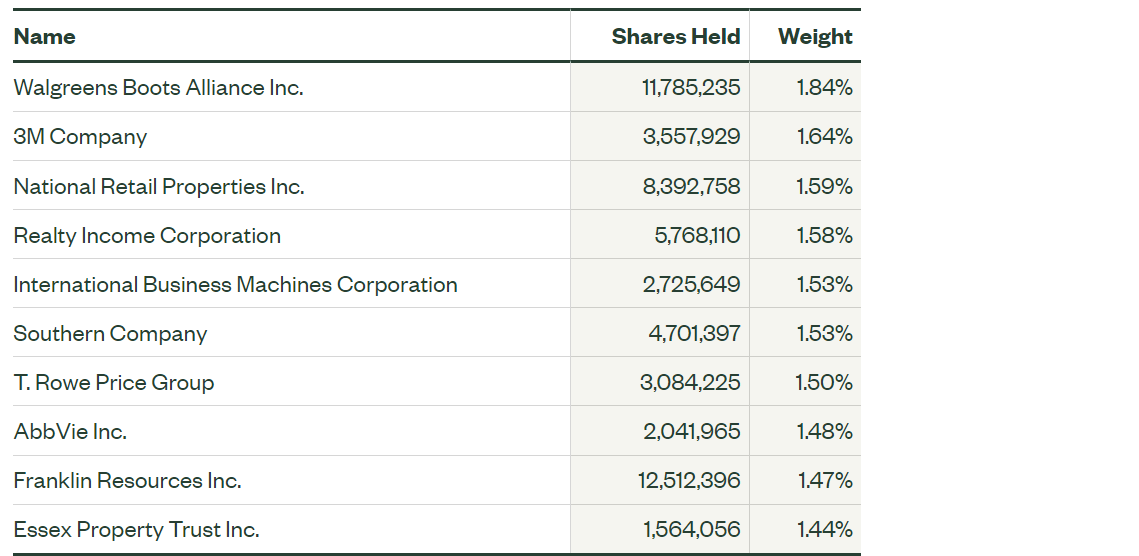
There are 121 holdings in total, but the bottom ten have a combined 2.59% weight and yield around 1% or less.
Sector Exposures
The following table highlights sector exposure differences between NOBL, SDY, and the SPDR S&P 500 ETF (SPY). Recall how Morningstar places SPY and NOBL in the same Large Core category, but it's evident the two are much different. For example, SPY has 25% exposure to Technology stocks compared to 3% for NOBL. The reason is that profitable Technology stocks are a somewhat new concept, and you can't (and shouldn't) pay or increase dividends without sufficient earnings support.
Morningstar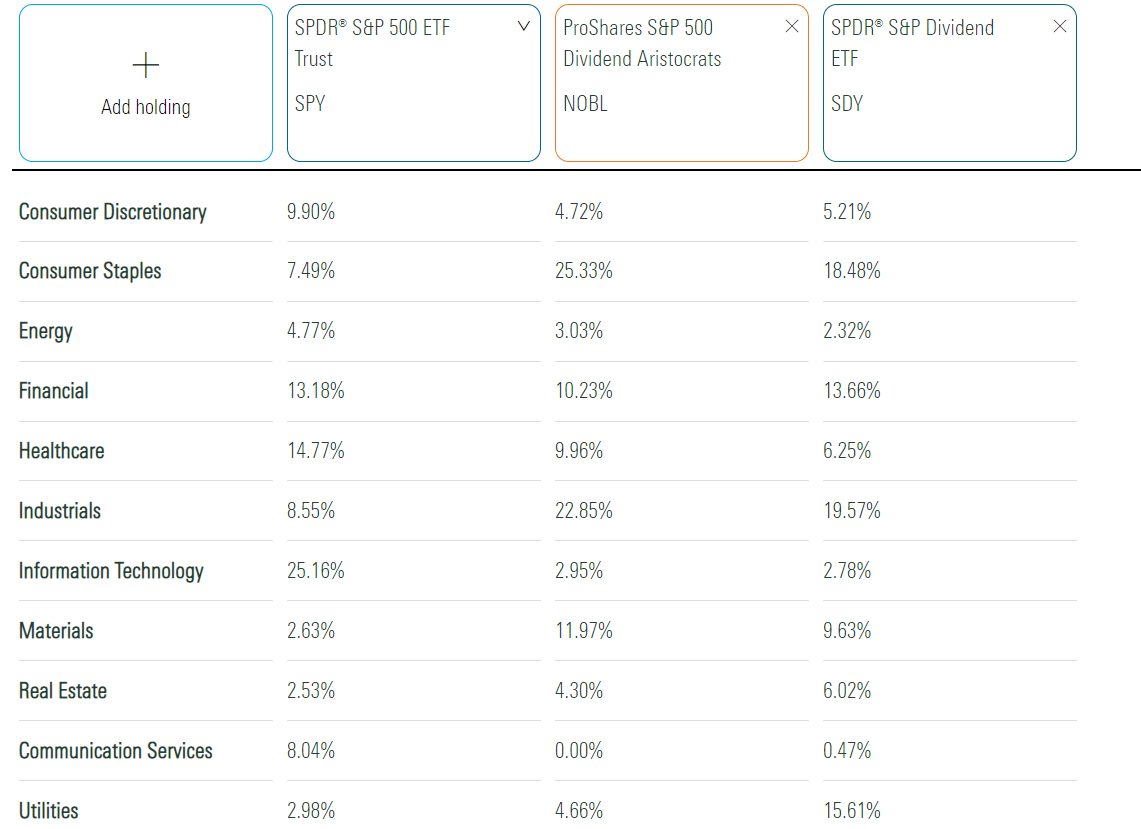
From a sector exposure perspective, the main differences between NOBL and SDY are in Consumer Staples and Utilities. SDY holds 15 stocks in this sector compared to 3 for NOBL, which is generally a higher-yielding sector. The Southern Company (SO) and Avista (AVA) yield around 4% each. In contrast, NOBL has 7% more exposure to Consumer Staples stocks because of its equal-weight approach. Except for WBA, all yield around 3% or less and consequently have less weight in SDY.
Performance Analysis
Since November 2013, NOBL has outperformed SDY by an annualized 0.63% and had a lower drawdown in Q1 2020 (23.23% vs. 25.06%). Since the standard deviation was roughly the same, risk-adjusted returns (Sharpe and Sortino Ratios) also favor NOBL. SPY outperformed both. However, the launch period was primarily during a strong bull market. The goal of the Dividend Aristocrats' strategy is to outperform more in down markets than they underperform in bull markets.
Portfolio Visualizer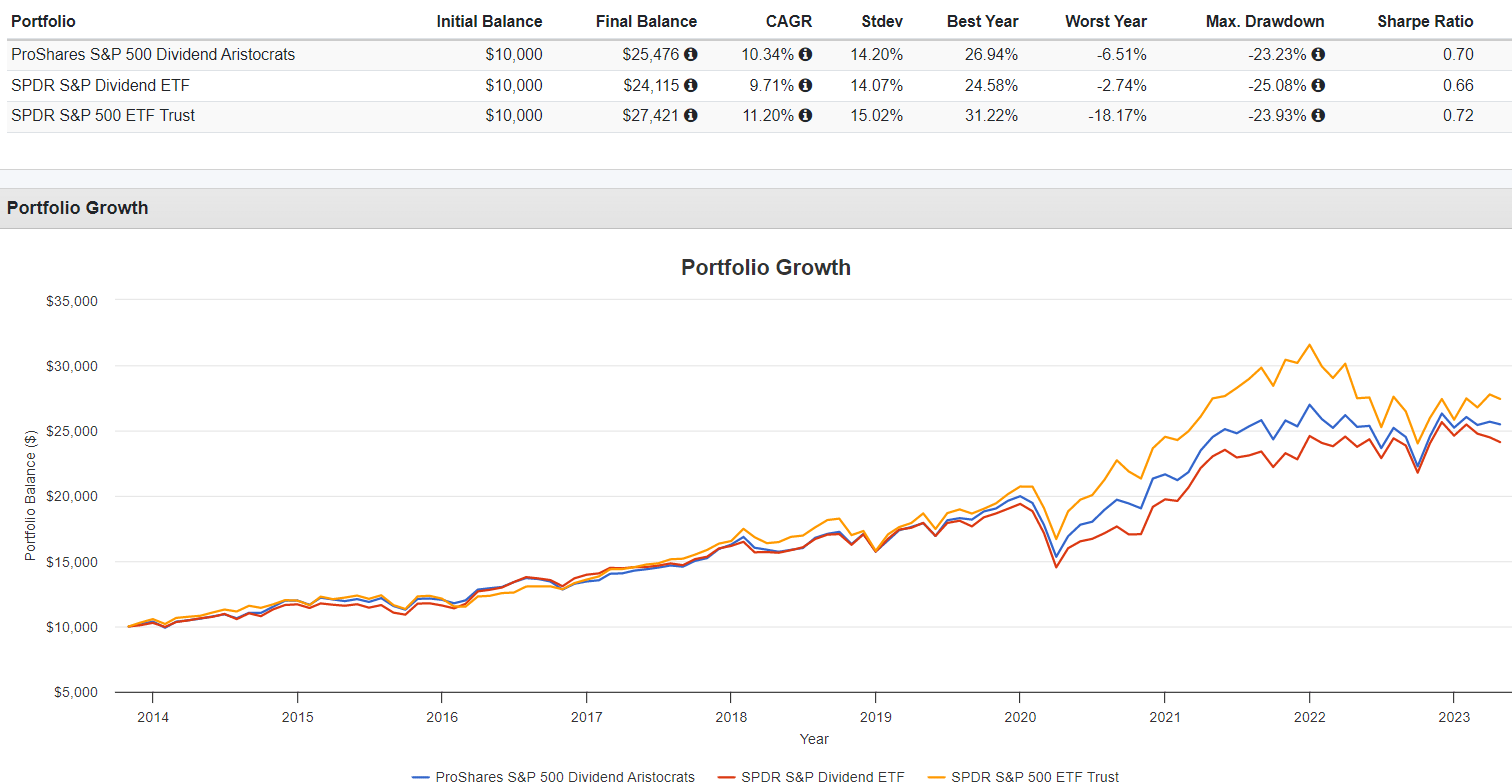
As for which ETF does that better, SDY has a decent case. It outperformed NOBL by 6% between January and September 2022 and has recovered, while NOBL remains underwater.
Portfolio Visualizer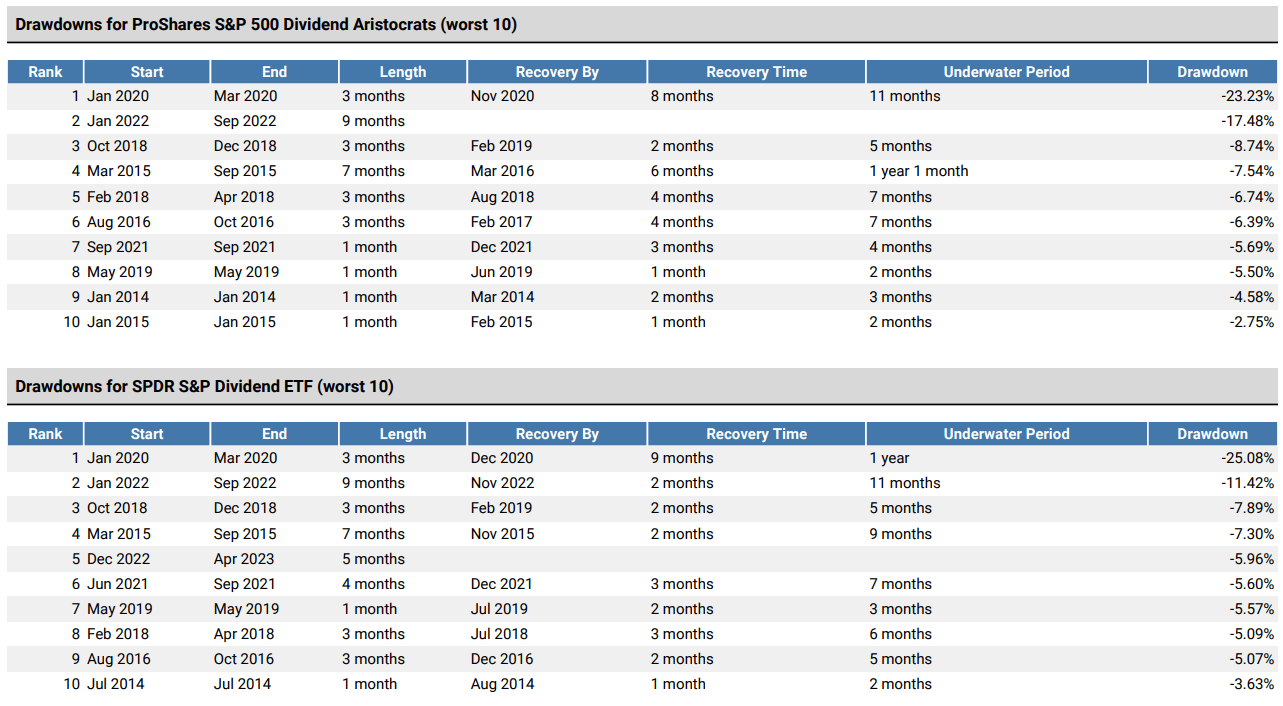
Finally, NOBL and SDY were included in my performance rankings of 79 dividend- and value-focused funds. Below is one table from the review that lists percentile rankings for the largest ETFs. Between 2014 and 2022, NOBL and SDY ranked in the fourth quartile twice. SDY also beat 82% of competitors in 2022 compared to 38% for NOBL. However, SDY has the edge again YTD through March. Deciding which is better based on past performance is difficult, as NOBL offered better total returns, but SDY had a more consistent ranking.
The Sunday Investor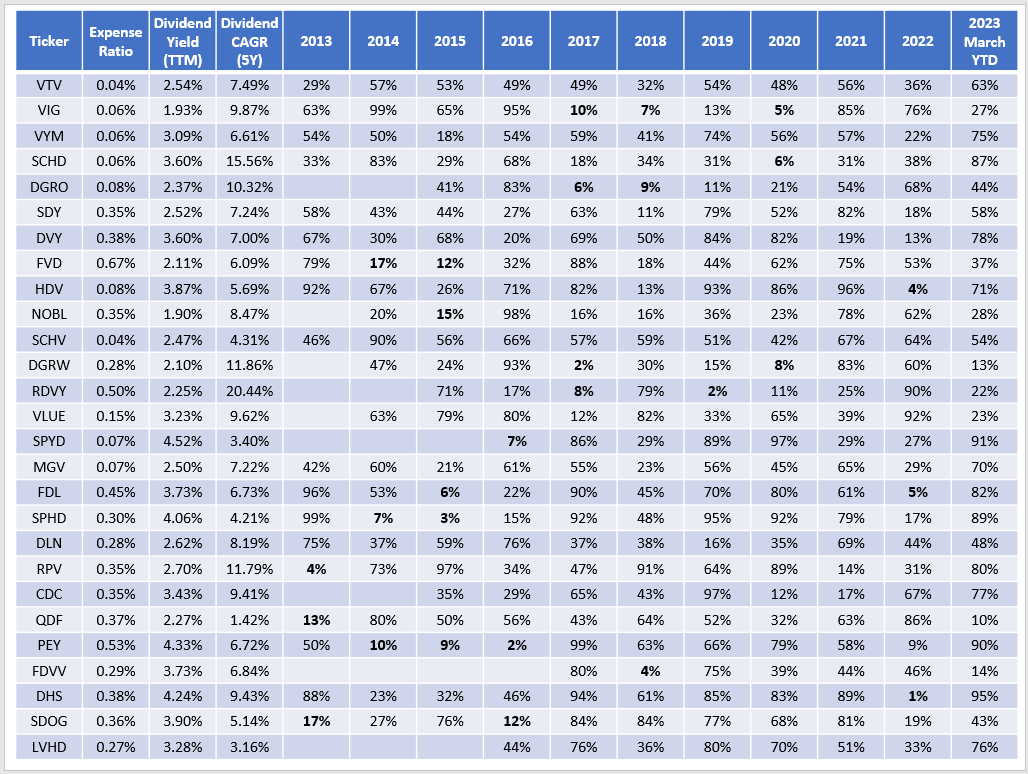
Dividend Analysis
SDY has a better "B" Dividend Grade, according to Seeking Alpha's ETF Factor Grades. The reason is a higher trailing dividend yield (2.57% vs. 1.93%) and a more extended dividend payment history. However, the latter is merely a function of SDY's longevity. Virtually all ETFs, even growth-oriented ones, make at least small distributions. Dividend growth is more important.
Seeking Alpha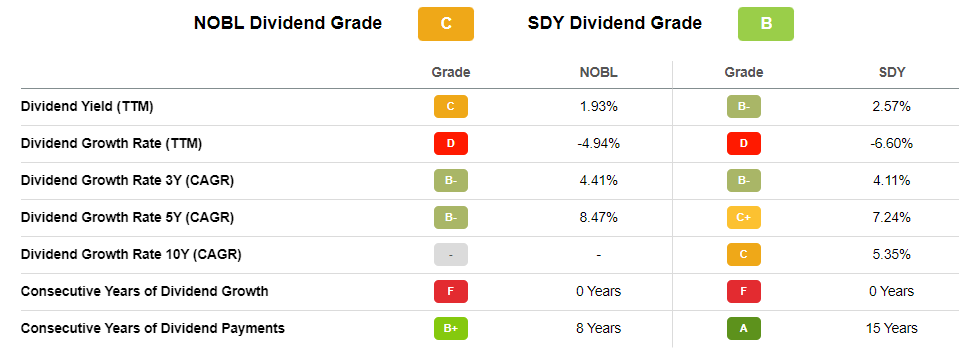
NOBL has the advantage on that metric. In the last five years, NOBL increased distributions by 8.47% per year compared to 7.24% for SDY. These figures exclude the short- and long-term capital gains made by SDY in 2017 and the years prior. Had they been included, SDY's dividend growth would be negative. This link shows the portfolio income generated on a $10,000 investment in 2017 for both ETFs, assuming you did not reinvest dividends. SDY's portfolio income dropped from $518 to $464 in 2022, or a 2.18% annualized decline. NOBL's income increased from $207 to $323, or 9.31% per year.
Portfolio Visualizer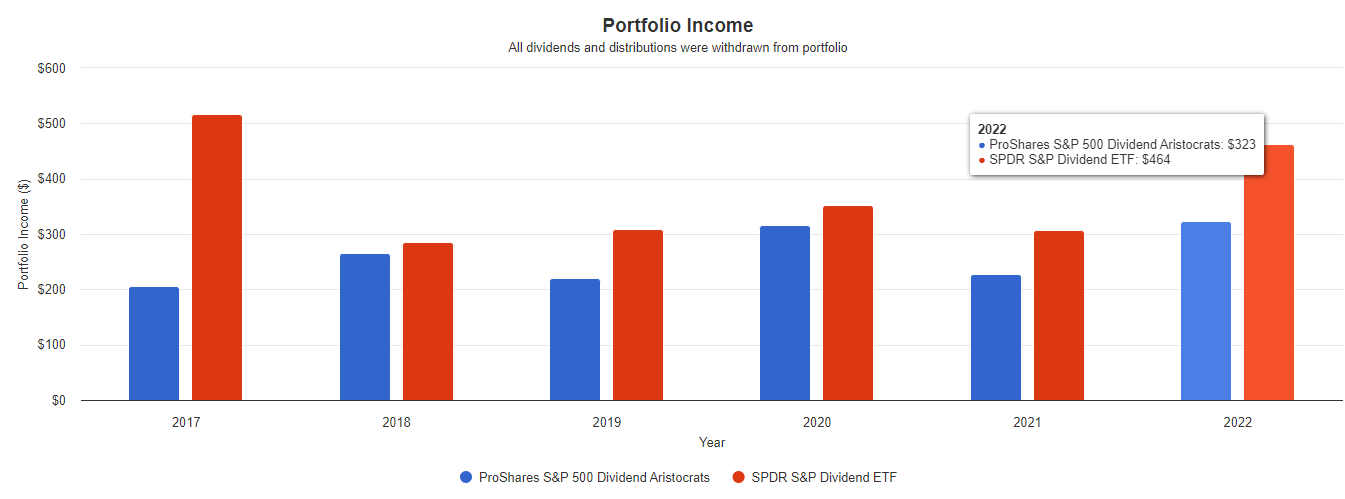
Fundamental Analysis
NOBL Fundamentals By Industry
The following table highlights selected fundamental metrics for NOBL's top 25 industries. They total 73% of the portfolio, have a weighted average $89 billion market capitalization, and a 0.85 five-year beta.
The Sunday Investor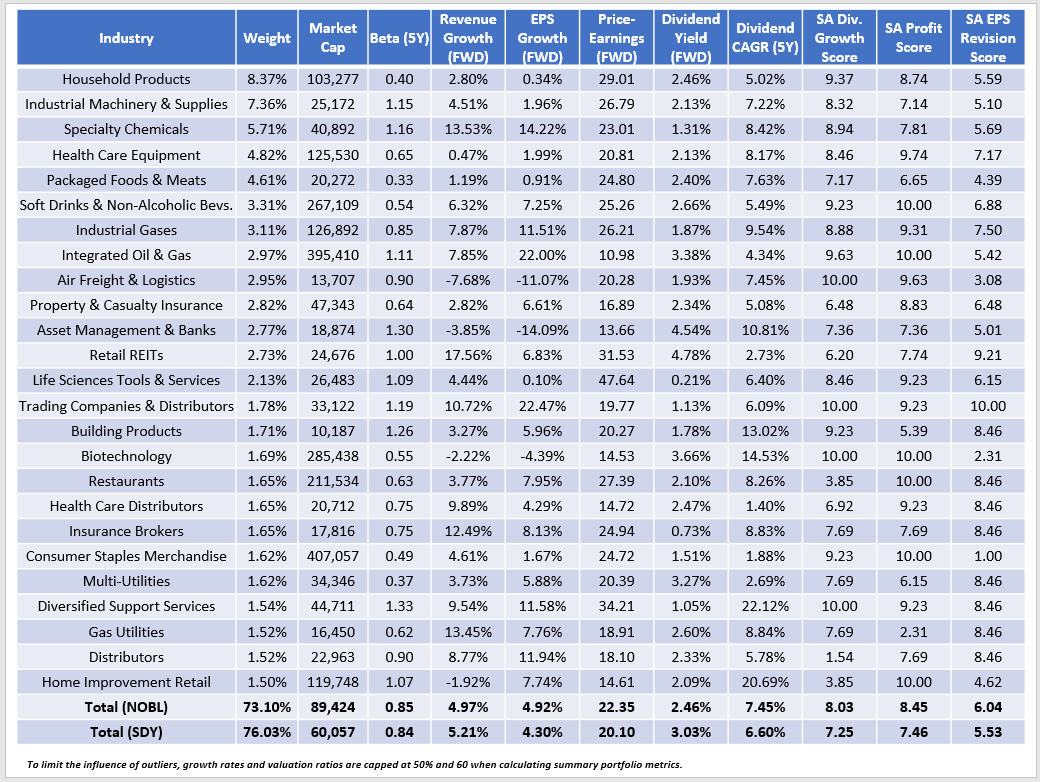
SDY's top 25 industries total 76%, indicating it's more concentrated despite more holdings. The higher market cap figure reflects the selection universe, but both funds have the same volatility relative to the market. NOBL's high exposure to Household Products stocks like Kimberly-Clark (KMB) and Clorox helps balance out more volatility commodity-related stocks like Albemarle (ALB) and Chevron (CVX). The latter stocks are key reasons for NOBL's superior earnings growth rate, estimated at 4.92%.
NOBL also has a higher profitability score (8.45/10 vs. 7.46/10), which I calculated by normalizing Seeking Alpha Factor Grades on a ten-point scale and then weighting them accordingly. Higher profitability, superior earnings growth, and a better dividend growth score (8.03/10 vs. 7.25/10) suggest NOBL will likely raise dividends faster than SDY. We've seen this over the last five years, and I think it will continue.
SDY Fundamentals By Industry
SDY is yield-weighted, so quality is less at the forefront. Industrial Machinery & Supplies and Gas Utilities are its top largest industries, with relatively weak profitability scores of 6.95/10 and 5.92/10. It's linked to relatively low market capitalization figures of $20 billion and $7 billion.
The Sunday Investor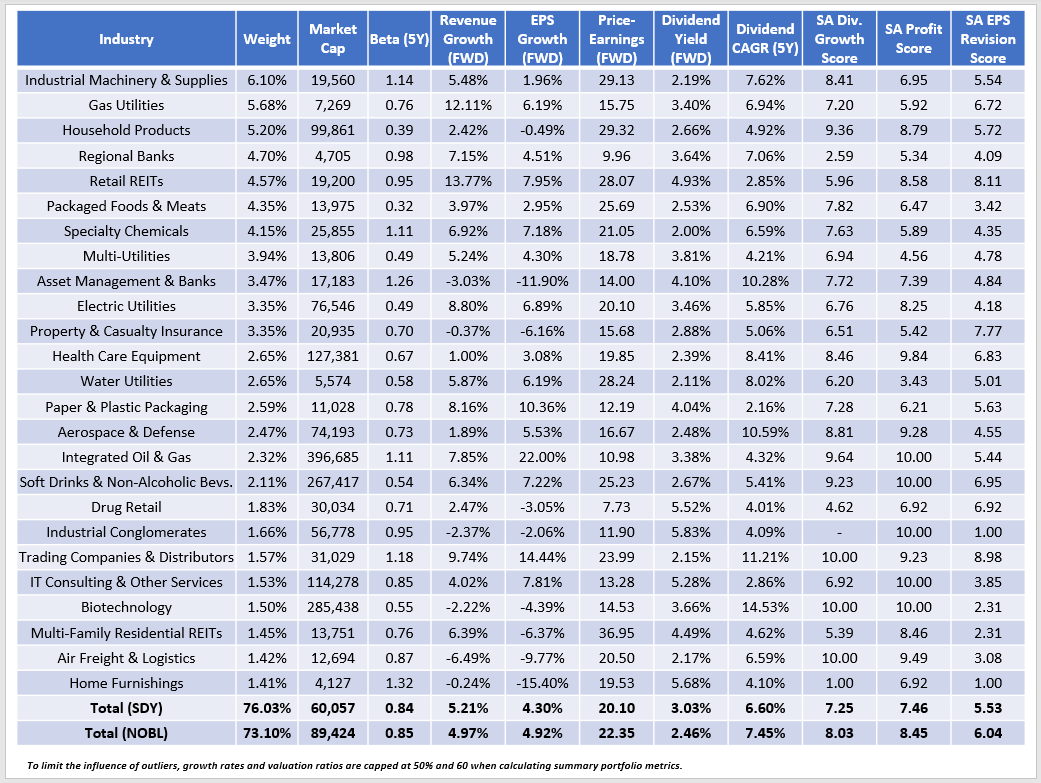
I discussed NOBL's advantage on earnings growth already; this table makes it easy to see why. We must scroll to SDY's 14th-largest industry before finding double-digit estimated earnings growth in the Paper & Plastic Packaging industry. Still, NOBL and SDY struggle with earnings growth, a common problem for dividend ETFs. It isn't easy to see how these ETFs will maintain a 6-8% dividend growth rate as we advance, so dividend investors should scale back growth expectations and focus on quality first. NOBL wins on that front.
Seeking Alpha's EPS Revision Grades are a good indication of market sentiment, and SDY's 5.53/10 score is average right now, slightly below SPY's 5.55/10 score. However, NOBL stands out, much like the Vanguard Dividend Appreciation ETF (VIG), which requires ten consecutive years of dividend increases. VIG remains my favorite of the three today, although NOBL likely offers more downside protection. That could come in handy in a recession.
Finally, I don't want to ignore SDY's higher yield. Its constituents gross 3.03%; after subtracting the 0.35% expense ratio, the net result should be around 2.68%. That's better than its trailing 2.57% yield and 0.57% more than NOBL offers. However, readers should know plenty of alternatives featuring a yield above 3.50%. I listed 24 in this article on the AAM S&P 500 High Dividend Value ETF (SPDV), and some, including SCHD and DHS, have a higher historical five-year dividend growth rate. They may be worth pursuing if you want a good dividend yield and growth combo.
Investment Recommendation
In this head-to-head matchup of Dividend Aristocrat ETFs, I pick NOBL as the winner. Its holdings are more profitable, with better dividend growth rates and superior earnings momentum. In addition, NOBL has outperformed SDY since its launch, and its percentile rankings against 79 peers indicate more consistent performance. SDY's advantage is that it's a higher-yielding fund because of its weighting scheme. However, neither ETF will likely satisfy income investors when short-term Treasuries yield 5%. In short, NOBL should offer more consistent total returns and dividend growth, making it a better core holding for your dividend growth portfolio.
The Sunday Investor Joins Income Builder
The Sunday Investor has teamed up with Hoya Capital to launch the premier income-focused investing service on Seeking Alpha. Members receive complete early access to our articles along with exclusive income-focused model portfolios and a comprehensive suite of tools and models to help build sustainable portfolio income targeting premium dividend yields of up to 10%.
Whether your focus is High Yield or Dividend Growth, we’ve got you covered with actionable investment research focusing on real income-producing asset classes that offer potential diversification, monthly income, capital appreciation, and inflation hedging. Start A Free 2-Week Trial Today!

This article was written by

I perform independent fundamental analysis for over 850 U.S. Equity ETFs and aim to provide you with the most comprehensive ETF coverage on Seeking Alpha. My insights into how ETFs are constructed at the industry level are unique rather than surface-level reviews that’s standard on other investment platforms. My deep-dive articles always include a set of alternative funds, and I am active in the comments section and ready to answer your questions about the ETFs you own or are considering.
My qualifications include a Certificate in Advanced Investment Advice from the Canadian Securities Institute, the completion of all educational requirements for the Chartered Investment Manager (CIM) designation, and a Bachelor of Commerce degree with a major in Accounting. In addition, I passed the CFA Level 1 Exam and am on track to become licensed to advise on options and derivatives in 2023. In November 2021, I became a contributor for the Hoya Capital Income Builder Marketplace Service and manage the "Active Equity ETF Model Portfolio", which as a total return objective. Sign up for a free trial today! Hoya Capital Income Builder.
Analyst’s Disclosure: I/we have a beneficial long position in the shares of SPY, VIG either through stock ownership, options, or other derivatives. I wrote this article myself, and it expresses my own opinions. I am not receiving compensation for it (other than from Seeking Alpha). I have no business relationship with any company whose stock is mentioned in this article.
Seeking Alpha's Disclosure: Past performance is no guarantee of future results. No recommendation or advice is being given as to whether any investment is suitable for a particular investor. Any views or opinions expressed above may not reflect those of Seeking Alpha as a whole. Seeking Alpha is not a licensed securities dealer, broker or US investment adviser or investment bank. Our analysts are third party authors that include both professional investors and individual investors who may not be licensed or certified by any institute or regulatory body.