JPIE: Multi-Asset Bond Fund From JP Morgan

Summary
- JPMorgan Income ETF is a fixed income multi-asset fund from JP Morgan.
- JPIE holds a multitude of securities, representing a fixed income cross sector portfolio.
- Around 48% of the portfolio is below investment grade, with the rest being composed of AAA and BBB credits mainly.
- From a pure price perspective, the fund had a shallow drawdown of only -8% in the past year.
- The vehicle has a 6.37% yield paid monthly, and a 4.09 years duration.
onurdongel
Thesis
JPMorgan Income ETF (NYSEARCA:JPIE) is a fixed income multi-asset fund from JP Morgan. In our view, 2023 will be a great year to buy fixed income for long-term holding purposes. We believe rates will peak this year. The CEF structure allows an asset manager to layer in leverage on fixed income portfolios, thus bumping up the yields offered but also the risk. For retail investors with reduced risk appetites, unleveraged fixed income vehicles such as ETFs are the answer. JPIE is such a vehicle, offering a multi-asset exposure to U.S. credits and a 6.37% yield.
JPIE is a new fund, having come to market in late 2021, but it is trading at a premium to NAV of 0.77% which is highly unusual for ETFs. The explanation lies in the demand side for the name. We expect this to normalize to something closer to 0%, which is the norm for ETFs with fairly liquid collateral.
The fund benchmarks itself against the iShares Core U.S. Aggregate Bond ETF (AGG), but that is not very accurate since AGG does not contain any high yield names and has a different duration profile:
Benchmark (Fund Fact Sheet)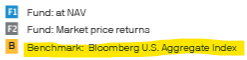
We like JPIE for its bar-belled approach to credit selection and its high dividend yield. We feel that retail investors who are not comfortable with leverage and the volatility that leverage brings, can invest in names such as JPIE, which offer a multi-asset approach as well as a high dividend yield paid monthly.
From a pure price perspective, the fund had a shallow drawdown of only -8% in the past year, versus -10% for AGG. From a total return perspective the fund is now flat on a 1-year lookback, the dividend payments making up for the price slippage incurred by higher rates.
Analytics
- AUM: $0.39 bil.
- Sharpe Ratio: n/a (3Y).
- Std. Deviation: n/a (3Y).
- Yield: 6.37%
- Premium/Discount to NAV: 0.77%
- Z-Stat: n/a
- Leverage Ratio: 0%
- Composition: Fixed Income Multi Asset
- Duration: 4 yrs
Holdings
The fund contains a multi-asset portfolio:
JPIE Holdings (Fund Fact Sheet)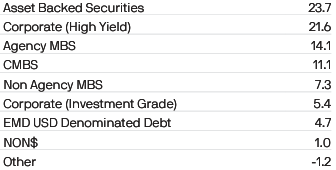
Unlike some fixed income funds that focus entirely on a sector (be it high yield, treasuries or MBSs), JPIE holds a multitude of assets, thus representing a fixed income cross sector portfolio. ABS securities are the largest slice, followed by high yield and agency MBS. The ratings matrix tells us a similar story:
Ratings (Fund Fact Sheet)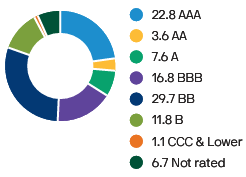
Around 48% of the portfolio is below investment grade, with the rest being composed of AAA and BBB credits mainly. As a reminder Agency MBS bonds are AAA, and we presume a large slice of the ABS bucket is also AAA, representing the most senior tranche in the securitization.
The fund does not contain a significant amount of the riskiest credits, namely 'B' and 'CCC' names.
Its composition also matches its duration profile, with most names falling in the short to intermediate duration buckets:
JPIE Maturity Ladder (Fund Fact Sheet)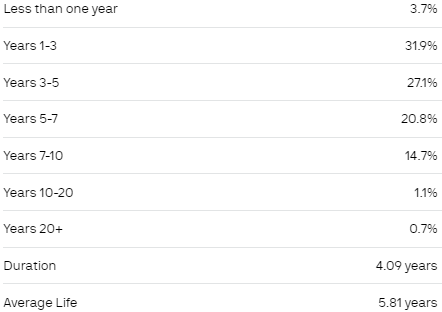
We can see there are very few names falling in maturity buckets extending above seven years, consistent with the ABS and MBS collateral composition.
Performance
The fund benchmarks itself against the iShares Core U.S. Aggregate Bond ETF (AGG), but that is not very accurate since AGG does not contain any high yield names and has a different duration profile:
AGG Details (Author)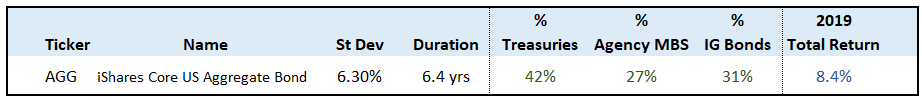
Despite its larger allocation to high yield JPIE has done much better than AGG in the past year:
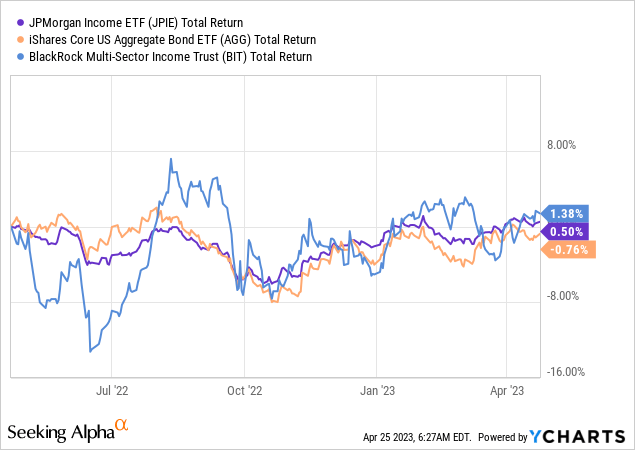
We have layered in the leveraged multi-asset CEF BIT here for comparison purposes. JPIE's outperformance versus AGG can be explained by its shorter duration.
Conclusion
JPIE is a fixed income multi-asset exchange-traded fund. The vehicle was launched in 2021 and has a bar-belled credit approach. Around 48% of the portfolio is below investment grade, with the rest being composed of AAA and BBB credits mainly. From a holdings perspective, ABS securities are the largest slice, followed by high yield and agency MBS. From a pure price perspective, the fund had a shallow drawdown of only -8% in the past year, versus -10% for AGG. The vehicle has a 6.37% yield paid monthly, and a 4.09 years duration.
We are on Hold with respect to JPIE due to the benign credit spread environment we are witnessing with very low equity and credit risk premia. We are due for a spike in VIX and credit spreads in 2023, which will occur in our opinion. Given JPIE's 48% allocation to junk bonds, the fund will sustain a drawdown at that point but will represent a nice entry point. When compared to AGG, JPIE runs substantial credit spread risk, whereas AGG is mainly rates driven.
This article was written by

Analyst’s Disclosure: I/we have no stock, option or similar derivative position in any of the companies mentioned, and no plans to initiate any such positions within the next 72 hours. I wrote this article myself, and it expresses my own opinions. I am not receiving compensation for it (other than from Seeking Alpha). I have no business relationship with any company whose stock is mentioned in this article.
Seeking Alpha's Disclosure: Past performance is no guarantee of future results. No recommendation or advice is being given as to whether any investment is suitable for a particular investor. Any views or opinions expressed above may not reflect those of Seeking Alpha as a whole. Seeking Alpha is not a licensed securities dealer, broker or US investment adviser or investment bank. Our analysts are third party authors that include both professional investors and individual investors who may not be licensed or certified by any institute or regulatory body.