Schwab Could Lose 50% Of Its Earning Power If Deposit Outflow Continues

Summary
- Schwab's management is confident that its long-term earning power is firmly intact.
- I lay out a viable path that Schwab could lose 50% of its earning power by year-end.
- I am concerned that the management team is too eager to project strength, thus painting a rosier picture than is realistic.
Justin Sullivan/Getty Images News
Pushback
After reading the title, some Bulls will likely point to the following slide from Schwab's (NYSE:SCHW) Spring Business Update where the management spells out how its long-term earning power is firmly intact.
Schwab (Y23 Spring Business Update)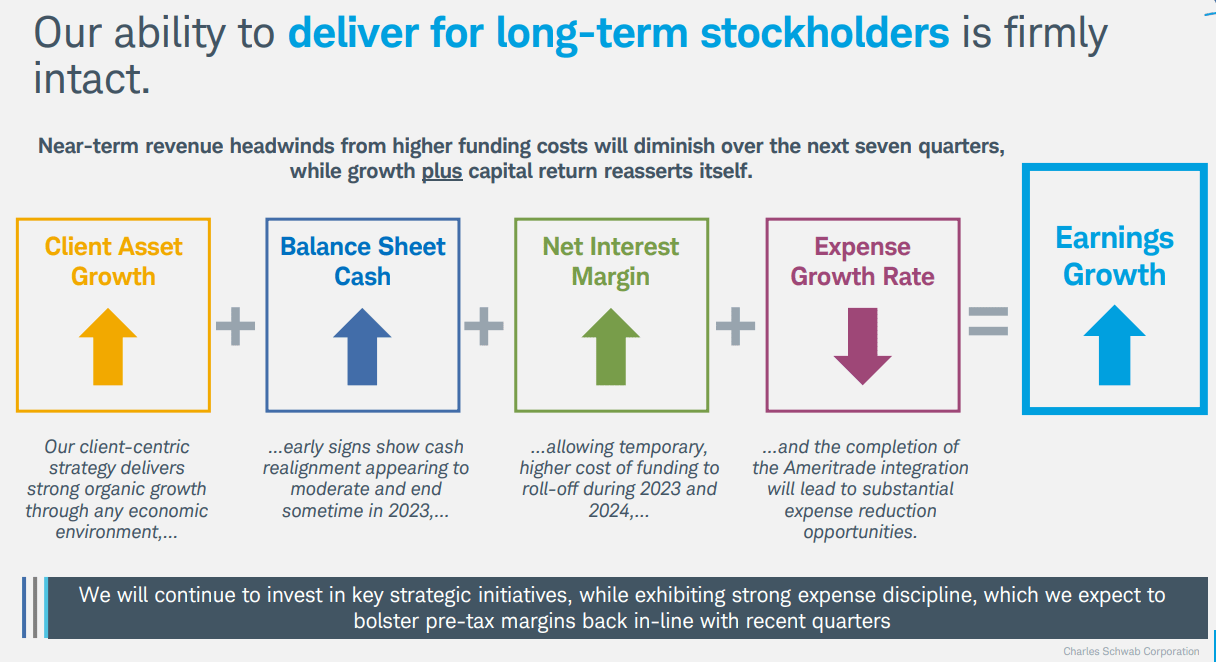
That management narrative points to sustainable client asset growth and continued net interest margin expansion as it anticipates low-cost funding outflow reduction/high-cost funding roll-off, and substantial cost savings achieved from TD Ameritrade integration.
Let me take a detour, quickly examine Schwab's business model, and offer an oversimplified chart with the intention to highlight its (not so) secret formula, and explaining why its earning power is not so firmly intact.
Schwab Business Model
I categorize Schwab into 3 revenue-generating segments.
Active Trading: revenue comes from commission, order flow, and margin loan interest.
MF/ETF/CTF/Advisory: asset management and admin fees, based upon daily balances of client assets invested.
Cash deposit: this is cash in the form of bank deposits, Schwab One balances, and BDA balances. Unlike assets invested in underlying securities or MF/ETF, this shows up in the balance sheet and can be deployed to earn higher yield interest.
The chart below shows its revenue-generating power by segment.
Y22 Schwab Rev by Segment (compiled by author)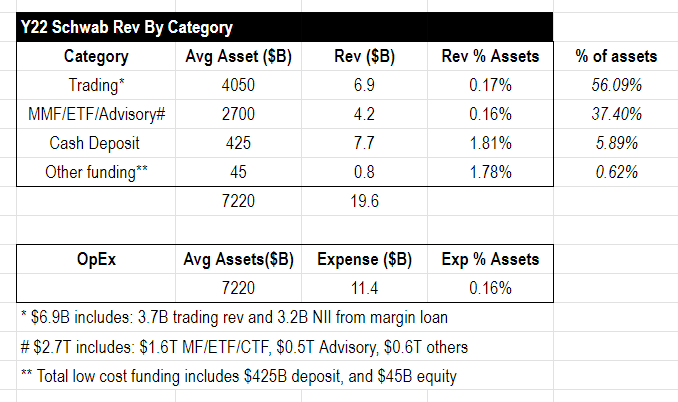
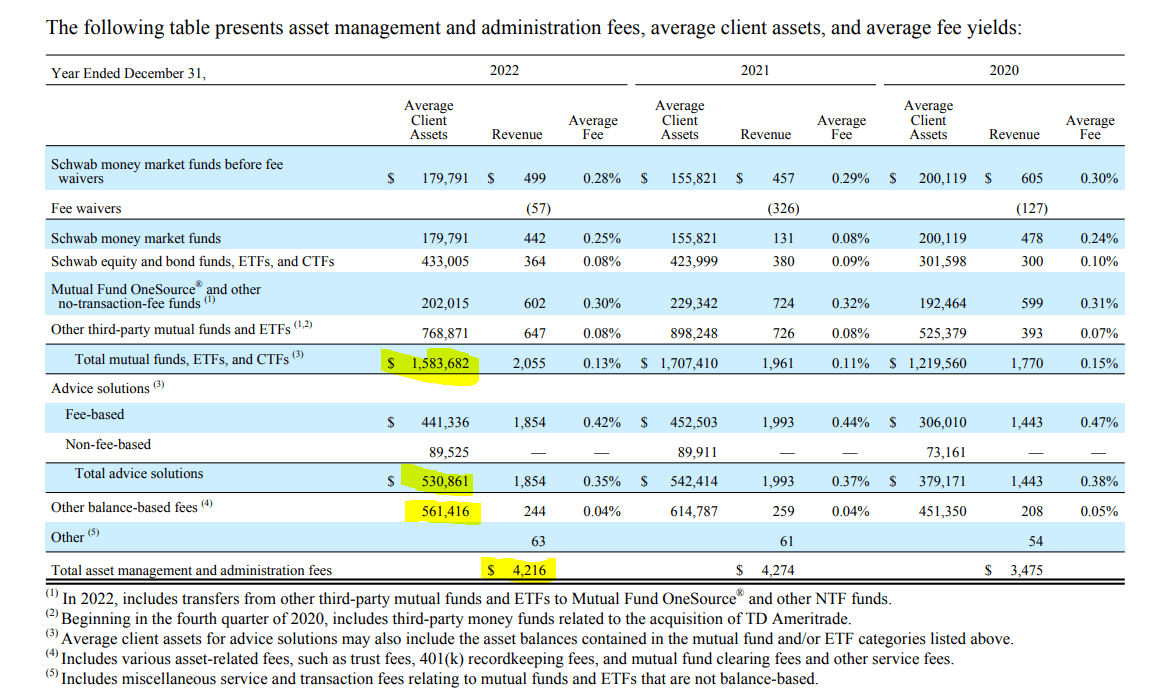
Note: This table aggregate data from its Y22 10K filings. The two tables below (from Y22 10k filings) provide the majority of the source data for the chart above. All asset amount refers to the average asset amount in Y2022 unless specified otherwise.
I call it oversimplified as the number is based on Y2022 financial data only. Many factors (e.g. interest rate) could have impacts on the result, however, the chart underscores 2 themes that are both significant and directionally correct for a foreseeable future.
1. 93%+ of its client assets (~$4T from trading and ~$2.7T from MMF/ETF/ advisory) generate revenue that just covers its operating expense if we allocate operating expenses by asset amount.
2. It is the cash deposit (plus stockholder's equity) that has a superior return on asset ratio (1.8%) to its OpEx ratio (0.16%), thus contributing to the lion's share of the profit.
Let me explain a bit more. Schwab's total operating expense in Y22 is $11.4Bn, with an average of $7.2T client assets, thus its OpEx/Client Assets ratio is 0.16%.
Average client assets under Mutual Funds, ETFs, CTFs, and advisory solutions are ~$2.7T in Y2022, and it earned a revenue of $4.2Bn (under asset management and admin fee), thus its Revenue/Client asset ratio is also 0.16%.
its average client trading asset was ~$4T in Y2022. Its total trading assets revenue was $7.7Bn including $3.7Bn ($1.8Bn commission, $1.7B order flow, and $0.3Bn other), and $4Bn net interest income generated from margin loans. I attribute that $4Bn NII to trading assets as that revenue derives directly from trading, thus its trading asset revenue/Client Asset ratio is 0.17%.
Therefore, for any client assets that go to MMF/ETF/asset management or trading, the revenue it generates by asset amount roughly equals the Operating Expense if we evenly attribute operating expense by asset amount.
Schwab (Y22 10k filing) Schwab (Y22 10k filings)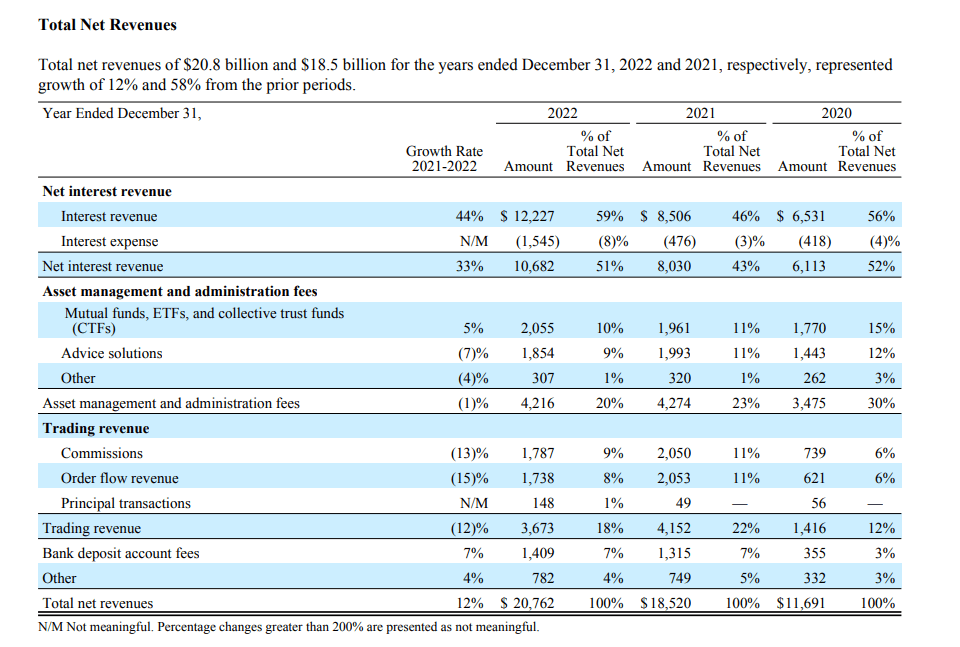
Revisit Management's Claim
Let me start by saying Schwab's brokerage business is a well-oiled machine and has been growing client assets at a consistent pace between 5-7% annually.
It is indeed a powerful earning machine when its idle cash as a percent of client assets remains relatively consistent, which has been the case over quite an extended period of time.
However that has changed since 1Q22.
Schwab (1Q23 ER)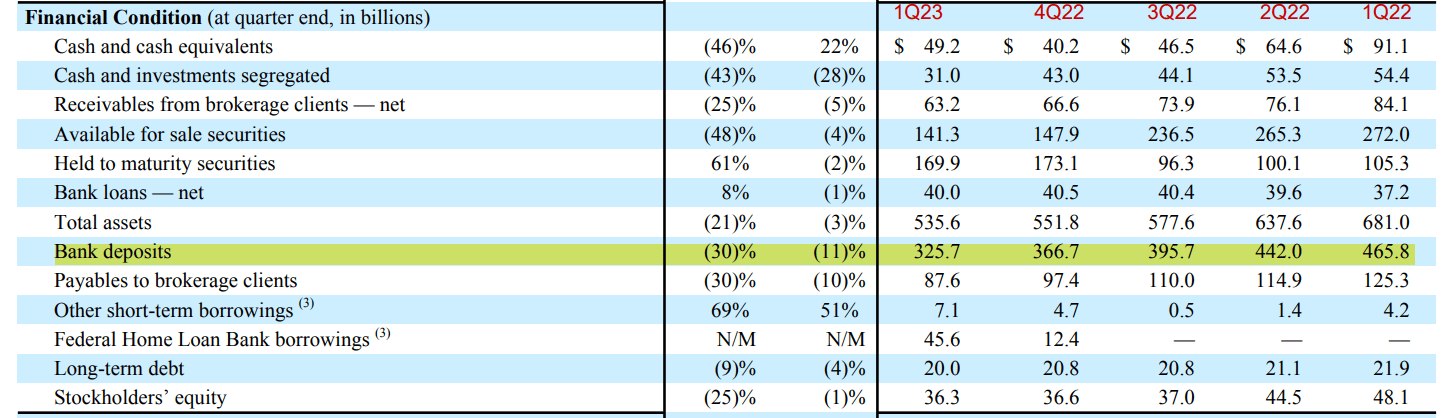
Note its bank deposit has dropped from $466Bn in 1Q22 to $325Bn in 1Q22, a total deposit outflow of $140Bn in 4 quarters, an average of $35Bn/quarter.
If one refers to the oversimplified chart above, client asset growth is as good as its cash deposit growth. Cash deposit is the source of earning power; outside of that, everything else is by and large breakeven business.
The obvious question: can that trend be reversed? Schwab's CFO struck a confident tone during the business updates:
"While bank deposits shrank by 11% versus the prior year-end, we observed a decline in the average daily pace of bank sweep movements from January to March - even when allowing for a temporary spike in activity at the onset of the banking system turmoil"
Call me cynical, but I'm not convinced that alone is sufficient to conclude that 4 quarters' deposit outflow comes to an end.
Thus comes the next question: what if the current deposit outflow continues for a few more quarters?
Scenario Play
Disclaim: the scenario I used in this section is what I consider a likely path for the next few quarters. It is worth noting that this is in sharp contrast to what management suggested.
Let us first examine its balance sheet as of 1Q23.
Its ~$500Bn asset book includes $140Bn Asset for Sale securities (AFS), $170Bn Held-to-maturity securities (HTM), and $40Bn Bank Loan.
On the liability side, $325Bn Bank deposit, 20Bn debt, and a $45Bn FHLB loan.
The table below reveals how it dealt with a total of $140Bn deposit outflow since 1Q22: together with security maturities, Schwab reduced ~$55Bn AFS, depleted $40Bn cash, and supplemented $45Bn short-term FHLB loans.
Schwab (1Q23 ER)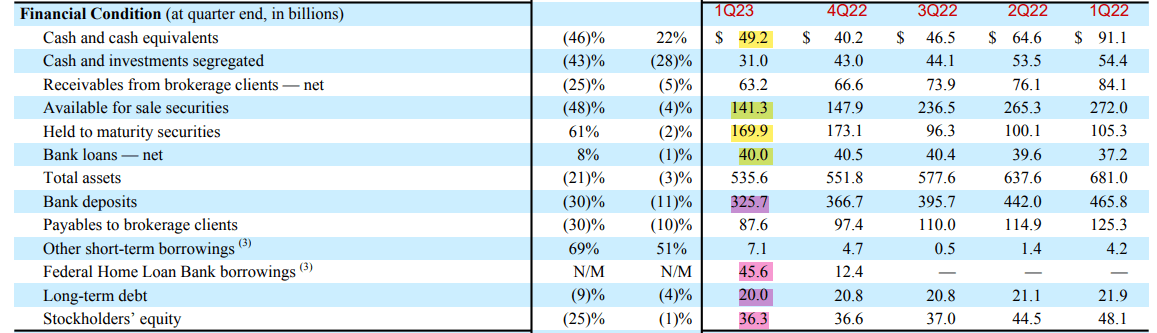
So the question is if the last 4 quarter trend continues, how is Schwab going to handle it?
The answer isn't pretty. Its cash position declined fast from 1Q22 to 2Q22 and has remained stable since 3Q22, thus I assume $40-50Bn cash as its minimum threshold to ensure its smooth daily operation without liquidity constraint.
Thus if the deposit outflow continues as it did over the last 4 quarters, I think Schwab has 2 options:
1. Continue to borrow short-term funding (via FHLB advances, discount window, or Bank Term Funding Program) at a roughly 5% interest rate.
Note that significant increases its funding cost as its current bank deposit has an average 0.7% interest rate, thus a whopping 4.3% difference.
A few caveats here. Its total borrow capacity in FHLB and discount window is around $90Bn. It already used $45Bn. However, with the new BTFP program, it has a lot more liquidity to tap into.
2. Sell AFS securities and reduce Balance Sheet: a 10% bank deposit outflow would reduce its net profit by 10%, but it also triggers unrealized loss (average 10% of its amortized cost) which directly hits its P&L and a lot harder than option 1. Furthermore, it sends a concerning signal that Schwab has to sell from its asset book to meet deposit outflow demands.
Thus, all else being equal, option 1 is likely the preferred choice.
Napkin Math
Its Net Interest Margin is ~2%, the average deposit interest rate is ~0.7%.
As laid out in the last section, its deposit outflow would most likely be supplemented by high-cost funding from FHLB or the Fed discount window.
As we noted from 1Q23 ER, Schwab's FHLB and other short-term borrowing are at an average yield of 5.05%.
Schwab (1Q23 ER)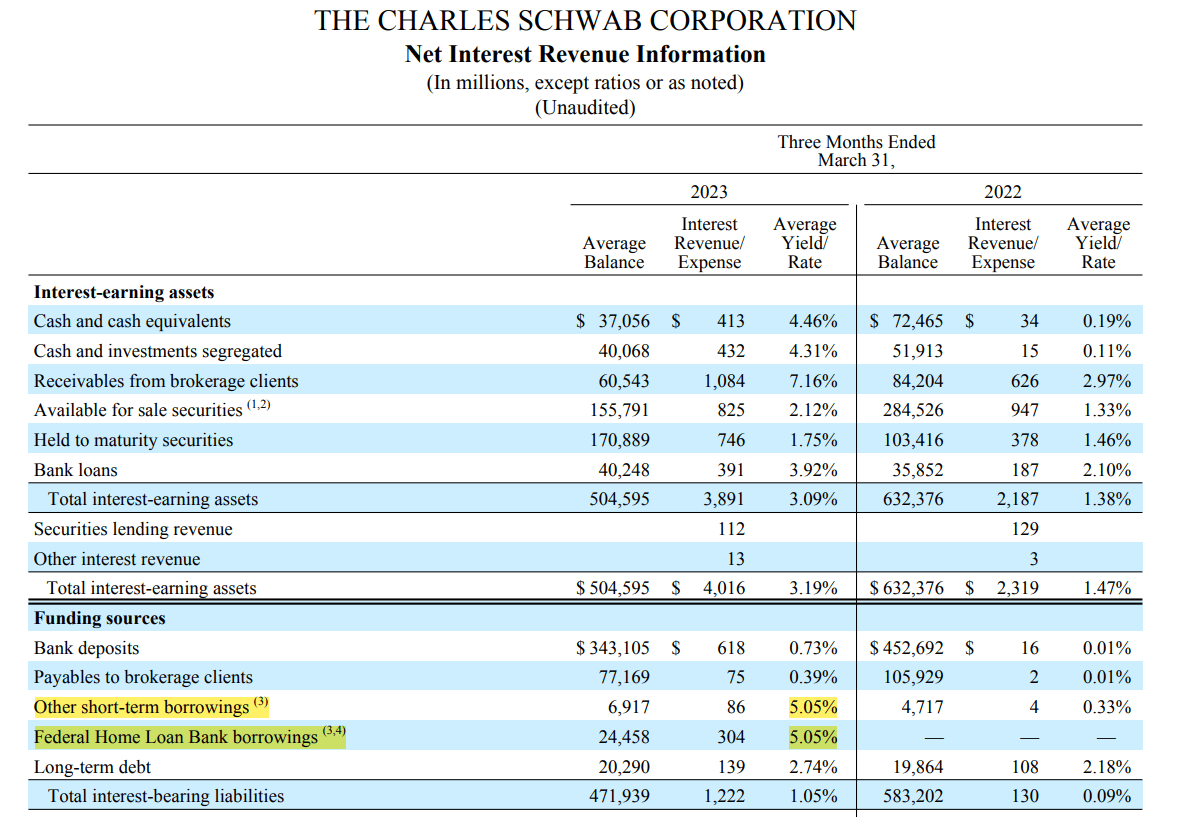
If that borrowing cost remains the same, any deposit outflow that is supplemented by FHLB borrowing or equivalent will increase its funding cost by a whopping 435bps.
Keep in mind, its current net interest margin is ~2%, 435bps funding cost raise will switch the economics from making 200bps to losing 235bps.
The napkin math is every 10% client deposit supplemented by high-cost funding will reduce 22% of net profit.
Everything else being equal, 23% deposit outflow will result in a 50% earning reduction, and 45% deposit loss, Schwab in its entirety becomes a breakeven business.
As a side note, that actually speaks to its robust business model. Few banking organizations can sustain a 45% deposit withdrawal.
If deposit outflow continues the trend from the last 4 quarters (decline an average of 8.5% QoQ), it would lose ~23% of its current cash deposit by 4Q23, thus resulting in a 50% earning reduction.
Deposit outflow model (Compiled by author)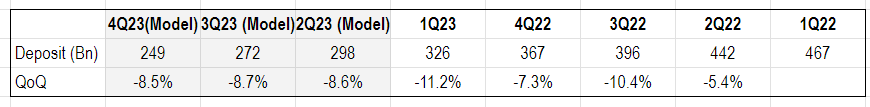
Valuation
If the above scenario plays out, its earning power would be cut by half to ~$5Bn operating income NTM.
That would hardly justify its current $95B market cap ($54/share as of 4/21/2023), which values Schwab at 19x P/EBT.
I would expect its P/EBT between 12-15x P/EBT, thus a 20% to 40% decline from its current price.
Support for declining deposits
I want to take an extra step to explain my cynical stance that I think its cash deposit is likely to continue the declining trend despite management's confident tones during its latest business updates.
I noticed in a few instances the management painted an overly rosy picture. Let me highlight one example below.
Portfolio Duration
Y23 Spring Business Update (From Walter Bettinger):
We did not extend our portfolio duration2 outside our normal range (2.75 - 4.00 years) during the pandemic-driven ZIRP period, while overall asset duration stayed around 2.5 years
Schwab (Y23 Spring Business Update)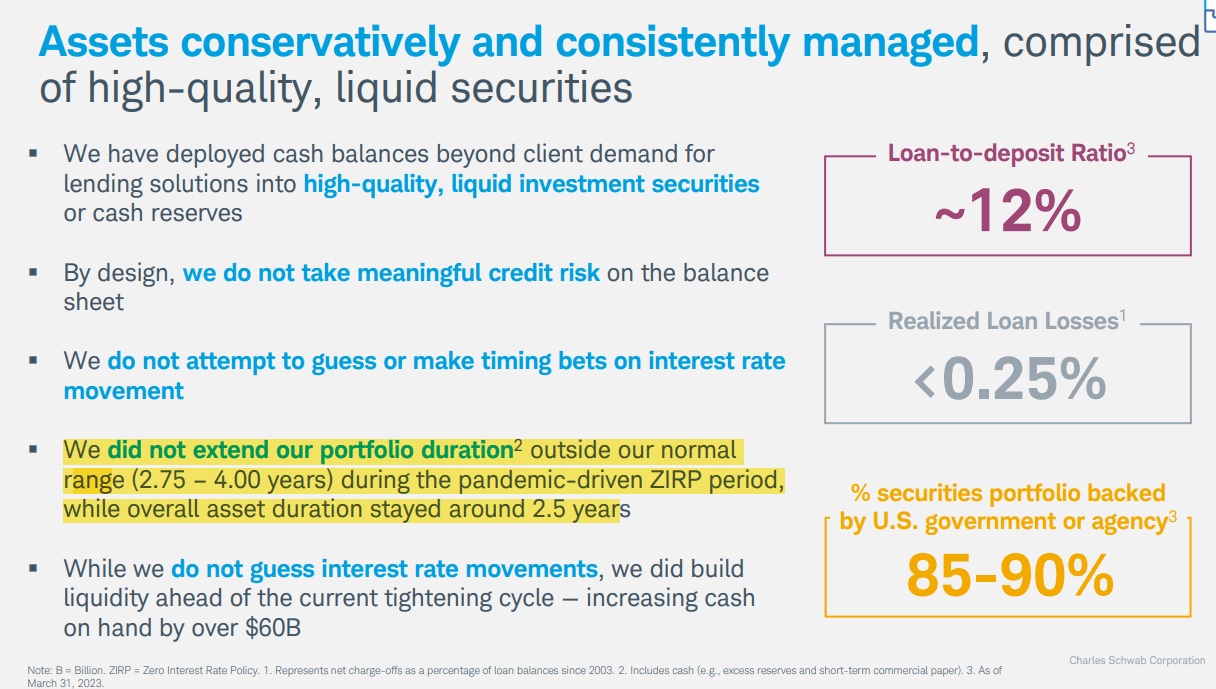
Y22 10K filings show:
70% of its asset book includes AFS, HTM, and bank loans. More than 50% of its AFS and HTM securities have 10Y+ maturities. My napkin math shows its AFS and HTM portfolio duration is at least 8 years.
Schwab (Y22 10k filing)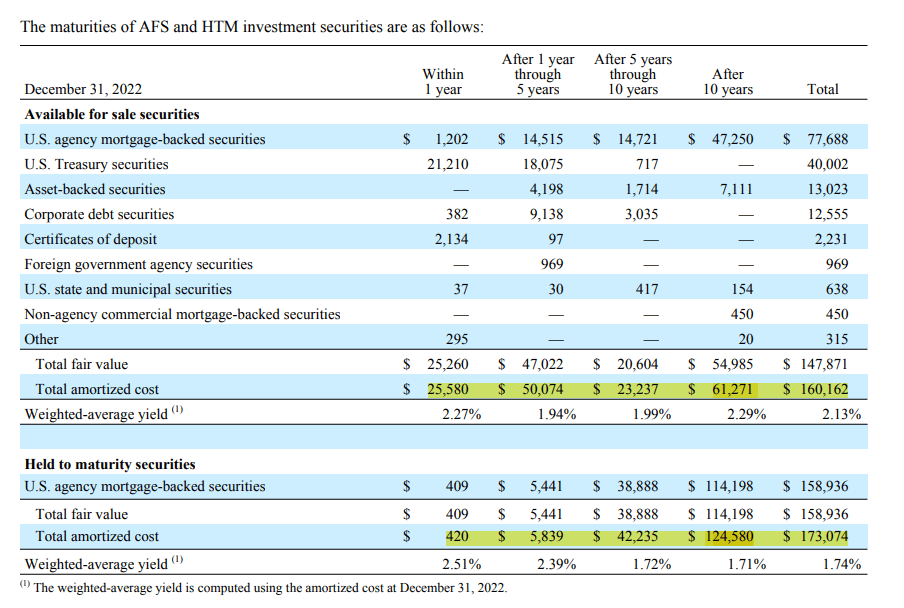
Where does 2.5 Year duration come from?
Out of its $500Bn asset book, 30% are cash, cash equivalents, and receivable, which has zero duration. But including all of that, I still couldn't arrive at a 2.5-year duration for the whole portfolio. My guess is at one point during the entire ZIRP period, it might hit a 2.5-year duration, but certainly not the current reality.
Schwab (Y22 10k filing)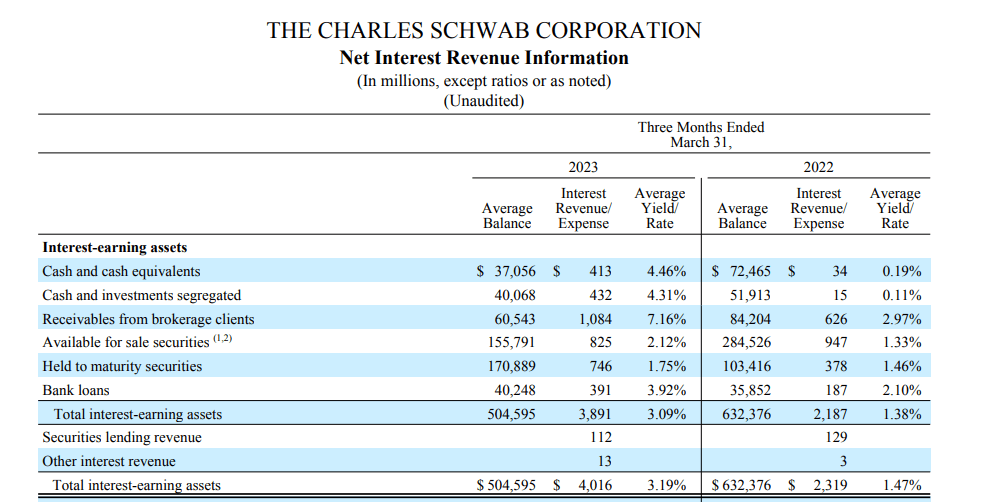
This article was written by

Analyst’s Disclosure: I/we have no stock, option or similar derivative position in any of the companies mentioned, and no plans to initiate any such positions within the next 72 hours. I wrote this article myself, and it expresses my own opinions. I am not receiving compensation for it (other than from Seeking Alpha). I have no business relationship with any company whose stock is mentioned in this article.
Seeking Alpha's Disclosure: Past performance is no guarantee of future results. No recommendation or advice is being given as to whether any investment is suitable for a particular investor. Any views or opinions expressed above may not reflect those of Seeking Alpha as a whole. Seeking Alpha is not a licensed securities dealer, broker or US investment adviser or investment bank. Our analysts are third party authors that include both professional investors and individual investors who may not be licensed or certified by any institute or regulatory body.