IDU: Utilities Dashboard For April

Summary
- Gas utilities are close to their historical baseline in valuation and quality.
- Other subsectors are overvalued by 16% to 30% based on my metrics.
- IDU: an alternative to XLU.
- 10 utilities stocks cheaper than their peers in April.
- Quantitative Risk & Value members get exclusive access to our real-world portfolio. See all our investments here »
Daniel Balakov
This monthly article series shows a dashboard with aggregate industry metrics in utilities. It is also a top-down analysis of sector ETFs like the Utilities Select Sector SPDR ETF (XLU) and the iShares U.S. Utilities ETF (NYSEARCA:IDU), whose largest holdings are used to calculate these metrics.
Shortcut
The next two paragraphs in italic describe the dashboard methodology. They are necessary for new readers to understand the metrics. If you are used to this series or if you are short of time, you can skip them and go to the charts.
Base Metrics
I calculate the median value of five fundamental ratios for each industry: Earnings Yield ("EY"), Sales Yield ("SY"), Free Cash Flow Yield ("FY"), Return on Equity ("ROE"), Gross Margin ("GM"). The reference universe includes large companies in the U.S. stock market. The five base metrics are calculated on trailing 12 months. For all of them, higher is better. EY, SY and FY are medians of the inverse of Price/Earnings, Price/Sales and Price/Free Cash Flow. They are better for statistical studies than price-to-something ratios, which are unusable or non available when the "something" is close to zero or negative (for example, companies with negative earnings). I also look at two momentum metrics for each group: the median monthly return (RetM) and the median annual return (RetY).
I prefer medians to averages because a median splits a set in a good half and a bad half. A capital-weighted average is skewed by extreme values and the largest companies. My metrics are designed for stock-picking rather than index investing.
Value and Quality Scores
I calculate historical baselines for all metrics. They are noted respectively EYh, SYh, FYh, ROEh, GMh, and they are calculated as the averages on a look-back period of 11 years. For example, the value of EYh for hardware in the table below is the 11-year average of the median Earnings Yield in hardware companies.
The Value Score ("VS") is defined as the average difference in % between two valuation ratios (EY, SY) and their baselines (EYh, SYh). FY is reported for consistency with other sector dashboards, but it is ignored in utilities’ score to avoid some inconsistencies. The same way, the Quality Score ("QS") is the average difference between the two quality ratios (ROE, GM) and their baselines (ROEh, GMh).
The scores are in percentage points. VS may be interpreted as the percentage of undervaluation or overvaluation relative to the baseline (positive is good, negative is bad). This interpretation must be taken with caution: the baseline is an arbitrary reference, not a supposed fair value. The formula assumes that the two valuation ratios are of equal importance.
Current data
The next table shows the metrics and scores as of last week's closing. Columns stand for all the data named and defined above.
VS | QS | EY | SY | FY | ROE | GM | EYh | SYh | FYh | ROEh | GMh | RetM | RetY | |
Gas | -5.62 | -1.13 | 0.0527 | 0.4812 | -0.0633 | 9.27 | 36.54 | 0.0478 | 0.6129 | -0.0620 | 9.37 | 36.97 | 1.22% | -6.69% |
Water | -30.64 | 7.10 | 0.0297 | 0.1431 | -0.0500 | 10.88 | 56.42 | 0.0368 | 0.2467 | -0.0319 | 9.68 | 55.43 | 4.23% | 4.69% |
Electricity and Multi | -16.60 | -8.80 | 0.0454 | 0.4033 | -0.0778 | 8.22 | 38.12 | 0.0512 | 0.5162 | -0.0478 | 9.79 | 38.74 | 3.31% | -4.99% |
Value and Quality chart
The next chart plots the Value and Quality Scores by industry. Higher is better.
Value and Quality in utilities (Chart: author; data: Portfolio123)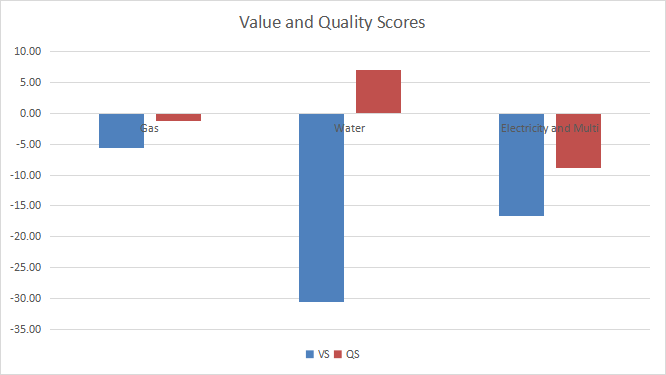
Evolution since last month
Valuations have deteriorated in all subsectors.
Score variations (Chart: author; data: Portfolio123)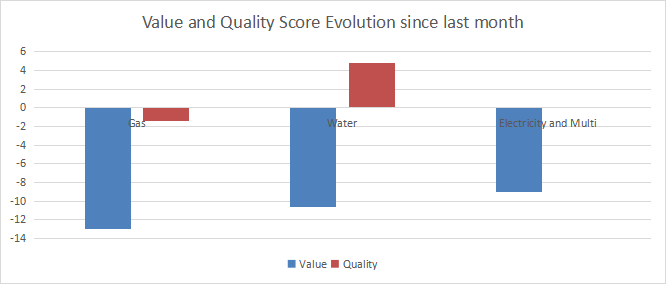
Momentum
The next chart plots median returns by subsector.
Momentum in utilities (Chart: author; data: Portfolio123)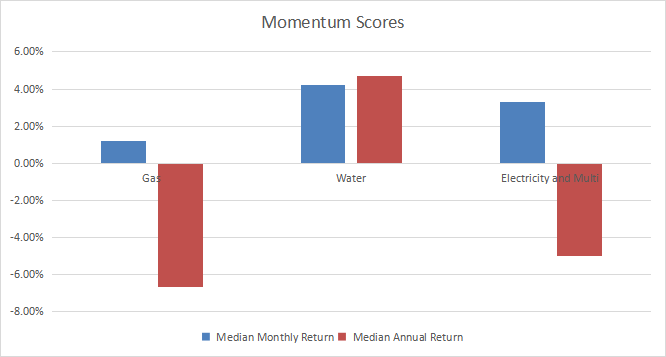
Interpretation
Gas utilities look the safest subsector regarding fundamental metrics: they are overvalued by only 5.6% relative to 11-year averages, and their quality score is close to the historical baseline. Electricity and water utilities are overvalued by about 17% and 31%, respectively. Water utilities have a fair quality score, but it is not good enough to justify such overvaluation.
Focus on IDU
The iShares U.S. Utilities ETF has been tracking the Russell 1000 Utilities RIC 22.5/45 Capped Index since 6/12/2000. The expense ratio is significantly more expensive than for XLU (0.39% vs. 0.10%), which tracks another index with a higher market capitalization threshold.
As of writing, the fund has a portfolio of 44 stocks. The next table lists the top 10 holdings with fundamental ratios. They represent 54.4% of asset value. Exposure to the top names is quite high: the heaviest one weighs over 13% of assets.
Ticker | Name | Weight% | EPS growth %TTM | P/E TTM | P/E fwd | Yield% |
NextEra Energy, Inc. | 13.27 | 15.47 | 37.32 | 25.07 | 2.40 | |
The Southern Co. | 6.67 | 45.08 | 21.99 | 19.93 | 3.78 | |
Duke Energy Corp. | 6.47 | -32.68 | 29.33 | 17.32 | 4.12 | |
Waste Management, Inc. | 5.8 | 25.45 | 30.65 | 27.61 | 1.69 | |
Sempra Energy | 4.12 | 61.41 | 23.13 | 17.04 | 3.11 | |
Dominion Energy, Inc. | 4.11 | -73.06 | 54.02 | 13.93 | 4.61 | |
American Electric Power Co., Inc. | 4.09 | -9.31 | 20.58 | 17.50 | 3.59 | |
Exelon Corp. | 3.61 | 26.26 | 19.17 | 17.83 | 3.42 | |
Xcel Energy, Inc. | 3.28 | 7.19 | 22.11 | 20.77 | 2.97 | |
Consolidated Edison, Inc. | 2.95 | 21.29 | 20.71 | 19.89 | 3.35 |
Since inception in June 2000, IDU is very close to XLU regarding return and risk metrics.
Total Return | Annual Return | Drawdown | Sharpe ratio | Volatility | |
IDU | 404.20% | 7.34% | -53.88% | 0.46 | 15.21% |
XLU | 417.77% | 7.47% | -53.01% | 0.48 | 14.94% |
Data calculated with Portfolio123
In summary, IDU is very similar to XLU in performance and volatility, despite a larger number of holdings (currently 44 vs. 32). IDU has a higher expense ratio and a lower liquidity, so there is no advantage to use it instead of XLU. Exposure to the top names is high in both funds, especially to NextEra Energy, which weighs 13.3% of asset value in IDU and 15.5% in XLU. Investors seeking a more balanced portfolio may prefer the Invesco S&P 500 Equal Weight Utilities ETF (RYU).
Dashboard List
I use the first table to calculate value and quality scores. It may also be used in a stock-picking process to check how companies stand among their peers. For example, the EY column tells us that an electricity company with an Earnings Yield above 0.0454 (or price/earnings below 22.03) is in the better half of the industry regarding this metric. A Dashboard List is sent every month to Quantitative Risk & Value subscribers with the most profitable companies standing in the better half among their peers regarding the three valuation metrics at the same time. The list below was sent to subscribers a few weeks ago based on data available at this time.
ONE Gas, Inc. | |
Hawaiian Electric Industries, Inc. | |
Black Hills Corp. | |
DTE Energy Co. | |
New Jersey Resources Corp. | |
NiSource, Inc. | |
Entergy Corp. | |
NRG Energy, Inc. | |
CenterPoint Energy, Inc. | |
Spire Inc. |
It is a rotational list with a statistical bias toward excess returns on the long-term, not the result of an analysis of each stock.
Editor's Note: This article discusses one or more securities that do not trade on a major U.S. exchange. Please be aware of the risks associated with these stocks.
Quantitative Risk & Value (QRV) features data-driven strategies in stocks and closed-end funds outperforming their benchmarks since inception. Get started with a two-week free trial now.

This article was written by

Step up your investing experience: try Quantitative Risk & Value for free now (limited offer).
I am an individual investor and an IT professional, not a finance professional. My writings are data analysis and opinions, not investment advice. They may contain inaccurate information, despite all the effort I put in them. Readers are responsible for all consequences of using information included in my work, and are encouraged to do their own research from various sources.
Analyst’s Disclosure: I/we have no stock, option or similar derivative position in any of the companies mentioned, and no plans to initiate any such positions within the next 72 hours. I wrote this article myself, and it expresses my own opinions. I am not receiving compensation for it (other than from Seeking Alpha). I have no business relationship with any company whose stock is mentioned in this article.
Seeking Alpha's Disclosure: Past performance is no guarantee of future results. No recommendation or advice is being given as to whether any investment is suitable for a particular investor. Any views or opinions expressed above may not reflect those of Seeking Alpha as a whole. Seeking Alpha is not a licensed securities dealer, broker or US investment adviser or investment bank. Our analysts are third party authors that include both professional investors and individual investors who may not be licensed or certified by any institute or regulatory body.