Lowe's: Leveraging Strong Brand Awareness And Housing Market Trends For Continued Growth

Summary
- The company's strong brand awareness with consumers has allowed it to use pricing power to increase the average amount spent per year and the average ticket size.
- According to my research, Lowe's benefits from rising housing prices as consumers tend to spend a portion of their home's value on home improvement and renovation expenses.
- Lowe's strong stance on buyback initiative will drive incremental growth in EPS, with the possibility of achieving an IRR of 17% over the next 5 years.
JHVEPhoto/iStock Editorial via Getty Images
Thesis
Lowe's (NYSE:LOW) has a strong business model and the company's strong brand awareness with consumers has allowed it to use pricing power to increase the average amount spent per year and the average ticket size. My research indicate that consumers tend to spend a fix portion of the value of their home towards home improvement products annually, this means that consumer are willing to spend more as their home increase in value. With management's initiative in share buybacks, I forecast Lowe's EPS can grow at high-double digits. Based on my valuation analysis, Lowe's share price has the potential to deliver an Internal Rate of Return of 17%, including dividends. Overall, with a forward P/E (GAAP) multiple of 15x, I have a bullish stance on Lowe's and believe it presents a compelling investment opportunity.
Thesis Explainer
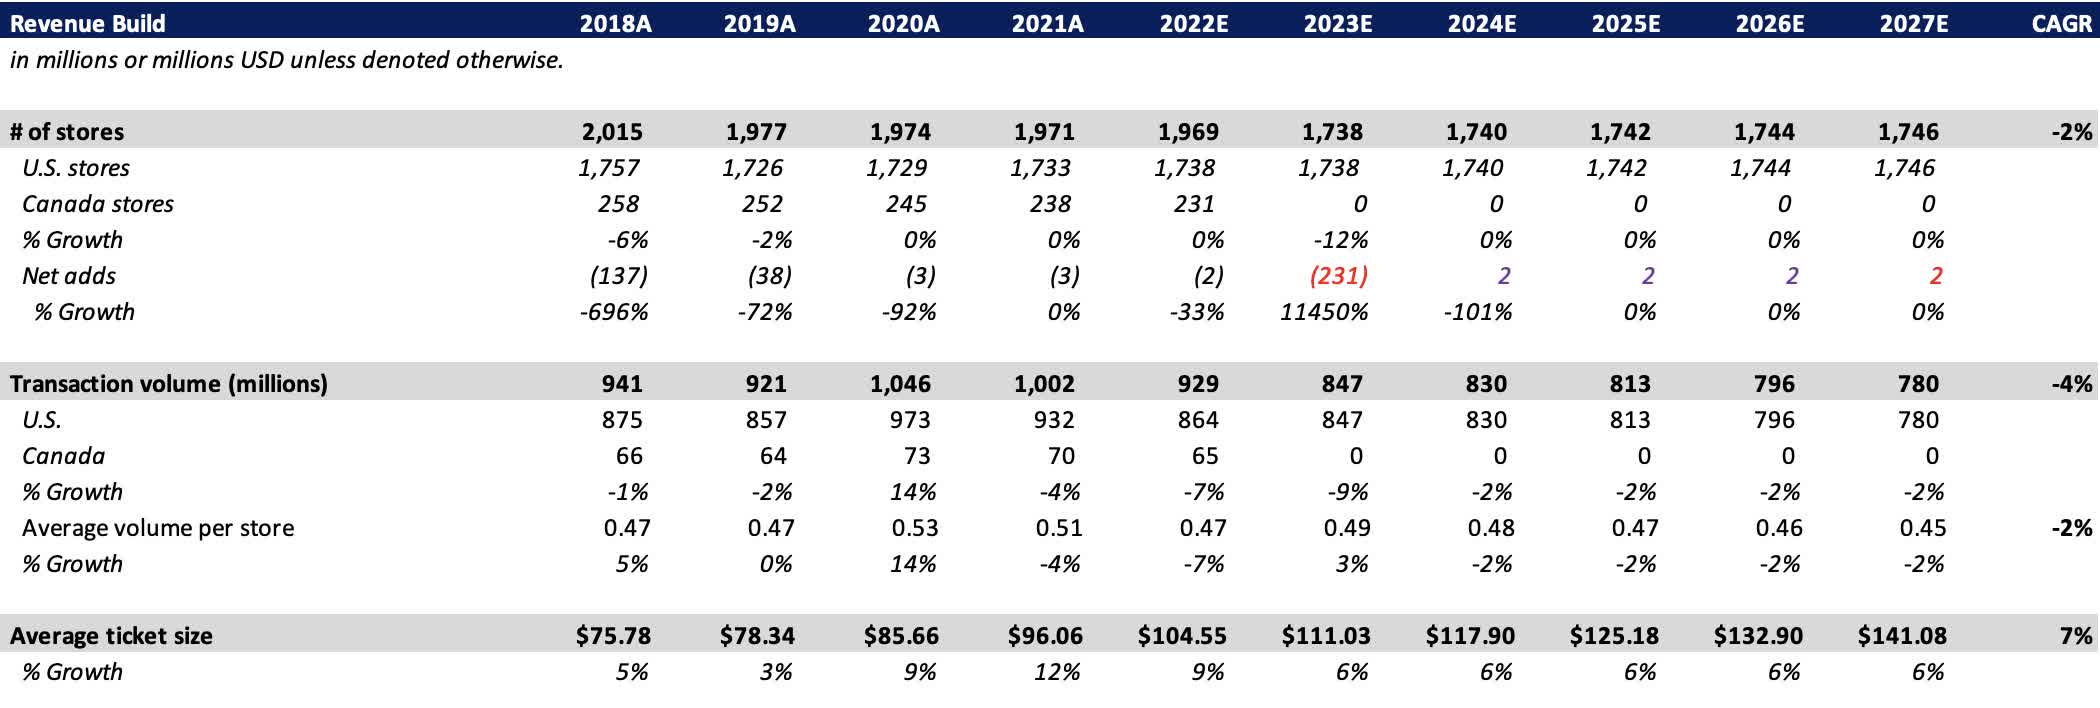
The following table shows that over the last five years, Lowe's has continuously increased the average ticket size by mid-single digits, with a growth rate in the low double digits in the last two years. This growth is evident that Lowe's is able to keep a competitive edge in the industry by providing excellent products and outstanding customer service. Additionally, this pattern demonstrates Lowe's ability to hike prices on customers and its excellent ability to hedge against inflation. This is further supported by Lowe's strong brand recognition and reputation in the home improvement retail industry. As such, I anticipate that this trend will continue into the foreseeable future, leading to sustained revenue growth.
| Fiscal Year End (1/31) | 2017A | 2018A | 2019A | 2020A | 2021A | 2022E | 2023E | 2024E | 2025E | 2026E | 2027E |
| Average Ticket Size | $72 | $76 | $78 | $86 | $96 | $105 | $111 | $118 | $125 | $146 | $141 |
Source: 10-K filings, Author's Projections
Furthermore, my research indicates that consumers has consistently allocate between 0.08% to 0.10% of their home's value towards home improvement and renovation expenses annually. This suggests that as housing prices continue to rise over time, consumers are willing to increase their spending on home improvement projects accordingly. The graph below shows two key metrics: the average amount spent by consumers at Lowe's each year, and as a percentage of the average home sales prices in the United States.
| Fiscal Year End (1/31) | 2019A | 2020A | 2021A | 2022E | 2023E | 2024E | 2025E | 2026E | 2027E |
| Spent per Year | $310 | $371 | $404 | $404 | $420 | $438 | $455 | $474 | $494 |
| % of Average Home Sales | 0.08% | 0.10% | 0.09% | 0.08% | 0.08% | 0.08% | 0.08% | 0.08% | 0.08% |
Source: Macrotrends, United States Census Bureau, Federal Reserve Economic Data, Urban Institute, 10-K filings, Author's Projections
The following steps will demonstrate how I arrived at these figures:
- U.S. homeowners is computed by U.S. population x % homeownership, and future projection growth were based on U.S. Census, and Urban Institute.
- Average visit per U.S. homeowner is computed by U.S. transaction volume / U.S. homeowners.
- Average $ spent per year is calculated by average visit per U.S. homeowner x Average ticket size.
- % of average home sales is computed by average $ spent per year / average sales price of houses in United States.
Calculation of Key Metrics (Macrotrends, United States Census Bureau, Federal Reserve Economic Data, Urban Institute, 10-K filings, Author's Projections)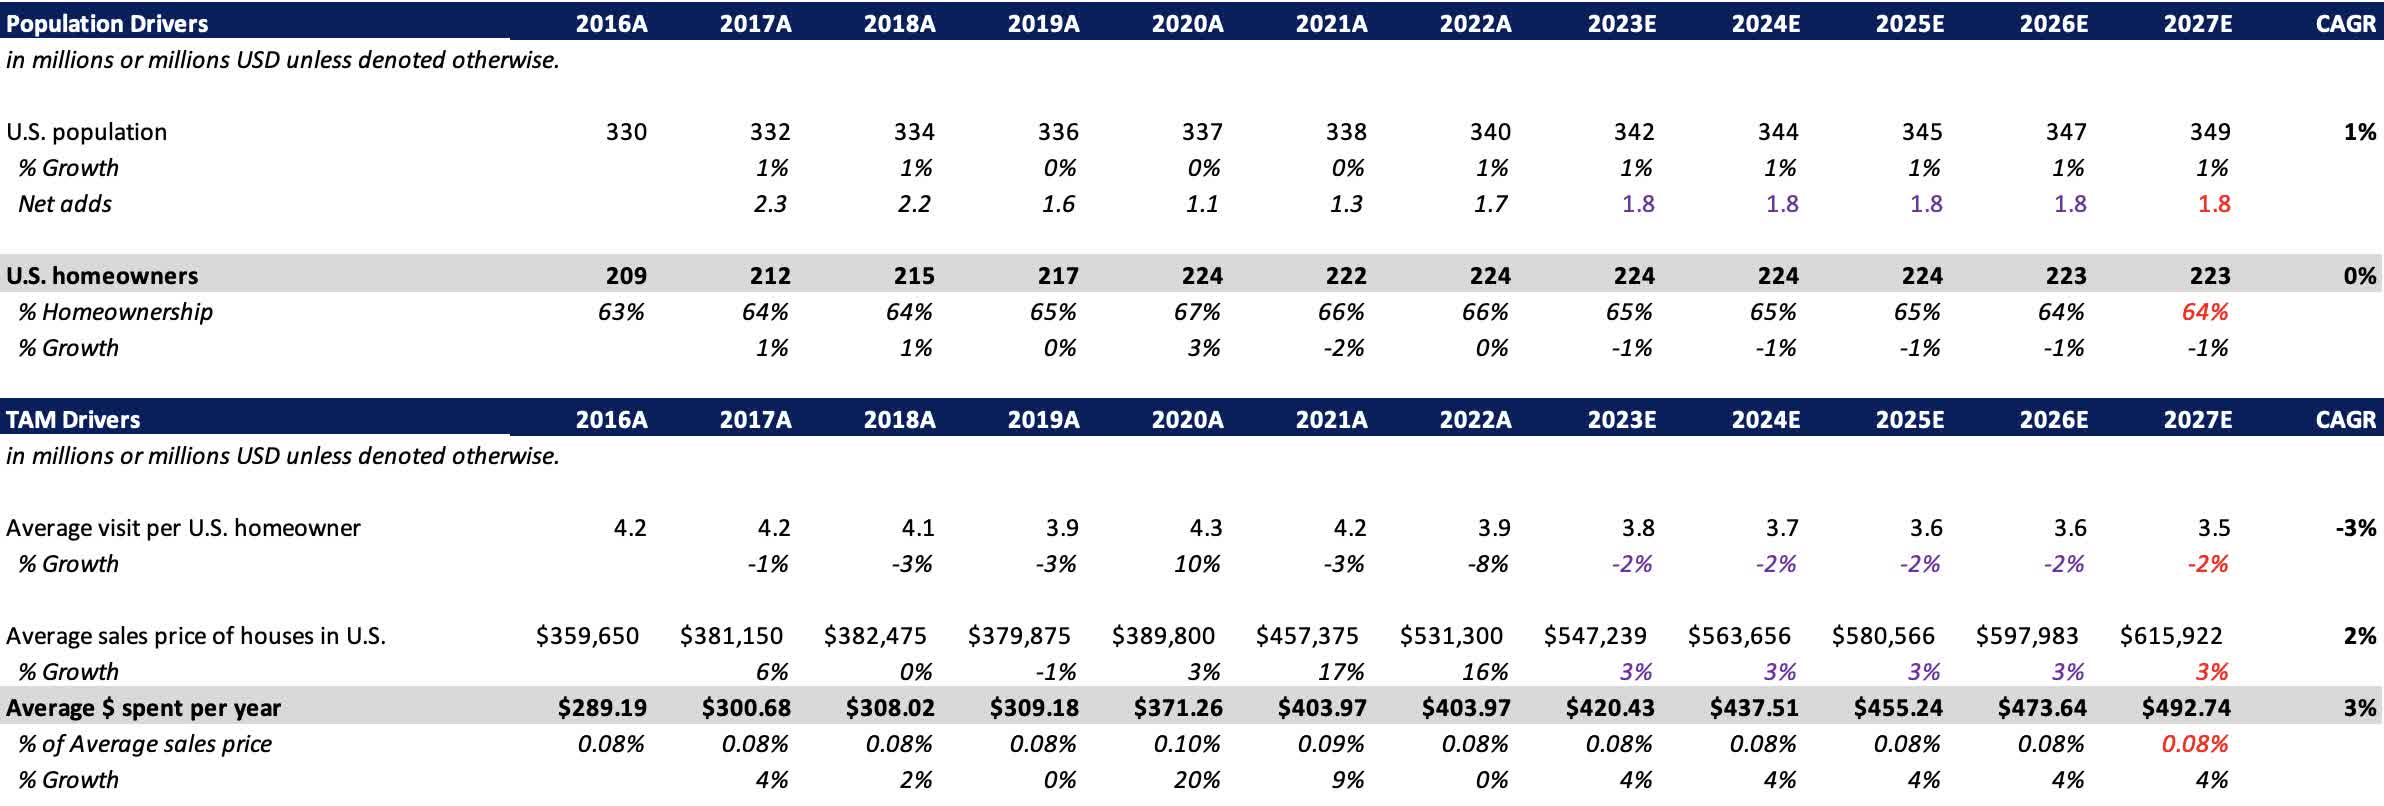
In my view, with over 1,700 locations spread across North America, Lowe's has a substantial physical footprint that offers the business significant bargaining strength with suppliers and manufacturers in addition to its strong pricing power and brand recognition. After the divestiture of its underperforming Canadian business, the company is now better positioned to achieve higher margins.
Lowe's Store Locations in the USA (ScrapeHero)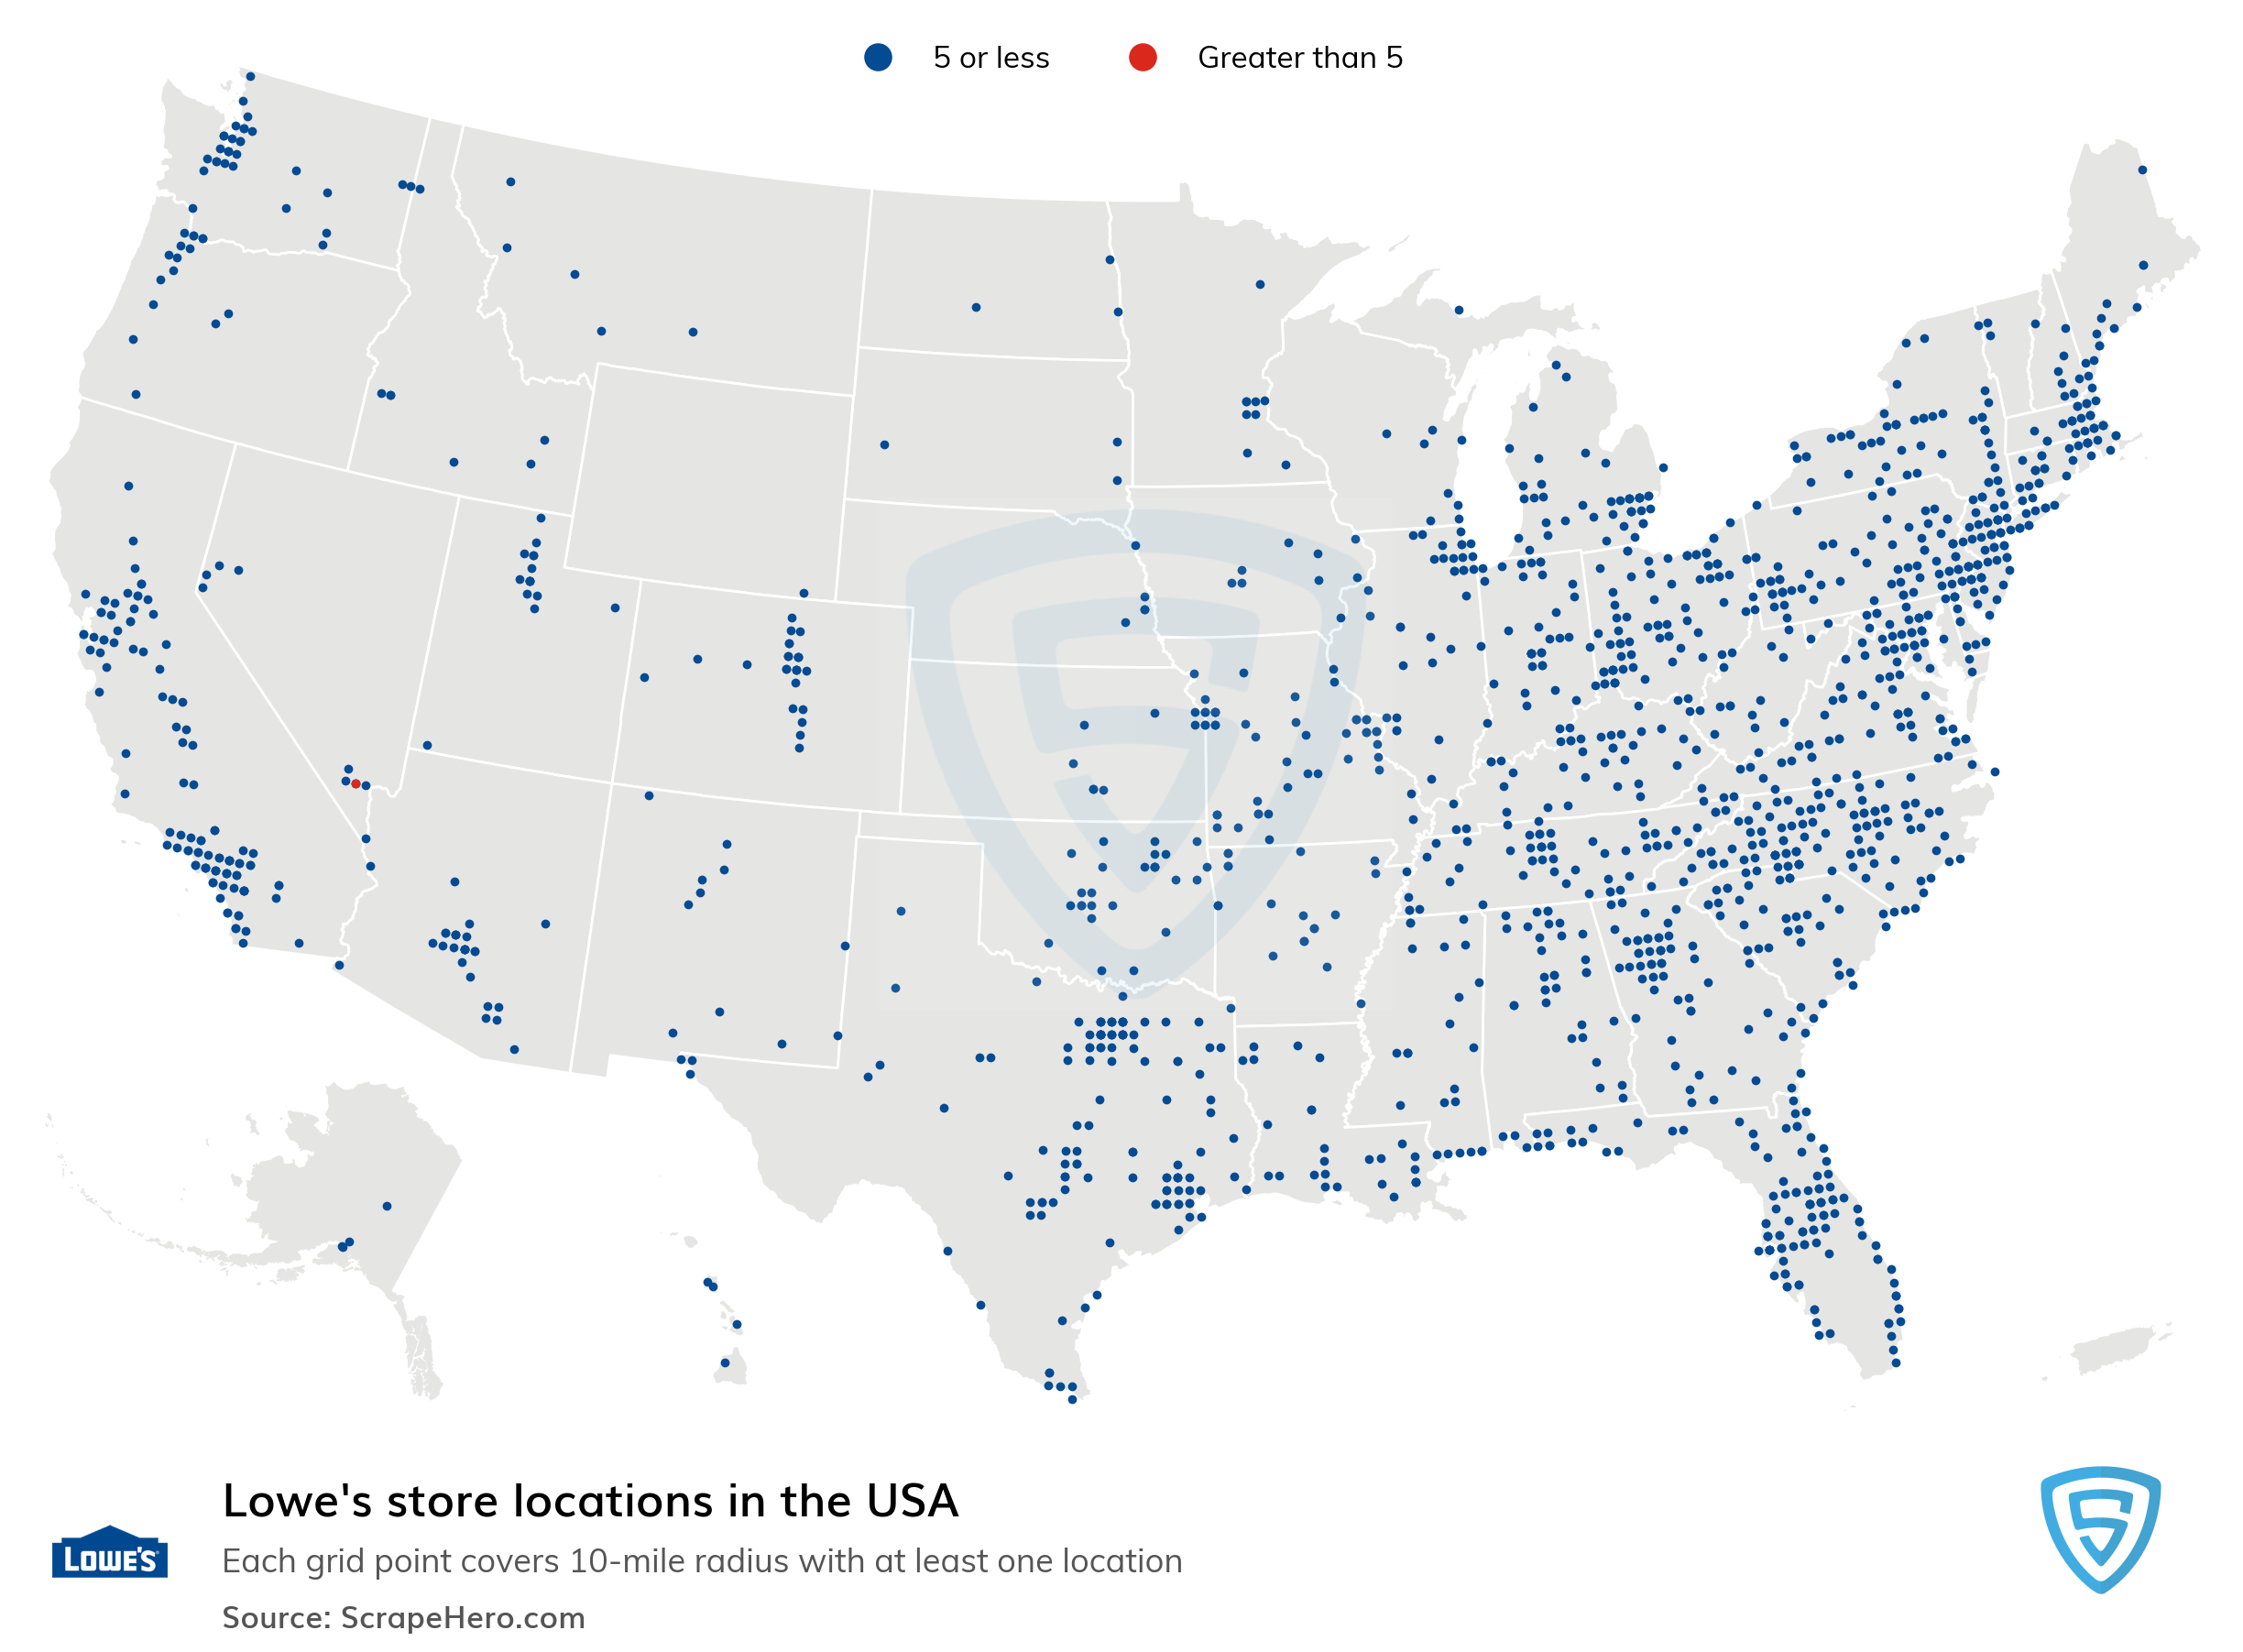
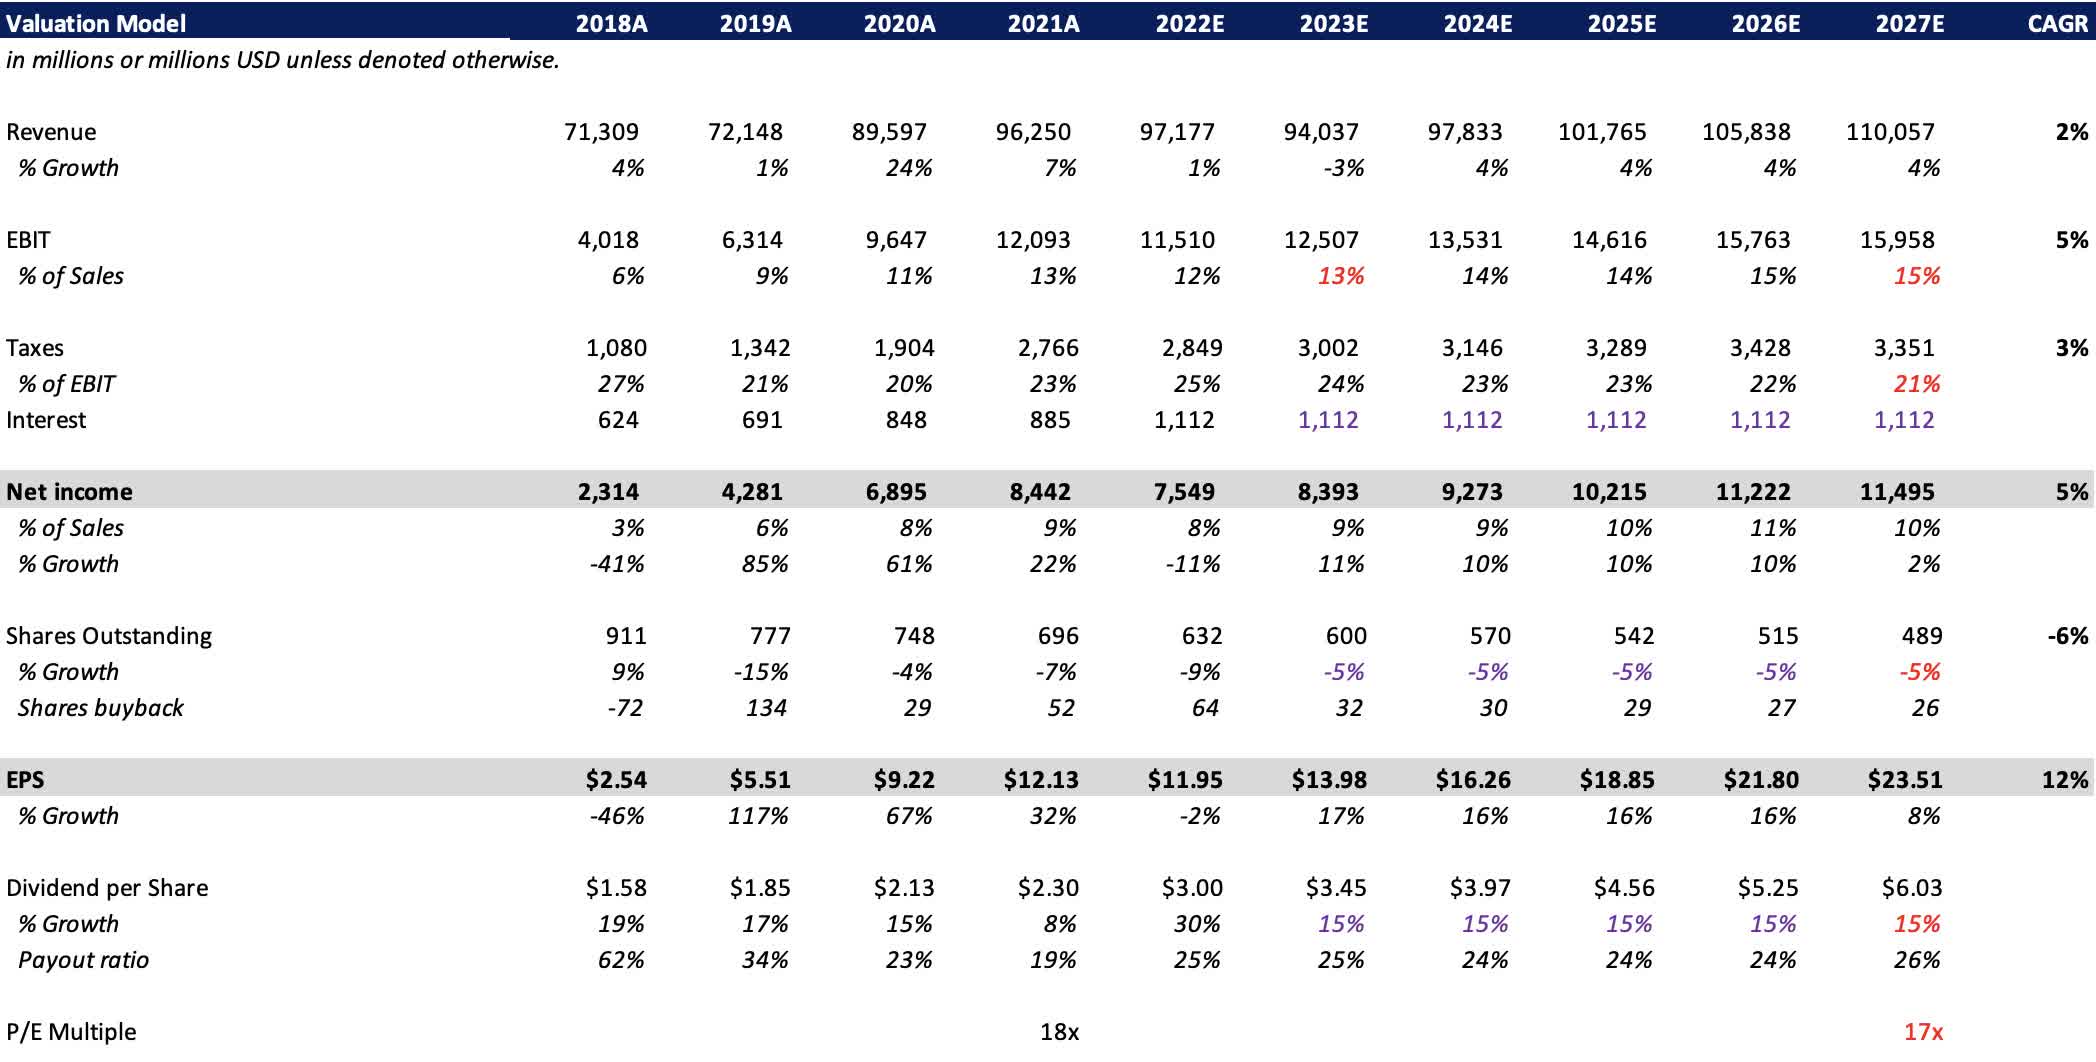
The following graph illustrates both the past EBIT margin of Lowe's and my projection for its future margin.
| Fiscal Year End (1/31) | 2018A | 2019A | 2020A | 2021A | 2022E | 2023E | 2024E | 2025E | 2026E | 2027E |
| EBIT Margin | 6% | 9% | 11% | 13% | 12% | 13% | 14% | 14% | 15% | 15% |
Source: 10-K filings, Author's Projections
Lastly, Lowe's has made a concerted effort to return capital to shareholders through accelerated share buybacks. The company has managed to reduced its share count by almost 20% over the last 4 years. This is a clear indication of management's commitment to creating long-term value for it's shareholders, as fewer outstanding shares means that Lowe's can increase their EPS incrementally.
The following table presents the percentage of total shares outstanding that Lowe's has repurchased in recent years, along with my projected buyback figures.
| Fiscal Year End (1/31) | 2019A | 2020A | 2021A | 2022E | 2023 - 2027E |
| % Buyback | -15% | -4% | -7% | -9% | -5% |
Source: 10-K filings, Author's Projections
Valuation
IRR Analysis:
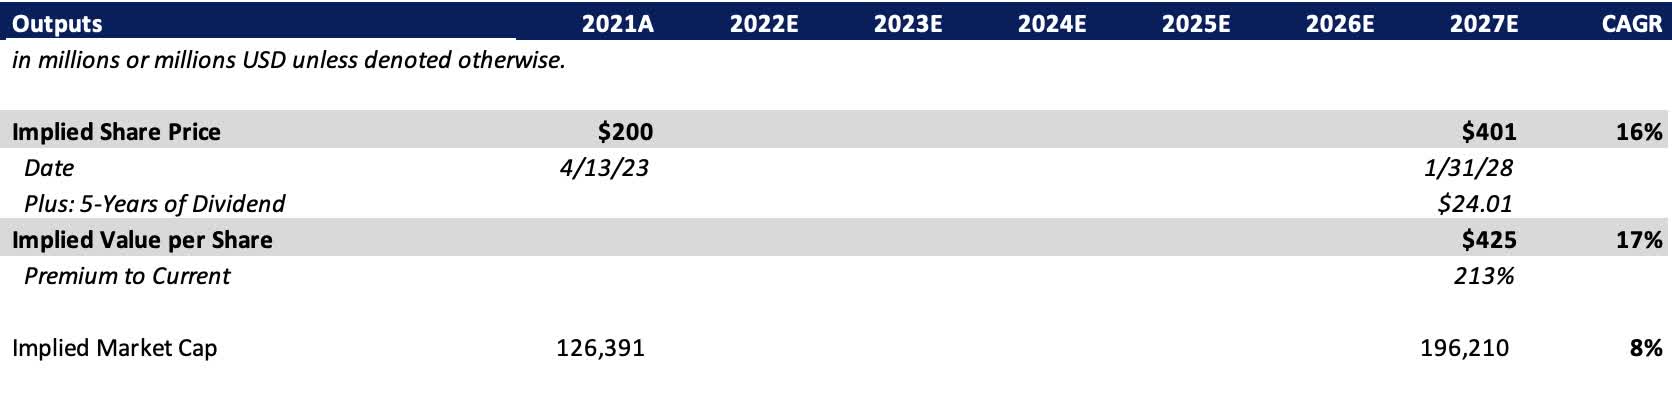
Based on my valuation analysis, I anticipate a 5-year IRR of 17% for Lowe's. In the next five years, I expect a modest 2% CAGR increase in the average sales price of houses in the United States, while the average visit per homeowner will continue to decrease at 2% per year following the historical trend. I project a 3% increase in the average amount spent per year per consumer at Lowe's, primarily driven by an increase in the average sales price of houses. However, I expect the percentage of the average sales price to remain stable at 0.08% due to a slowdown in the global economy.
I anticipate that the number of stores will remain stable, as Lowe's has been focusing on reinvesting in its existing stores. By the end of 2023, the number of stores is expected to decrease to 1738, down from 1971 after selling its underperforming Canadian operation. Furthermore, I forecast a slight expansion in EBIT margin to 15% in the medium term from 13% in FY2021, mainly driven by accretive margin growth after selling its low-margin Canadian business. I also expect Lowe's to continue its buyback effort through the medium term and maintain its dividend payout ratio at 25%. Overall, my valuation suggests that the implied share price for Lowe's will reach $392 over the next 5 years, with an implied value per share of $416 when dividends are included.
The screenshot below shows my valuation model for Lowe's.
Population & TAM Drivers (Macrotrends, United States Census Bureau, Federal Reserve Economic Data, Urban Institute, 10-K filings, Author's Projections) Revenue Build (10-K filings, Author's Projections) Valuation Model (10-K filings, Author's Projections) Valuation Outputs (Author's Projections)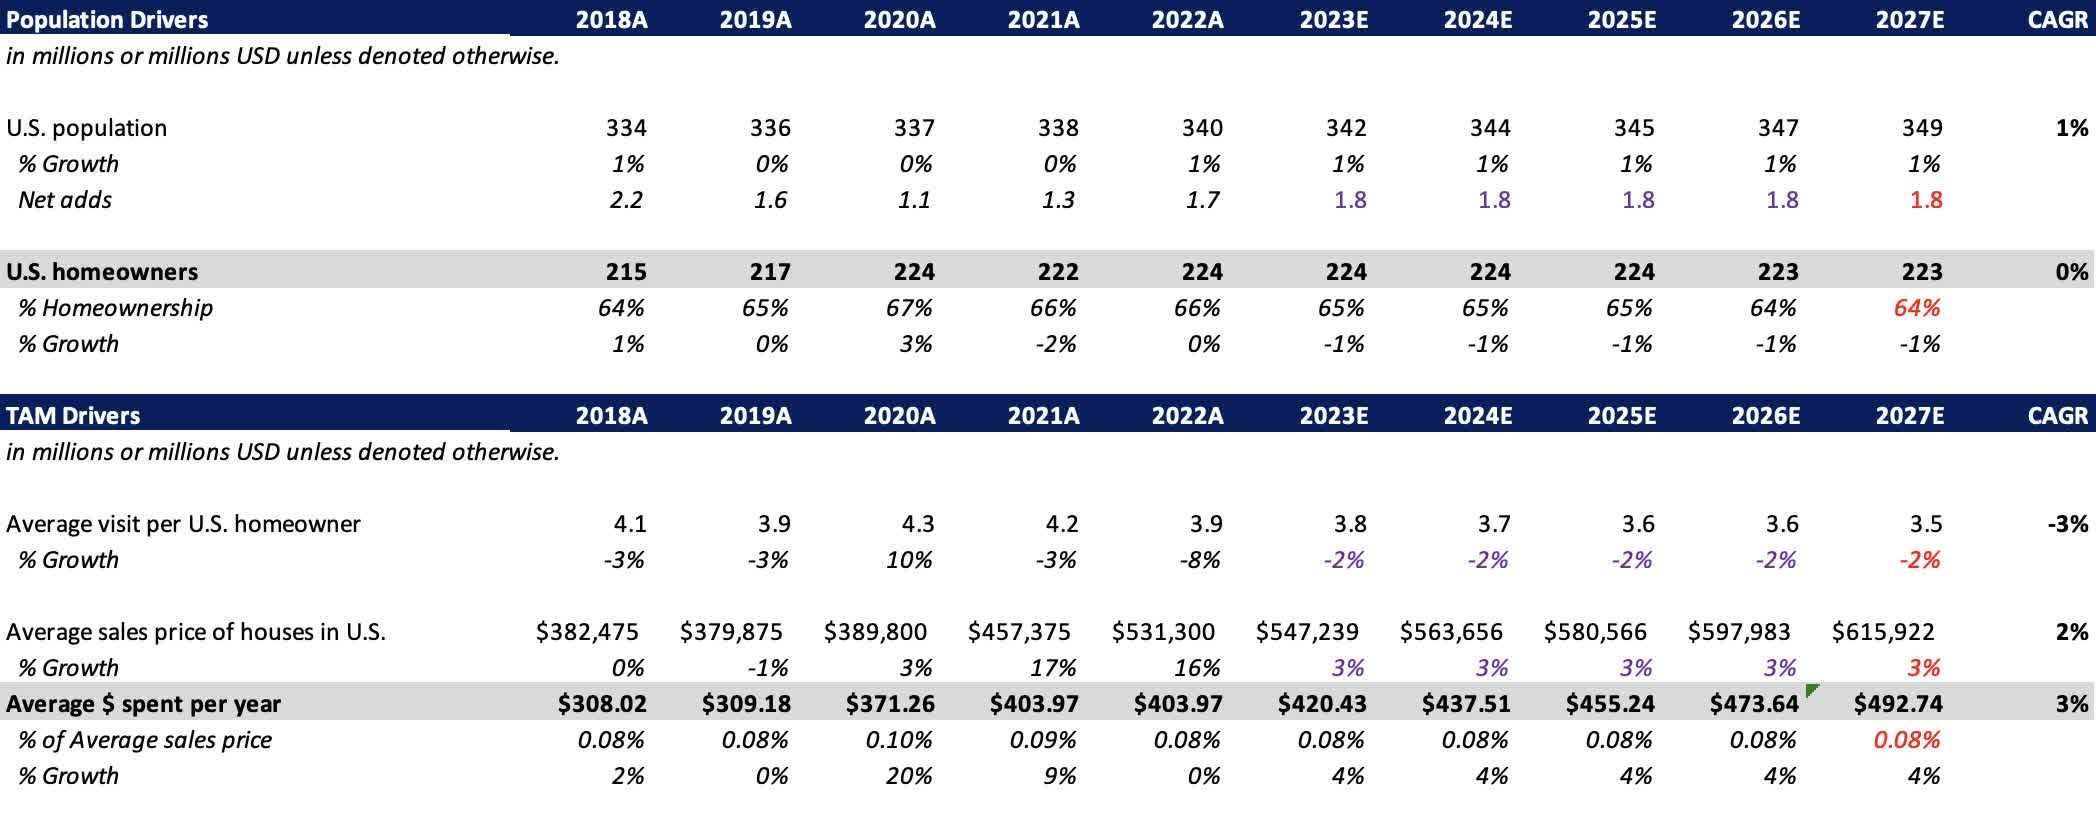
Comparable Analysis:
The table below compares Lowe's with its competitors, including Home Depot, Floor & Decor, Walmart, and Costco.
| P/E GAAP (FWD) | EV/EBITDA (FWD) | EBIT Margin | Revenue 3 Year (OTC:CAGR) | EPS Growth Diluted 3 Yr (OTC:CAGR) | |
| Lowe's | 14.7x | 11.4x | 10.5% | 10.4% | 22.8% |
| Home Depot | 18.7x | 13.5x | 15.3% | 12.6% | 17.6% |
| Floor & Decor | 35.8x | 19.7x | 9.4% | 27.8% | 24.5% |
| Walmart | 24.3x | 12.4x | 4.0% | 5.3% | -6.3% |
| Costco | 34.3x | 20.3x | 3.4% | 14.0% | 16.9% |
Source: Seeking Alpha (As of Apr 5, 2023)
By comparing Lowe's to its competitors, we can see that Lowe's has a lower GAAP P/E ratio of 14.7x compared to Home Depot's 18.7x, despite having the exact same business model, indicating that Lowe's is currently at a discount. Lowe's also has a lower EV/EBITDA ratio of 11.4x compared to Home Depot's 13.5x.
In terms of EBIT margin, Home Depot outperforms Lowe's with a margin of 15.3% compared to Lowe's 10.5%. However, Lowe's has a higher EPS growth diluted rate of 22.8% compared to Home Depot's 17.6%.
When comparing Lowe's to Floor & Decor, Walmart, and Costco, we can see that Lowe's has a lower P/E ratio and EV/EBITDA ratio than Floor & Decor. Lowe's also has a higher EBIT margin and revenue growth compared to Walmart and Costco. However, Floor & Decor has shown the highest EPS growth rate of 24.5% over the past three years.
Risk
Lowe's is subject to a variety of investment risks. One such risk for Lowe's is it's dependence on the housing market. As a retailer of home improvement products, Lowe's is highly dependent on the housing market. A slowdown in the housing market may discourage consumers from investing in home improvements projects, thereby affecting Lowe's revenue and earnings. As we saw in the housing market decline in 2022 and has negatively affected consumer spending, as consumer confidence reached 10-year lows according to The Michigan Consumer Sentiment Index. Additionally, competition from other home improvement retailers such as Home Depot and smaller local players may also affect Lowe's market share and profitability.
Conclusion
In summary, Lowe's presents a compelling investment opportunity in the North American home improvement market. With a strong brand recognition and pricing power. Showcased by the consistently increase its average ticket size and average amount spent per year. Additionally, Lowe's is trading at a relative discount compared to its peers. Furthermore, with consumers spending a portion of their home's value on home improvement and renovation expenses, Lowe's is well-positioned to benefit from rising housing prices. The company's extensive physical footprint and optimized supply chain also provide it with significant operational efficiency and bargaining power. With management's commitment to returning capital to shareholders through accelerated share repurchase program, EPS growth is expected to continue at high-double digits. Lowe's share price has the potential to deliver an IRR of 17%, including dividends, and as such, I am bullish on Lowe's and believe it is an attractive investment opportunity.
This article was written by

Analyst’s Disclosure: I/we have a beneficial long position in the shares of LOW either through stock ownership, options, or other derivatives. I wrote this article myself, and it expresses my own opinions. I am not receiving compensation for it (other than from Seeking Alpha). I have no business relationship with any company whose stock is mentioned in this article.
Seeking Alpha's Disclosure: Past performance is no guarantee of future results. No recommendation or advice is being given as to whether any investment is suitable for a particular investor. Any views or opinions expressed above may not reflect those of Seeking Alpha as a whole. Seeking Alpha is not a licensed securities dealer, broker or US investment adviser or investment bank. Our analysts are third party authors that include both professional investors and individual investors who may not be licensed or certified by any institute or regulatory body.