April MDA Breakout Stocks/ETFs Week 16 - 2023: High-Frequency Gainers To Give You An Edge

Summary
- Two new Breakout Stocks for Week 16 with better than 10% short-term upside, ETF updates and a Dow 30 Pick. Average cumulative returns for 2023 are +55.1% YTD.
- Last week, peak gains were in BBW +10.37%, RNW +7.7%, TPBH +6.9%. The Active ETF portfolio continues with YTD gains at +15.2%.
- The streak of weekly picks gaining over 10% in less than a week has reached 243 out of 307 trading weeks (79.1%) not considering multiple gainers or negative signals.
- Annual returns are simulated by adding 52 weekly selections though they could be compounded weekly. Since inception, over 450 stock picks have gained over 10% in less than a week.
- The MDA breakout picks continue to beat the S&P 500 into 7 consecutive years delivering +764.1% compound returns into 2023 and a CAGR +32.53%.
- Looking for a portfolio of ideas like this one? Members of Value & Momentum Breakouts get exclusive access to our subscriber-only portfolios. Learn More »
ClarkandCompany/E+ via Getty Images
Introduction
The Weekly Breakout Forecast continues my doctoral research analysis on MDA breakout selections over more than 8 years. This high frequency breakout subset of the different portfolios I regularly analyze has now exceeded 300 weeks of public selections as part of this ongoing live forward-testing research. The frequency of 10%+ returns in a week is averaging over 4x the broad market averages in the past 6+ years.
In 2017, the sample size began with 12 stocks, then 8 stocks in 2018, and at members' request since 2020, I now generate only 4 selections each week. In addition, 2 Dow 30 picks are provided using the MDA methodology, but I highly recommend the monthly Growth & Dividend mega cap breakout portfolios if you are looking for larger cap selections beyond only 30 Dow stocks.
As long term investors know, you can compound $10,000 into $1 million with 10% annual returns in less than 50 years. This model serves to increase the rate of 10% breakouts into 52 weekly intervals instead of years. In 2022, the worst market since 2008: 113 MDA picks gained over 5%, 52 picks over 10%, 22 picks over 15%, and 13 picks over 20% in less than week.
2023 Market Outlook
Ongoing record market intervention from the Fed and Treasury including over $400 billion in emergency loans for banks are signaling to many that the Fed may have to pivot from QT and rate hikes sooner than planned.
We are still waiting for the S&P 500 to make even a 3rd daily move this year greater than +/- 2%.
VMBreakouts.com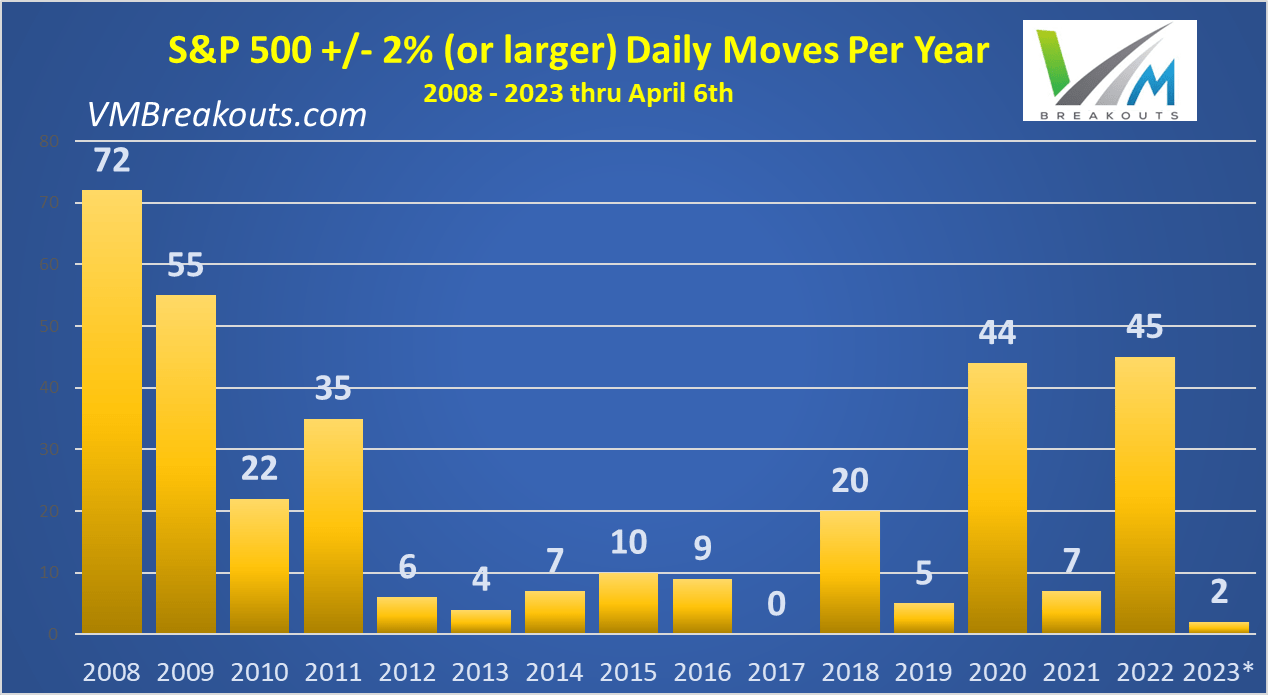
My theory, based on the patterns and incredible events of 2018, 2020, and 2022 with low subsequent year volatility, is that investors crowd into S&P 500 index stocks after the most painful years. This crowding is contributing to extremely low VIX and low volatility of the "Market" index of 500 stocks, while omitting the 7,000+ smaller cap stocks that are lagging this year and not in the S&P 500 index for VIX measures. Watch the Mega caps closely! If they breakdown the market will breakdown sharply. The Technology sector gauges remain a key bellwether of the mega cap momentum strength.
Momentum Gauges Dashboard for Week 16
S&P 500 and Market gauges are positive ahead of Week 16. However, sectors remain mixed with a lot of reversals. The Technology sector is a key bellwether for markets with just 3 mega cap stocks larger than the market cap of all the stocks combined in each of four entire sectors. Usually as the tech sector goes so goes the "market" indices and the technology sector gauges have been negative since April 4th.
app.VMBreakouts.com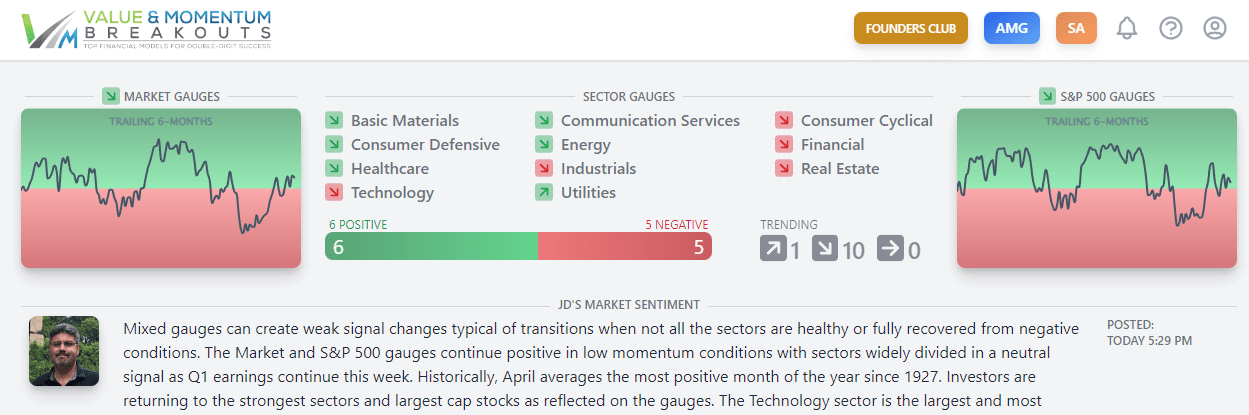
Momentum continues in the noisy chop highlighted in yellow as the market tries to gain momentum with divided sectors. We are seeing frequent daily reversals in the FANG mega caps stocks and US dollar in the past week. It looks like positive momentum is setting up for a stronger move as Q1 earnings continue this week.
app.VMBreakouts.com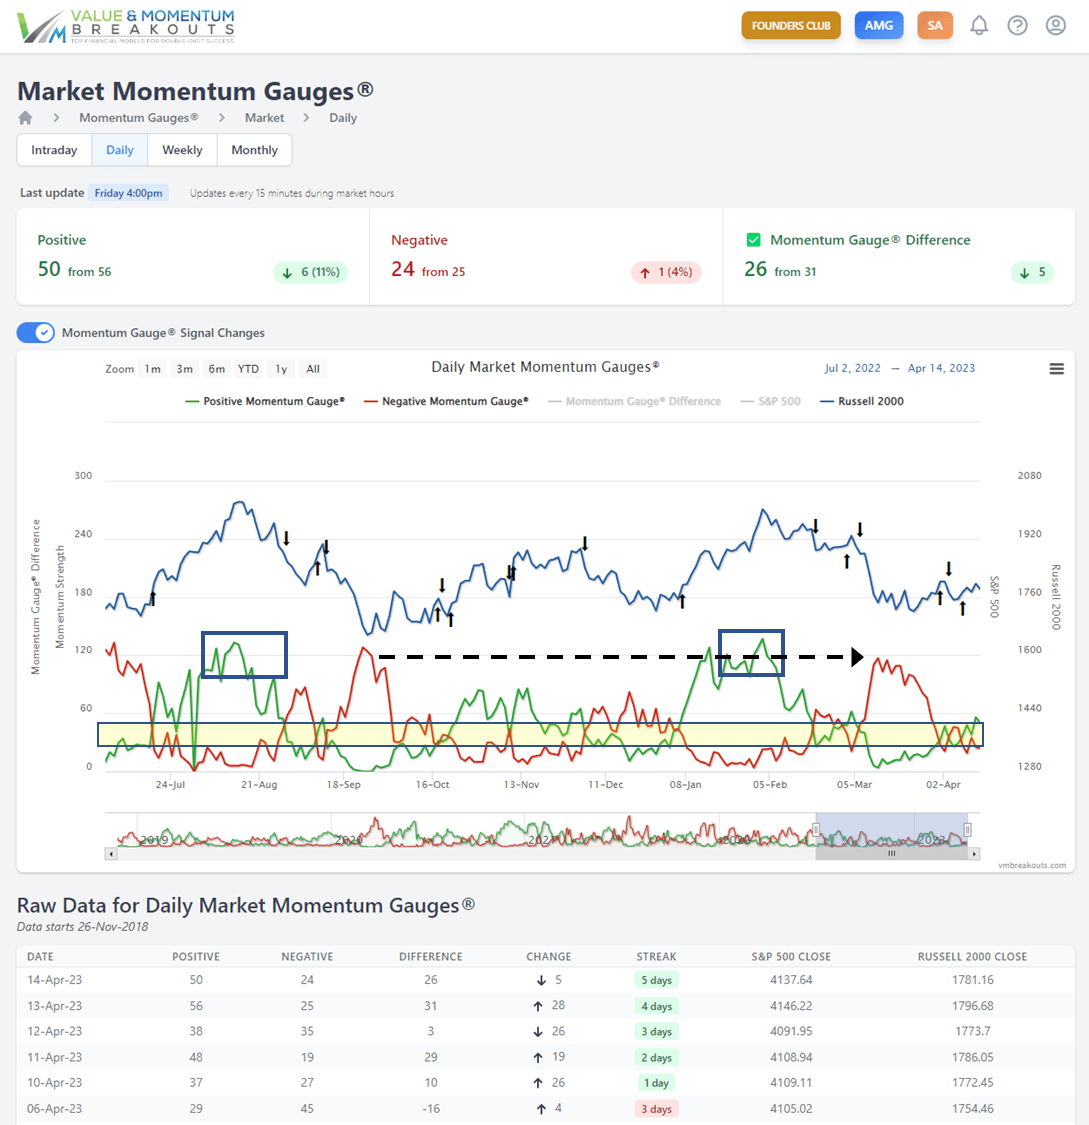
Why do finance companies admit that "timing is everything," but when it comes to investing your money the majority tell their clients to "just buy/hold and try to ignore the downturns?" I submit most investors would rely on timing signals, but without a model like the gauges they are forced to try to keep their clients in buy/hold positions for 24 months with no gains, or worse.
If timing helps you gain just 1% a week, you will significantly outperform all the long term market averages.
Long time members know, we can consistently beat the markets by avoiding the most negative weeks and loading up during the most positive signals. Only the financial industry has incentives to make you to stay in the markets year round.
My strategy for 2023 is to stay generally bearish while adjusting for large bear bounces in anticipation of strong similarities to the August topping pattern. Economic data, inflation, manufacturing productivity, home sales, and the latest banking crisis continue to show recessionary weakness into rising interest rate hikes at the highest levels since Sep 2007.
Mid-year 2023 is where things may get interesting with potential for a Fed pivot. Dip-buyers will continue to try to pull this anticipated pivot event forward in time extending high market volatility while the Fed hikes rates. Mid-year I also plan to leverage strong results from a new June Russell Reconstitution anomaly we found last year that is actively tracked on the dashboard: FTSE Russell Reconstitution Anomaly Study - Strong +22.7% Difference After 5 Months
Some of my forecast articles for 2023 are here for your benefit.
- Forecasting The S&P 500 For 2023: Year Of The Fed-Pivot And More Record Volatility (SP500)
- My Response To The SA Roundtable: 2023 Technical Analysis / Quantitative Look Ahead
- Value, Momentum Breakout View: Debt Ceiling 'Extraordinary Measures' And Fed's QT Program
Weekly Breakout Returns
The ongoing competition between the Bounce/Lag Momentum model (from Prof Grant Henning, PhD Statistics) and MDA Breakout picks (from JD Henning, PhD Finance) are shown below with / without using the Momentum Gauge trading signal. The per-week returns equalize the comparison where there were only 16 positive trading weeks last year using the MDA trading signal (negative values below 40).
VMBreakouts.com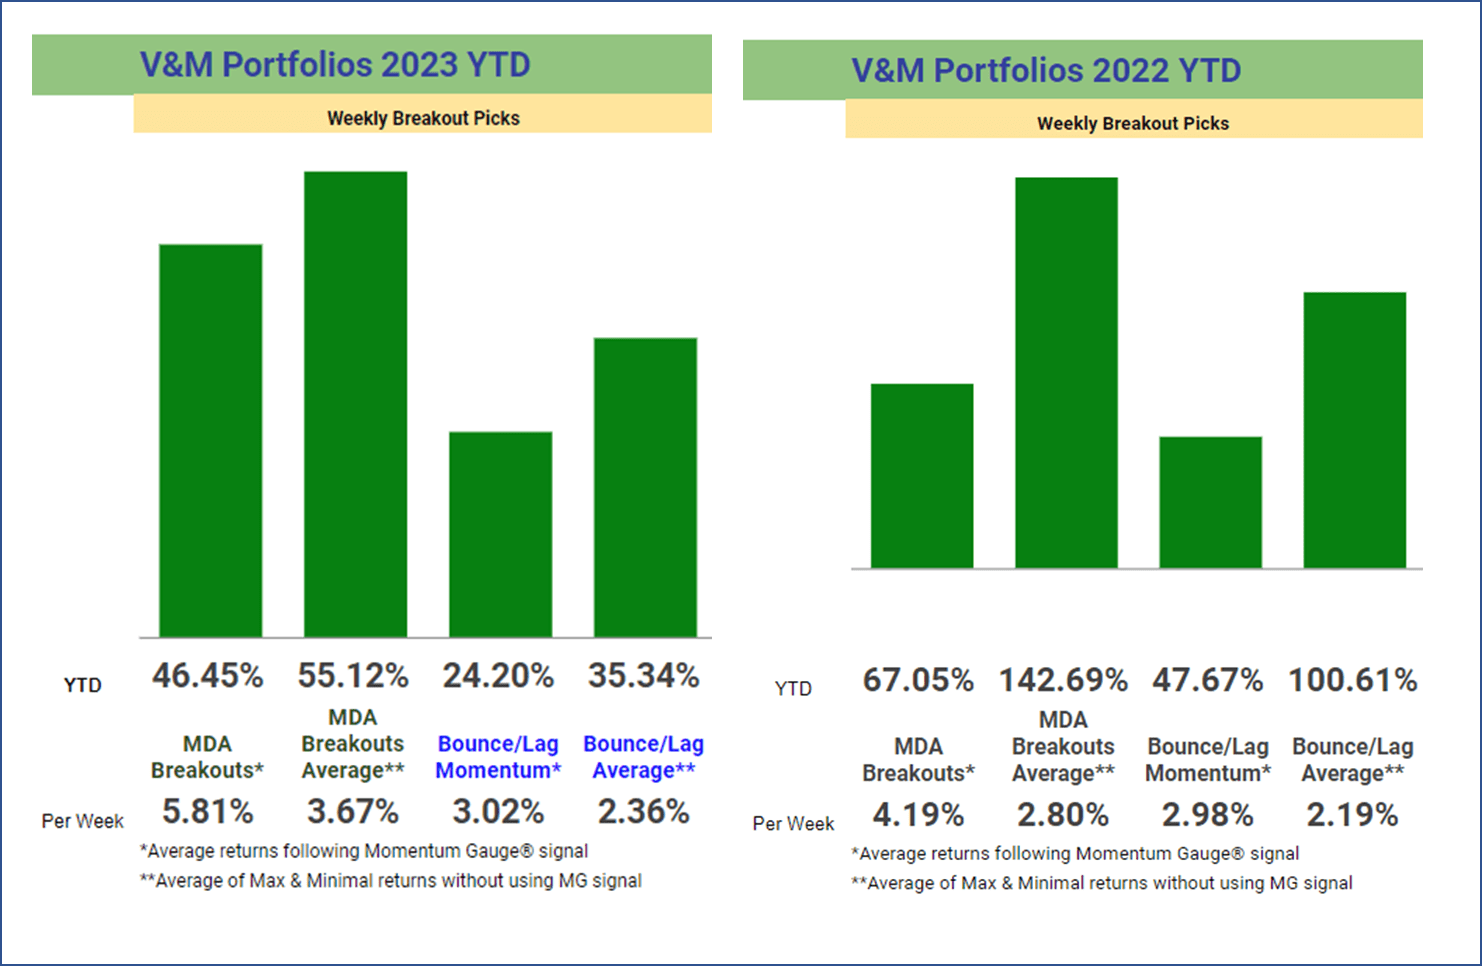
For 2022, the worst market since 2008: 113 MDA picks gained over 5%, 52 picks over 10%, 22 picks over 15%, and 13 picks over 20% in less than week. These are statistically significant high frequency breakout results despite many shortened holiday weeks.
V&M Multibagger List
While not the purpose of my model, longer term (using the trading video in FAQ #20) many of these selections may join the V&M Multibagger list now at 125 weekly picks with over 100%+ gains, 48 picks over 200%+, 19 picks over 500%+ and 9 weekly picks with over 1000%+ gains since January 2019 such as:
- Celsius Holdings (CELH) +1,749.4%
- Enphase Energy (ENPH) +1,410.5%
- Alexco Resources AXU +1,275.7%
- Northern Oil and Gas (NOG) +1,213.11%
- Trillium Therapeutics TRIL +1,008.7%
More than 450 stocks have gained over 10% in less than a week since this MDA testing began in 2017. Frequency comparison charts are at the end of this article. Readers are cautioned that these are highly volatile stocks that may not be appropriate for achieving your long term investment goals: How to Achieve Optimal Asset Allocation
Historical Performance Measurements
Historical MDA Breakout minimal buy/hold (worst case) returns have a compound average growth rate of 32.53% and cumulative minimum returns of +764.1% from 2017. 2023 represents a partial year. Last year the minimal cumulative returns for 2022 were -0.21%, average cumulative returns were +67.05%, and the best case cumulative returns were +360.25%. The chart reflects the most conservative measurements adding each 52 weekly return in an annual portfolio simulation, though each weekly selection could be compounded weekly.
VMBreakouts.com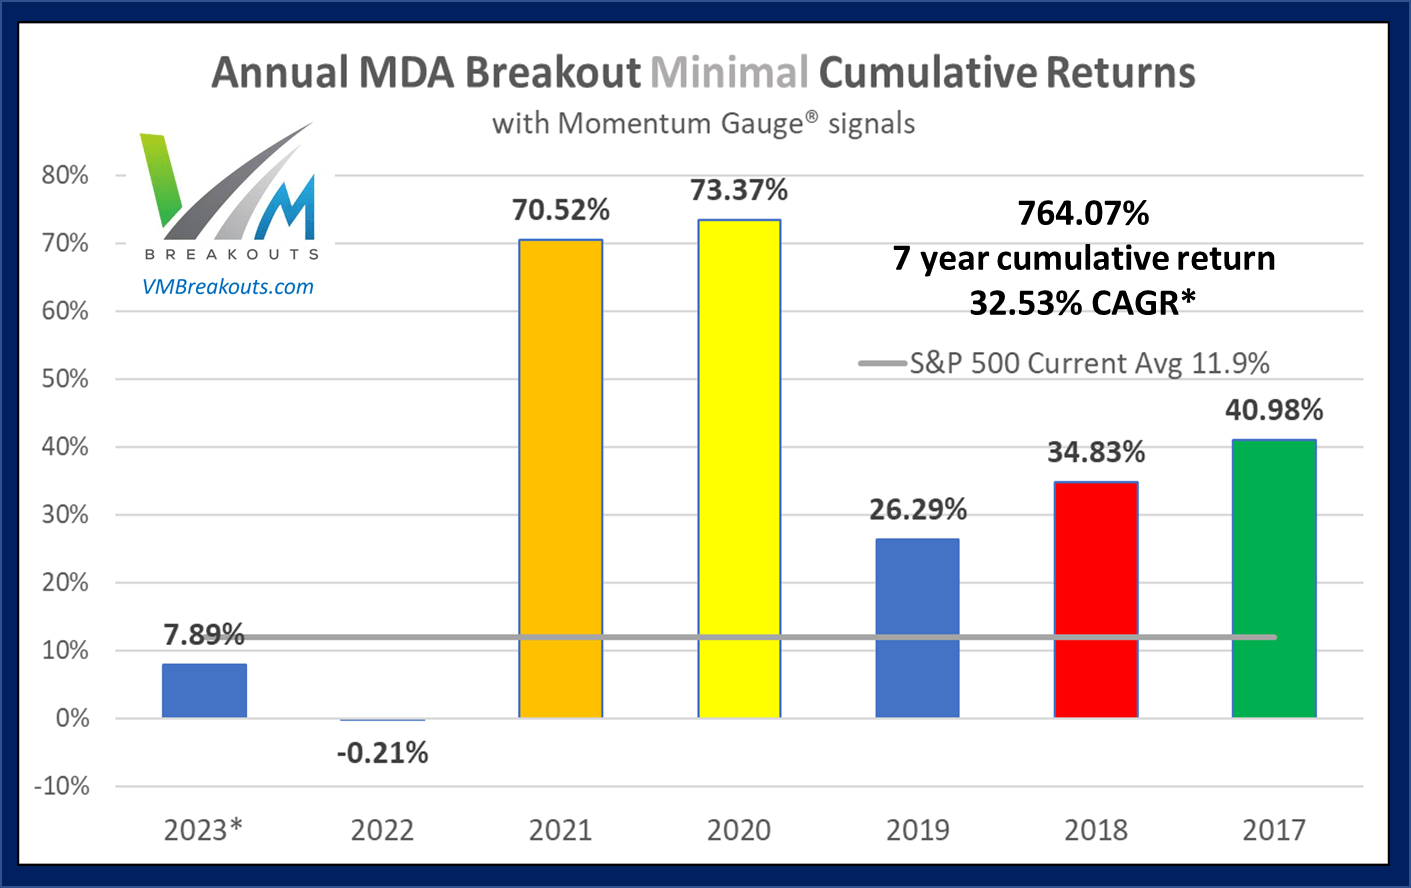
The Week 16 - 2023 Breakout Stocks for next week are:
The picks for next week consist of 1 Energy, 1 Basic Materials, 2 Healthcare sector stocks. These selections are released in advance to members every Friday with current gains shown. Prior selections may be doing well, but for research purposes I deliberately do not duplicate selections from the prior week. These selections are based on MDA characteristics from my research, including strong money flows, positive sentiment, and strong fundamentals -- readers are cautioned to follow the Momentum Gauges for the best results.
- Diamond Offshore Drilling (DO) - Energy / Oil & Gas Drilling
- Immunocore Holdings (IMCR) - Healthcare / Biotechnology
Diamond Offshore Drilling - Energy / Oil & Gas Drilling
FinViz.com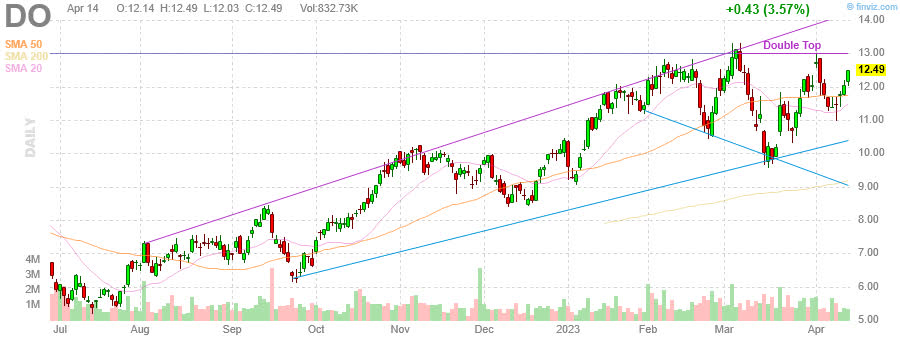
Price Target: $17.00/share (Analyst Consensus + Technical See my FAQ #20)
| Feb-27-23 09:00PM | Diamond Offshore Announces Fourth Quarter 2022 Results PR Newswire |
| Feb-07-23 04:15PM | DIAMOND OFFSHORE TO RELEASE FOURTH QUARTER 2022 RESULTS PR Newswire |
| Nov-07-22 08:14PM | Diamond Offshore Announces Third Quarter 2022 Results and $429 Million Project Award in Brazil PR Newswire |
(Source: Company Resources)
Diamond Offshore Drilling, Inc. provides contract drilling services to the energy industry worldwide. As of December 31, 2022, the company operated a fleet of 14 offshore drilling rigs, including four drillships, eight semisubmersible rigs, and two managed rigs.
StockRover.com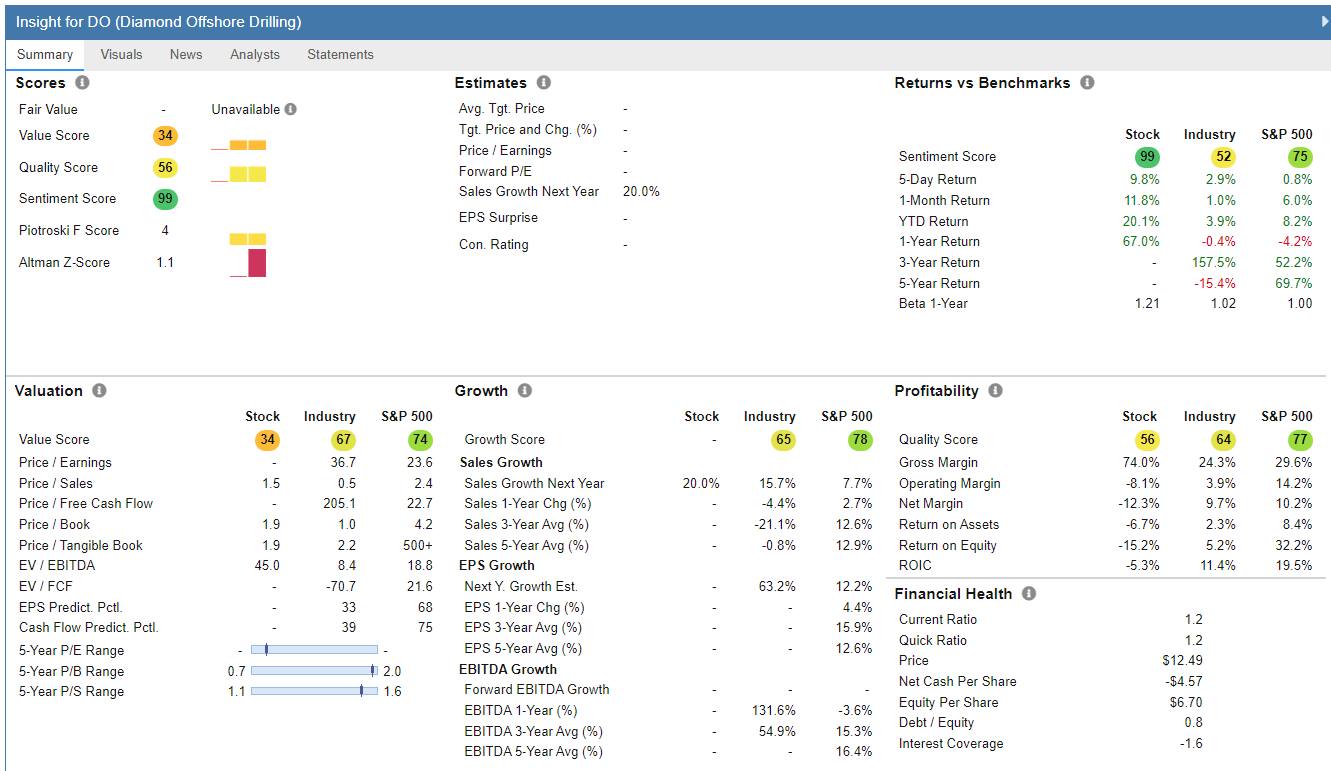
Immunocore Holdings - Healthcare / Biotechnology
FinViz.com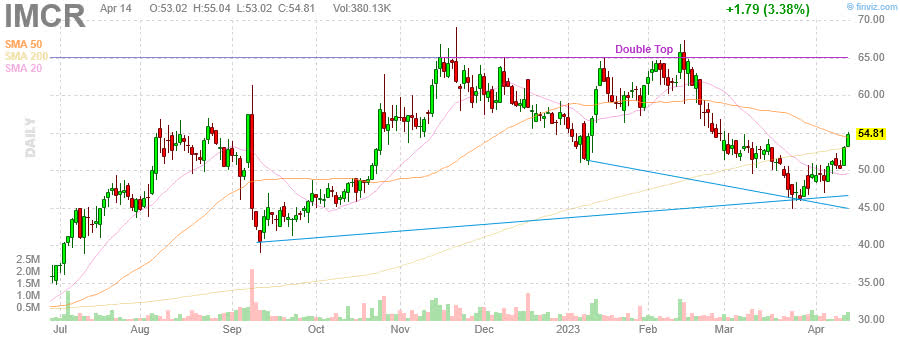
Price Target: $80.50/share (Analyst Consensus + Technical See my FAQ #20)
| Apr-11-23 07:00AM | Immunocore to present at the 22nd Annual Needham Virtual Healthcare Conference GlobeNewswire |
| Apr-05-23 06:00PM | Immunocore Holdings PLC Sponsored ADR [IMCR] Dips More Than Broader Markets: What You Should Know Zacks |
| Mar-30-23 06:00PM | Immunocore Holdings PLC Sponsored ADR [IMCR] Stock Sinks As Market Gains: What You Should Know Zacks |
| 09:00AM | Immunocore Holdings PLC Sponsored ADR [IMCR] is Attracting Investor Attention: Here is What You Should Know Zacks |
| Mar-28-23 03:57PM | Top 10 Growth Stocks in Biotech Insider Monkey |
| Mar-24-23 06:00PM | Immunocore Holdings PLC Sponsored ADR [IMCR] Stock Sinks As Market Gains: What You Should Know Zacks |
(Source: Company Resources)
Immunocore Holdings plc, a commercial-stage biotechnology company, engages in the development of immunotherapies for the treatment of cancer, infectious, and autoimmune diseases. The company offers KIMMTRAK for the treatment of patients with unresectable or metastatic uveal melanoma.
StockRover.com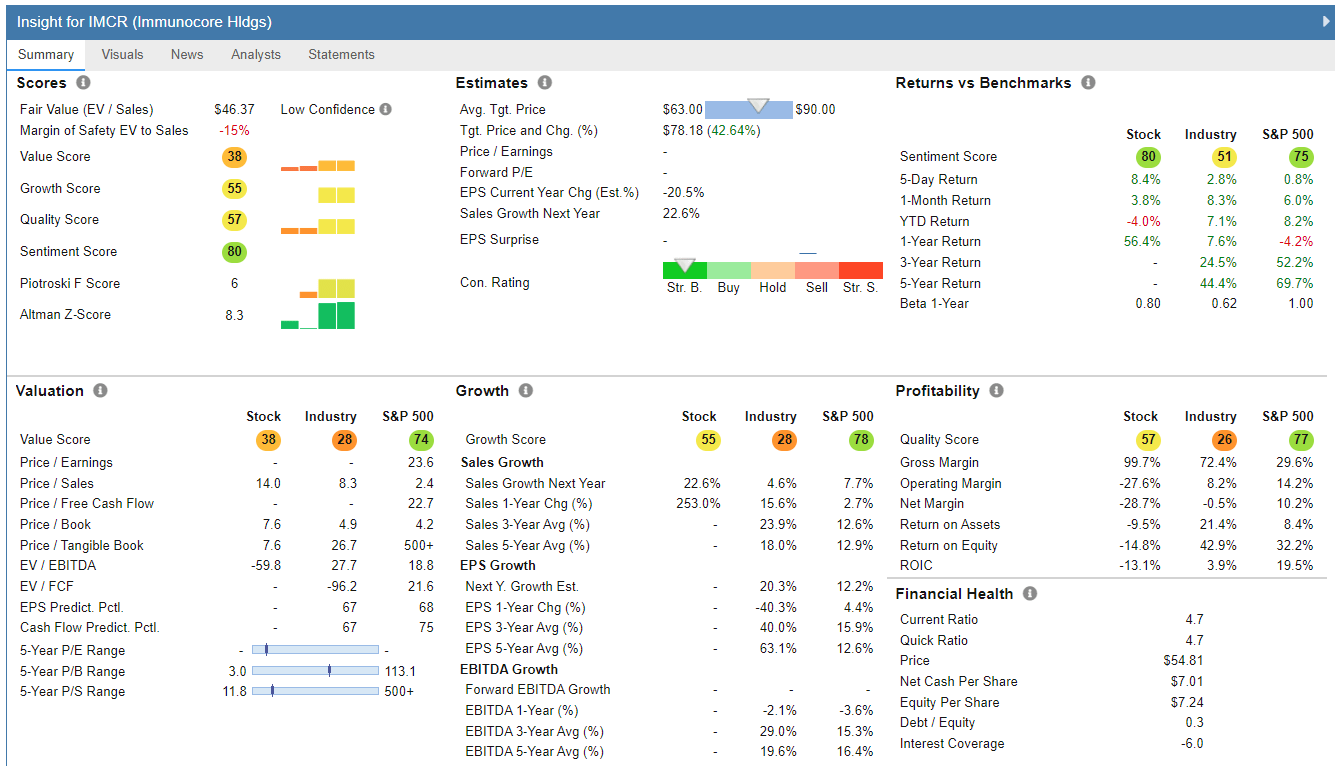
Top Dow 30 Stocks to Watch for Week 16
First, be sure to follow the Momentum Gauges® when applying the same MDA breakout model parameters to only 30 stocks on the Dow Index. Second, these selections are made without regard to market cap or the below-average volatility typical of mega-cap stocks that may produce good results relative to other Dow 30 stocks. The most recent picks of weekly Dow selections in pairs for the last 5 weeks:
| Symbol | Company | Current % Return from Selection |
| PG | Procter & Gamble Co. | -1.09% |
| (UNH) | UnitedHealth | -0.13% |
| WMT | Walmart Inc. | +0.58% |
| (BA) | The Boeing Company | -4.90% |
| (WMT) | Walmart Inc. | +4.59% |
| (PG) | Procter & Gamble Co. | +4.02% |
| (MSFT) | Microsoft Corp. | +1.64% |
| (INTC) | Intel Corporation | +6.44% |
| (MRK) | Merck & Co., Inc. | +6.64% |
| (MCD) | McDonald's Corp. | +8.86% |
If you are looking for a much broader selection of large cap breakout stocks, I recommend these long term portfolios with consecutive years of beating the S&P 500 and already achieving double-digit returns. As regular readers know, in March we moved to negative signals on the gauges and will be resuming a positive signal for April. The returns shown below are the 2023 YTD gains before the Negative signal on March 7th. Showing again how much timing matters.
VMBreakouts.com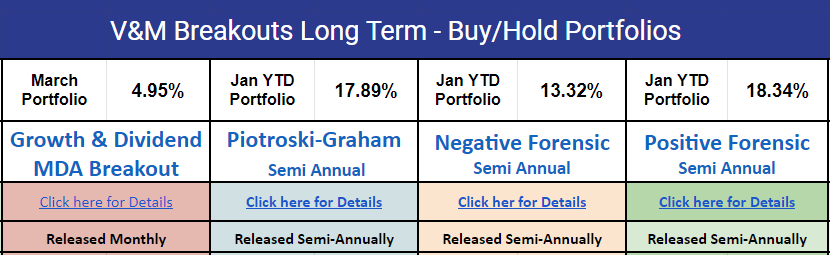
New 2023 Piotroski-Graham enhanced value -
- New January portfolio +17.89% YTD
- 2022 January portfolio beat the S&P 500 by +32.54%
- New January portfolio +18.34% YTD
- January 2022 Positive Forensic beat S&P 500 by +6.59%
- New January portfolio +13.32% YTD
- January 2022 Negative Forensic beat S&P 500 by +22.18%
New Growth & Dividend Mega cap breakouts -
- New April mega cap portfolio +3.28% YTD not including dividends
- January 2022 portfolio beat S&P 500 by +13.91%
These long term portfolio selections have significantly outperformed many major hedge funds and all the hedge fund averages since inception.
The Dow pick for next week is:
JPMorgan Chase & Co.
JPMorgan (JPM) had a significant Q1 earnings beat on Friday with very high net MFI inflows and analyst upgrades to as high as $155/share target. Valuations are very good 11.5x earnings and 0.29x cash flow and institutions have become large net buyers.
FinViz.com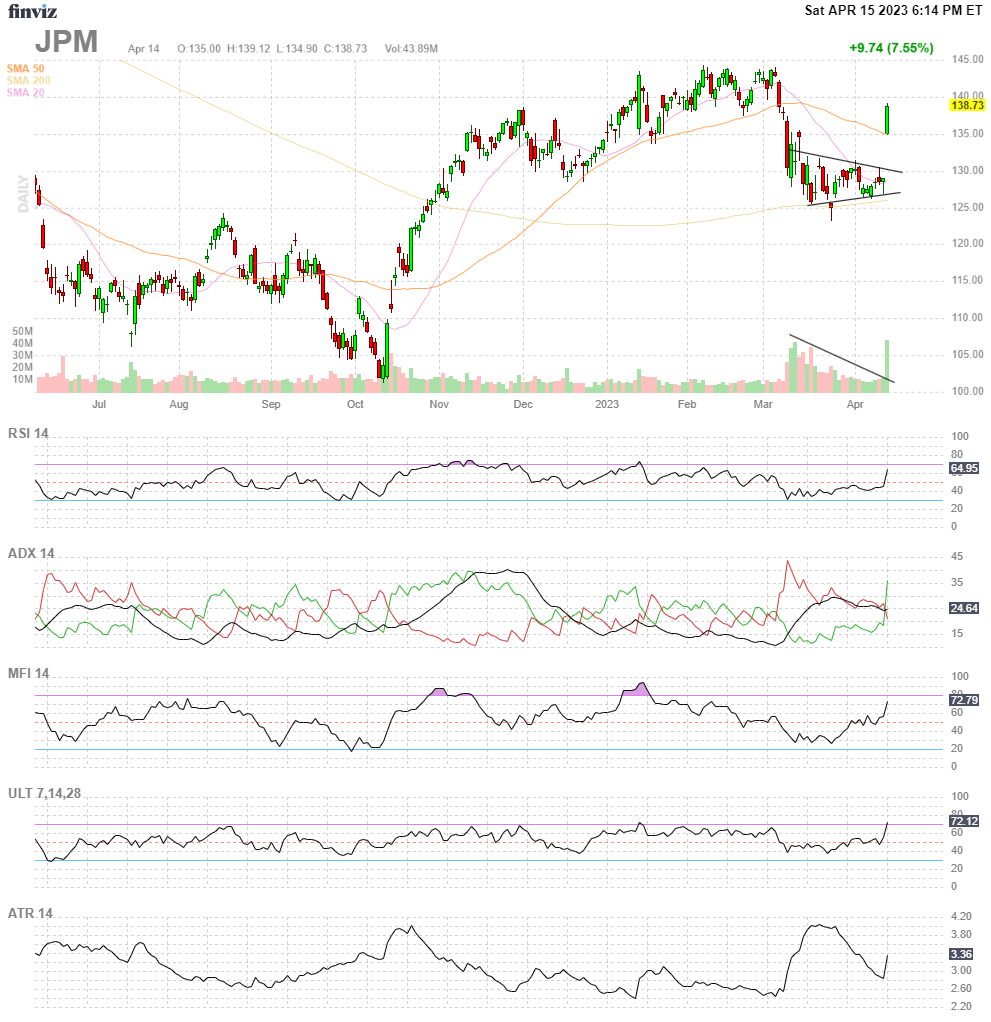
Breakout ETF Portfolios
The Momentum Gauge timing model changes between bull/bear funds following the signals at the start of the next day. Members can outperform these returns following early signals and trading on the day of the signals before the close. The Active ETF portfolio is up +15.17% YTD through tremendous chop last week especially from FANG mega caps / Tech sector.
VMBreakouts.com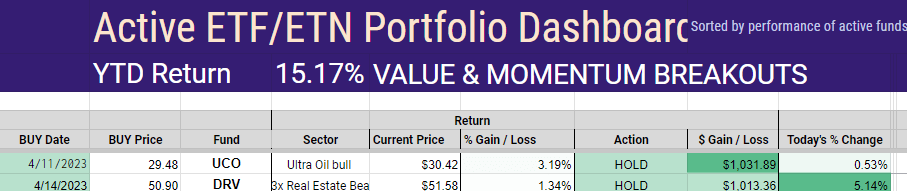
Year to date signal changes on the Bull/Bear Momentum Gauge ETF model are shown below. Be sure to read the Momentum Gauge guide for best results.
VMBreakouts.com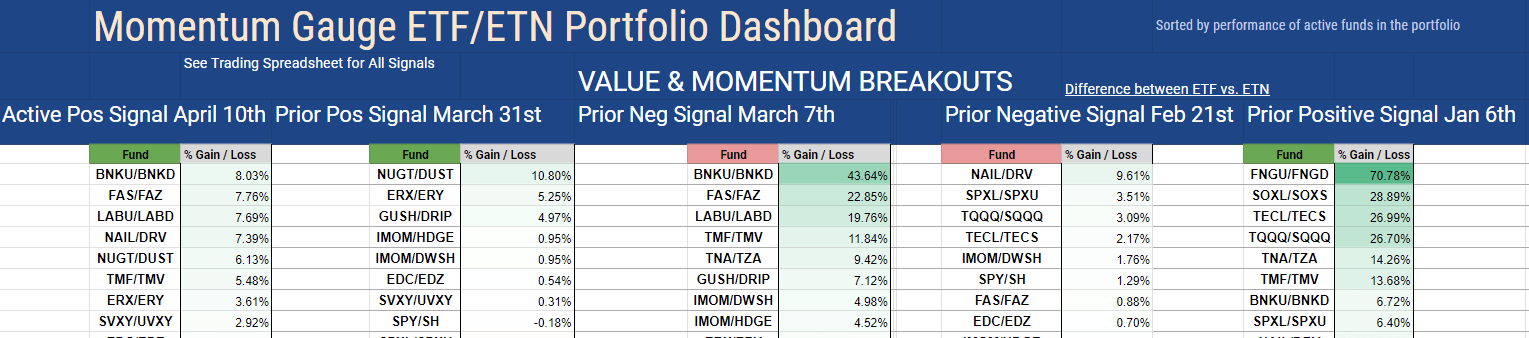
Returns shown here are for signals lasting longer than 3 days.
Background on Momentum Breakout Stocks
As I have documented before from my research over the years, these MDA breakout picks were designed as high frequency gainers.
These documented high frequency gains in less than a week continue into 2020 at rates more than four times higher than the average stock market returns against comparable stocks with a minimum $2/share and $100 million market cap. The enhanced gains from further MDA research in 2020 are both larger and more frequent than in previous years in every category. ~ The 2020 MDA Breakout Report Card
The frequency percentages remain very similar to returns documented here on Seeking Alpha since 2017 and at rates that greatly exceed the gains of market returns by 2x and as much as 5x in the case of 5% gains.
VMBreakouts.com
The 2021 and 2020 breakout percentages with 4 stocks selected each week.
VMBreakouts.com
MDA selections are restricted to stocks above $2/share, $100M market cap, and greater than 100k avg daily volume. Penny stocks well below these minimum levels have been shown to benefit greatly from the model but introduce much more risk and may be distorted by inflows from readers selecting the same micro-cap stocks.
Conclusion
These stocks continue the live forward-testing of the breakout selection algorithms from my doctoral research with continuous enhancements over prior years. These Weekly Breakout picks consist of the shortest duration picks of seven quantitative models I publish from top financial research that also include one-year buy/hold value stocks.
All the V&M portfolio models beat the market indices again last year with consistent outperformance of the major indices. All new portfolios are in a strong start to 2023 with many portfolios already in double-digit returns. Remember to follow the Momentum Gauges® in your investing decisions for the best results. YTD returns do not show the peak gains following the signals.
VMBreakouts.com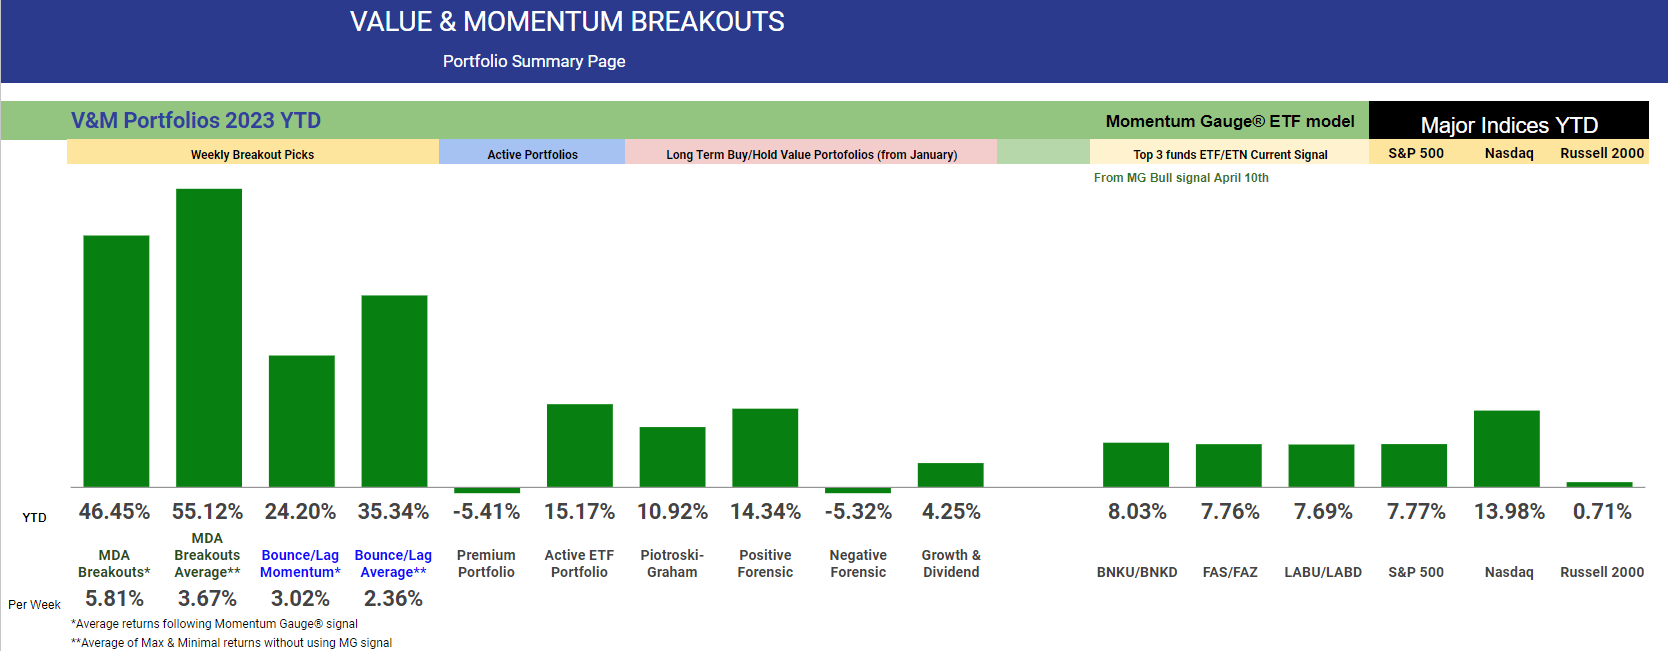
Portfolio returns for 2022
VMBreakouts.com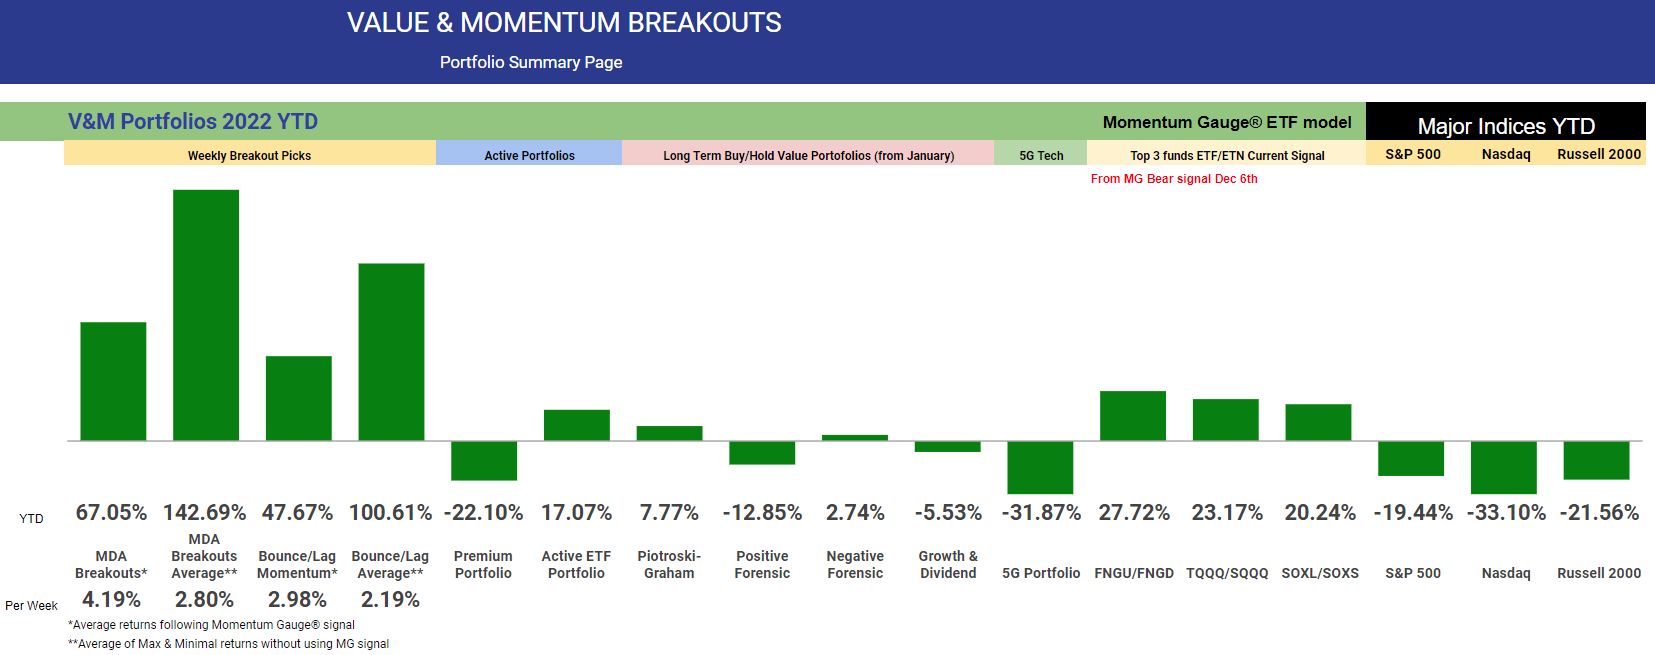
All the very best to you, stay safe and healthy and have a great week of trading!
JD Henning, PhD, MBA, CFE, CAMS
If you are looking for a great community to apply proven financial models with picks ranging from short term breakouts to long term value and forensic selections, please consider joining our 1,200+ outstanding members at Value & Momentum Breakouts
- Subscribe now and learn why members are hooked on the Momentum Gauge® signals!
- For the 6th consecutive year the V&M Portfolios beat the S&P 500!!
- The new Active ETF portfolio gained +17.1% beating S&P 500 by over 35%
- Now into our 7th year, we have outperformed the S&P 500 every single year!
See what members are saying now - Click HERE
This article was written by

Welcome! I am a Finance PhD, MBA, investment adviser, fraud examiner and certified anti-money laundering specialist with more than 30 years trading and investing stocks and other securities. I'm the founder of Value & Momentum Breakouts.
***
I'm JD Henning, the founder of Value & Momentum Breakouts. I've spent decades capturing many of the best ways to consistently beat the markets. I've earned degrees researching markets, and even more importantly, I've spent the time myself as a trader and investor. I am one of those unusual multi-millionaire, PhD's in finance, former Coast Guard officer with a bunch of certifications ranging from anti-money laundering specialist, investment adviser, to fraud examiner... who genuinely enjoys helping others do well in the markets. I'm bringing the fruits of my experience and research to this service. I am highly accessible to members to answer questions and give guidance.
***
It's been quite the start of the year for investors. My guess is, after a decade of good times in the market, you’re here looking for some guidance in how to navigate these volatile markets and the uncertainty of the coronavirus and inflationary conditions. You’re in the right place. For the past 7 years I’ve made my trading systems public and helped thousands of my subscribers navigate and profit from every market downturn and breakout. Please be sure to read the reviews of my service from actual members!
***
Value & Momentum Breakouts doesn't stop with the Momentum Gauges® and the Bull/Bear ETF strategy. The service is designed for investors who appreciate having easy access to quick picks from many top quantitative financial models across different types of investing strategies. Portfolios and selections cover all types of investments:
***
Commodity and Volatility fund trading
Cryptocurrency chart analysis
Long term high-dividend growth stocks
Short term high-frequency breakout stocks
Forensic analysis value stocks
Value enhanced long term growth picks
ETF sector and bull/bear combination trades
Dow mega cap breakout picks
Sector and Index Momentum Gauges® for market timing
***
I share my expertise by generating frequent Value & Momentum Breakout stock portfolios from the different financial algorithms across peer-reviewed financial literature.
***
Try a 2-Week FREE trial and see all the value for yourself.
Analyst’s Disclosure: I/we have no stock, option or similar derivative position in any of the companies mentioned, and no plans to initiate any such positions within the next 72 hours. I wrote this article myself, and it expresses my own opinions. I am not receiving compensation for it (other than from Seeking Alpha). I have no business relationship with any company whose stock is mentioned in this article.
I continue to follow the Market Momentum Gauge and Sector Momentum Gauge signals. I adjust my exposure ahead of weekends and holidays to minimize the risk from these high volatility 3x funds that may not be appropriate investments for your portfolio. Readers are highly encouraged to consider your own optimal asset allocation strategies to diversify risks and enhance returns. For the best results follow the live updates for members.
Seeking Alpha's Disclosure: Past performance is no guarantee of future results. No recommendation or advice is being given as to whether any investment is suitable for a particular investor. Any views or opinions expressed above may not reflect those of Seeking Alpha as a whole. Seeking Alpha is not a licensed securities dealer, broker or US investment adviser or investment bank. Our analysts are third party authors that include both professional investors and individual investors who may not be licensed or certified by any institute or regulatory body.