CEF Weekly Review: The Key Difference Between Accounting Income And Cash Flow

Summary
- We review CEF market valuation and performance through the first week of April and highlight recent market action.
- CEFs had a fairly flat week with higher-quality / longer-duration sectors outperforming due to the continued drop in longer-term Treasury yields.
- We take a look at the distinction between accounting income and cash flow for CEFs holding TIPS and zero-coupon Munis.
- And highlight a number of distribution changes in April.
- Systematic Income members get exclusive access to our real-world portfolio. See all our investments here »
Darren415
This article was first released to Systematic Income subscribers and free trials on Apr. 9.
Welcome to another installment of our CEF Market Weekly Review where we discuss closed-end fund ("CEF") market activity from both the bottom-up - highlighting individual fund news and events - as well as the top-down - providing an overview of the broader market. We also try to provide some historical context as well as the relevant themes that look to be driving markets or that investors ought to be mindful of.
This update covers the period through the first week of April. Be sure to check out our other weekly updates covering the business development company ("BDC") as well as the preferreds/baby bond markets for perspectives across the broader income space.
Market Action
The CEF sector was mostly flat with higher-quality / longer-duration sectors like Munis outperforming. Discounts moved wider nearly across the board.
Systematic Income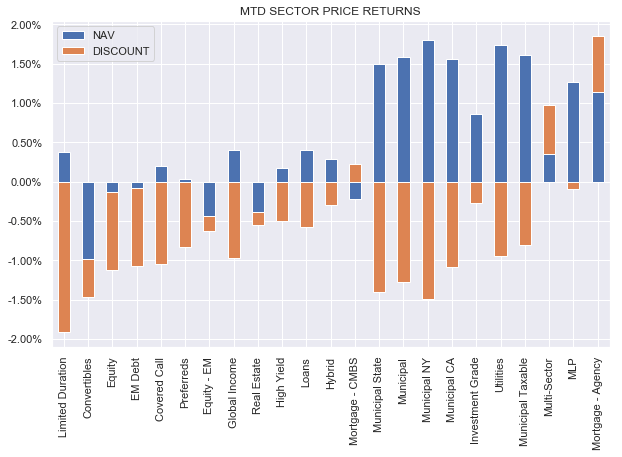
Year-to-date, things don't look too bad. Most sectors have seen an increase in NAVs. Only Preferreds and CMBS sectors are down for the year due to the related concerns around banks and the knock-on impact on commercial real estate due to a large lending presence there by regional banks.
Systematic Income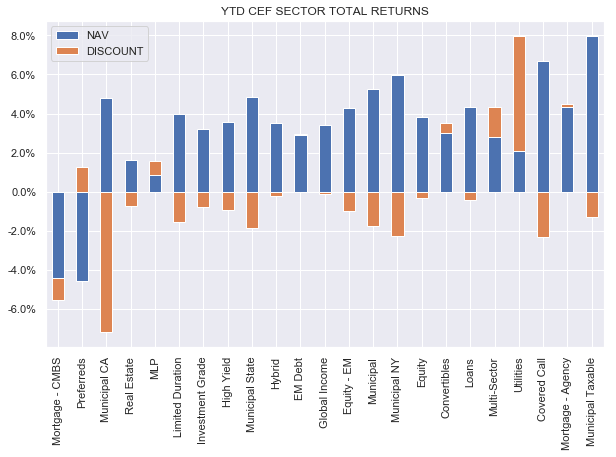
Fixed-income sector discounts remain attractive, within shouting distance of 10% for the median sector.
Systematic Income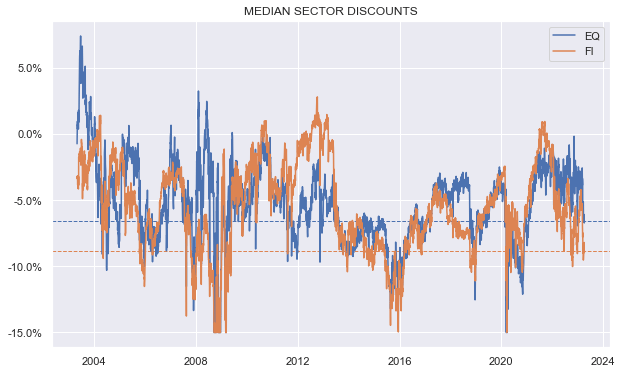
Market Themes
We had an exchange recently about the net income profile of TIPS CEFs like the Western Asset/Claymore Inflation-Linked Securities & Income Fund (WIA). A reader said that getting a 7% fully covered yield from a zero credit risk fund with inflation upside was a great deal. Our response was that with TIPS coupons sub-1% and real yields not far north of 1%, it wasn't mathematically possible for TIPS CEFs to generate actual net income of 7%.
To dig a bit deeper, this exchange highlights the difference between accounting income and actual income i.e. cash flow. The reason a fund like WIA can boast a high single-digit current yield and double-digit trailing twelve-month yield is because it can treat TIPS inflation adjustments as income in its accounting. This is shown in the extract below from the shareholder report.
Franklin Templeton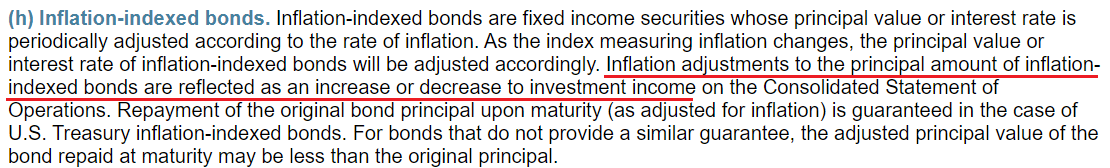
For investors unfamiliar with TIPS, these bonds tend to be issued at very low coupons, well below those of Treasuries (the difference being roughly what people expect inflation to be over its term). TIPS principal is then adjusted by the change in inflation which is called the inflation adjustment. This inflation adjustment is treated as income in accounting terms but is only paid out at maturity.
WIA had net investment income of $25.6m for the reporting year ending Nov-22. However, as we see below this was about the same as the net inflation adjustment of -$26.8 but with a different sign. This roughly means that all of the fund's net investment income was due to the inflation adjustment.
Franklin Templeton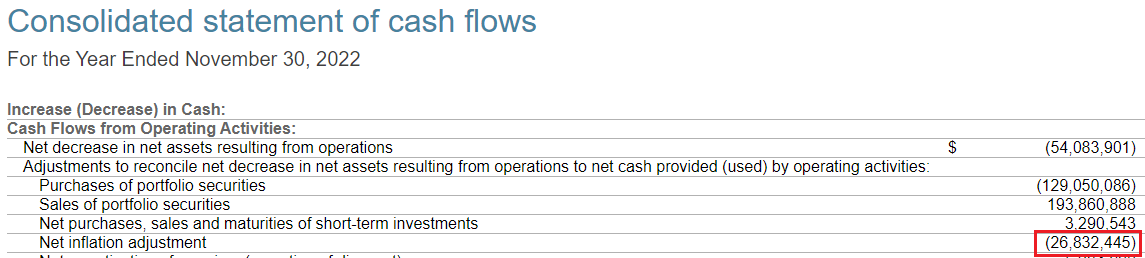
The chart below shows net inflation adjustment figures through the years. Recently this figure increased substantially due to the rise in inflation.
Systematic Income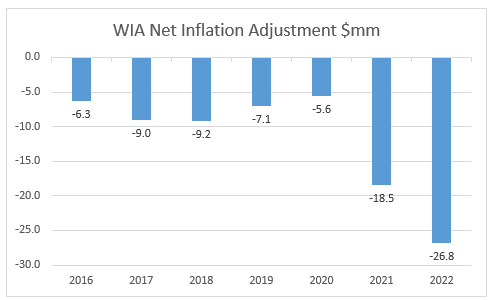
This is not dissimilar to what we see in equity CEFs which have very low or even negative level of cash flow income but are able to pay out high single-digit yields by monetizing capital gains (both real and expected) as distributions. The key difference is that in equity CEFs we can clearly see the overdistribution but a fund like WIA can boast high coverage despite not actually receiving anywhere near the same amount in "cold hard cash".
Another way where there is a difference between accounting income and actual income is in zero-coupon bonds which are often held by Municipal CEs. As the extract below from a Nuveen CEF shows, zero coupon bonds generate accounting net income but not actual cash flow until the principal repayment.
Nuveen
One consequence of this gap between accounting income of TIPS and zero-coupon bonds and actual income is that the funds may have to sell assets to generate the cash required to pay the distributions. This is not as bad as it sounds because it doesn't actually impair the overall portfolio yield of the fund. This is because of the compounding element of both TIPS and zero coupon bonds which would cause accounting income to accelerate if some of the assets are not sold to finance the distributions. In short, this is something that investors should be aware of but it's not something that should be critical to their allocation choices.
Market Commentary
To highlight a number of CEF April distribution changes, Invesco cut their Muni funds nearly across the board. All the funds looked to have distribution rates above the sector average so not a massive surprise there.
MFS made cuts across their bond funds as well. About half of their funds have managed distribution policies linked to the previous months' NAV so the funds cut the distribution simply as a result of the NAV drop. As a sidenote because these funds overdistribute (e.g. MMT, MCR), the tendency will be for the distributions to move lower because of the drag on the NAV from overdistributions (i.e. since the "uncovered" portion of the distributions have to be paid out of the NAV).
In the Eaton Vance suite, EVV - a mixed bond/loan fund with a higher-quality tilt and with an outsized and poorly covered distribution cut by 20% which is not nearly enough. EVG, which has a similar flavor, cut a bunch as well. The two EV loan CEFs hiked a bit.
Nuveen distributions were mixed. A few of the unleveraged funds (NUW, NIM) hiked once again. This is something that was highlighted earlier in the year but basically the unleveraged bond CEFs don’t have the two key net income drags of leveraged bond CEFs - rising leverage costs and deleveraging. The net income of these funds has actually been rising slightly. This is not something that would happen automatically as the funds hold fixed-coupon bonds. It’s possible the funds have been rotating into higher-yielding bonds in their allocation.
Systematic Income CEF Tool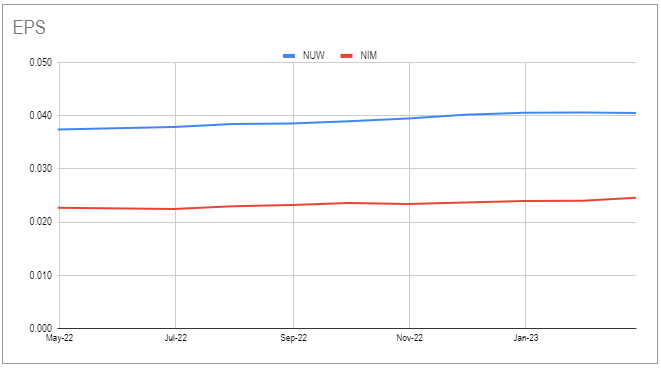
As some investors know, the Nuveen Muni fund NZF is merging with two state funds: NUO and NKG. The key consequence is that there will be a shift in the allocation for NZF. It's unusual to merge a state CEF with a national CEF because of the obvious difference in focus. NUO and NKG will tilt NZF towards Ohio and Georgia bonds so perhaps over time NZF will rebalance away from these states for a more national allocation. The two smaller funds are also higher-quality with a very low HY / unrated footprint. This will tilt NZF towards higher quality bonds. Overall, the impact won't be massive. NZF has $3.7bn of assets while the two smaller funds have $600m of combined assets.
Stance And Takeaways
This week we took advantage of the volatility in CEFs to make a number of relative value rotations among similar funds.
Specifically, we rotated from the predominantly high-yield corporate bond CEF CS High Yield Bond Fund (DHY) to its sister fund CSAM Income Fund (CIK). As the chart below shows, even though CIK is trading at a 1% tighter discount, it can generate an underlying portfolio yield that is 0.6% above that of DHY due to its significantly lower management fee. In our view, the fair-value discount differential of the two funds is around 8% (i.e. CIK trading at a discount 8% tighter than DHY e.g. CIK at 2% discount vs. DHY at a 10% discount).
Systematic Income CEF Tool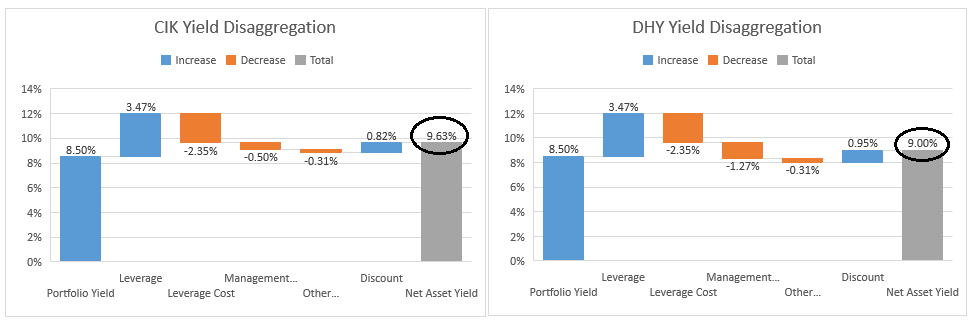
In the Preferreds sector we also rotated to the Cohen & Steers Limited Duration Preferred and Income Fund (LDP) from its sister fund Tax-Advantaged Preferred Securities and Income Fund (PTA). LDP tends to trade at a tighter discount than PTA due to its lower management fee. The fair-value discount differential between the two funds is around 3% (i.e. LDP trading at a discount 3% tighter than PTA e.g. LDP at a 4% discount and PTA at a 7% discount). At this discount they can generate the same yield on price, all else equal.
Systematic Income CEF Tool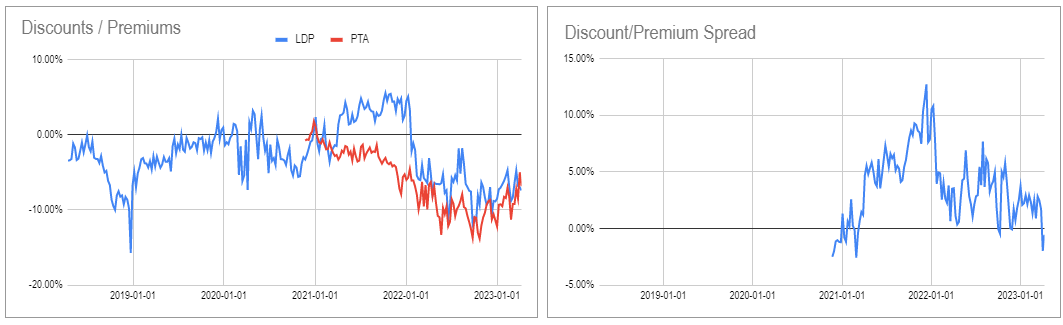
Check out Systematic Income and explore our Income Portfolios, engineered with both yield and risk management considerations.
Use our powerful Interactive Investor Tools to navigate the BDC, CEF, OEF, preferred and baby bond markets.
Read our Investor Guides: to CEFs, Preferreds and PIMCO CEFs.
Check us out on a no-risk basis - sign up for a 2-week free trial!

This article was written by

At Systematic Income our aim is to build robust Income Portfolios with mid-to-high single digit yields and provide investors with unique Interactive Tools to cut through the wealth of different investment options across BDCs, CEFs, ETFs, mutual funds, preferred stocks and more. Join us on our Marketplace service Systematic Income.
Our background is in research and trading at several bulge-bracket global investment banks along with technical savvy which helps to round out our service.
Analyst’s Disclosure: I/we have a beneficial long position in the shares of NZF, CIK, LDP, PTA either through stock ownership, options, or other derivatives. I wrote this article myself, and it expresses my own opinions. I am not receiving compensation for it (other than from Seeking Alpha). I have no business relationship with any company whose stock is mentioned in this article.
Seeking Alpha's Disclosure: Past performance is no guarantee of future results. No recommendation or advice is being given as to whether any investment is suitable for a particular investor. Any views or opinions expressed above may not reflect those of Seeking Alpha as a whole. Seeking Alpha is not a licensed securities dealer, broker or US investment adviser or investment bank. Our analysts are third party authors that include both professional investors and individual investors who may not be licensed or certified by any institute or regulatory body.