XMHQ: Solid-Quality Mix Nicely Positioned For An Abating Inflation Scenario

Summary
- XMHQ is a passively managed fund focusing on high-quality mid-size U.S. stocks selected from the S&P 400 index.
- In light of the recent CPI data that support the view that the economy is past the inflation zenith, I believe exposure to top-quality mid-cap stocks should be considered.
- XMHQ demonstrated an ability to navigate different market narratives of the previous years, and I reckon its factor mix is robust enough to deliver gains going forward.

mizoula
Invesco S&P MidCap Quality ETF (NYSEARCA:XMHQ), as described on its website, is a passively managed fund focusing on high-quality medium-sized U.S. stocks selected from the S&P 400 index.
In my opinion, XMHQ is an excellent ETF from a quality standpoint, but mid-cap investors who are pondering an option to boost their quality exposure using this fund should understand that XMHQ's holdings trade with the profitability (quality) premia, thus it is not as cheaply valued as most medium-sized equities, which subsequently poses certain risks in a still relatively possible scenario with interest rates continuing trending higher.
Nevertheless, assuming inflation in the U.S. is gradually cooling down as illustrated by the March CPI report published recently, I believe reducing exposure to value stocks slightly and expanding footprint in more generously priced names makes sense, especially when higher multiples are secured by robust quality, which is the case with this ETF as I will illustrate below.
In this regard, I reckon XMHQ is a Buy at these levels, with a due remark that investors should understand the risks associated with recession-sensitive sectors like industrials and consumer discretionary the fund is overweight.
XMHQ: a brief discussion of its underlying index
As described on the fund's website, its strategy is based on the S&P MidCap 400 Quality Index. It is of note that before a profound strategy change in June 2019, the ETF traded with the ticker EQWM, tracking the Russell Midcap Equal Weight Index, and was named Invesco Russell Midcap Equal Weight ETF. And since its strategy was completely different, it would be reasonable to ignore its performance prior to the index change. Also, more details on what indices the fund tracked in the past can be found in the fact sheet on its website.
The index methodology is similar to the one that lies at the crux of Invesco S&P 500 Quality ETF's (SPHQ) underlying index, a fund which I covered in August 2022, with the essential difference being the selection universe, the S&P 500 vs. S&P 400. According to the fact sheet on the S&P Global website, the quality score ingredients used are the accruals ratio, Return on Equity, and financial leverage. The goal is to select 80 names using a composite based on this trio. Constituents are score-weighted, with rebalances and reconstitutions following a biannual schedule. I recommend reading the methodology available on the S&P Global website for more details on the process.
Bullish voices
Excellent profitability characteristics secured by minimalist but potent quality screening
As of April 11, XMHQ had a portfolio of 79 equities, with about 23.8% of its net assets allocated to the top-ten cohort. In terms of sectors, the fund's mix does bear a few resemblances to the one of the SPDR S&P MidCap 400 ETF (MDY) as it favors industrials and consumer discretionary names, precisely like its larger and less picky counterpart. Here, it is worth remarking that in a full-scale recession scenario, funds that are overweight cyclical sectors and underweight defensive players (e.g., XMHQ has an about 53 bps allocation to consumer staples and no exposure to utilities, at all) would be exposed to a risk of a more rapid decline than those that are immune (or almost immune) to the economic doldrums.
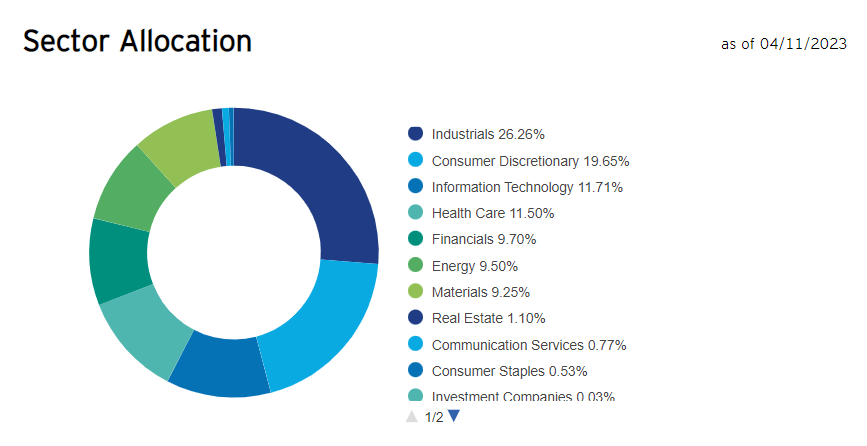
Invesco; Screenshot taken April 13, Eastern Time
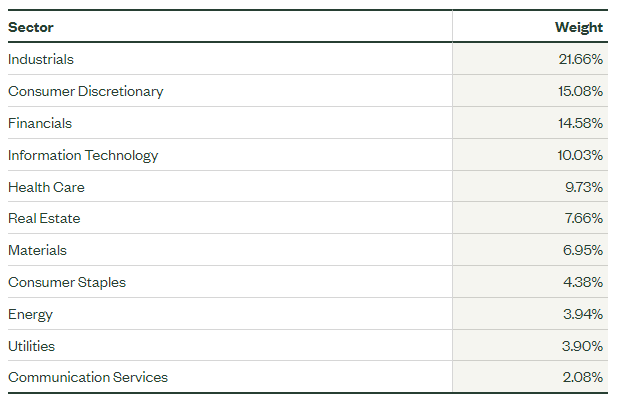
ssga.com; Screenshot taken April 13, Eastern Time
Anyway, I believe the most important fact about this mix is that its quality characteristics are close to excellent, thanks to the simple but potent methodology of its underlying index.
- As of April 12, XMHQ had more that 96% of its net assets allocated to stocks with a B- Quant Profitability grade and higher. This is a phenomenal level for a mid-cap fund with a weighted-average market cap of $7.47 billion, as per my calculations. For better context, if we look at MDY, only about 73.7% of its holdings sport a B- grade and higher.
- Next, only one company in the XMHQ portfolio failed to deliver positive last twelve months net earnings, namely Under Armour (UAA), which finished its LTM (including the FQ3 2023 ended in December 2022) with a net loss of $304.5 million. Please note that the net income data I used in my quality analysis also include contributions from discontinued operations, like in the case of Light & Wonder (LNW). With discontinued operations stripped off, LNW's LTM net income was negative; I recommend reading its Form 10-K for additional clarification.
- Speaking of cash flows, only 4.4% of the holdings, including UAA, have negative net CFFO. I dislike cash-burning companies, but XMHQ's exposure to them is fairly small.
- Finally, the fund has a remarkable weighted-average Return on Assets, 15%, as per my calculations. Return on Equity is also fairly strong at 35.4%; however, since about 21% of the holdings have Debt/Equity above 100%, this figure is likely distorted due to the high debt/low shareholder equity effect. An essential remark here is that as close to 82% have a Total debt/EBITDA ratio below 3x, again, as per my analysis, I believe the balance sheet risk is comparatively low.
XMHQ beat IVV, MDY during the July 2019 - March 2023 period
XMHQ's outstanding performance since the index change speaks for itself. During the July 2019 - March 2023 period, the fund delivered a compound annual growth rate that exceeded the one of the market represented by the iShares Core S&P 500 ETF (IVV) by about 1%, with the standard deviation being only modestly higher. Besides, it also easily beat MDY, which tracks the S&P 400, delivering a ~3.8% higher CAGR. As a quick refresher, the period was notable first for the trade war narrative, then for the pandemic, replaced by the positioning for the post-pandemic recovery (the capital rotation) in 2021 amid the vaccine enthusiasm, and finally the omnipresent inflation and central banks' decisive moves necessary to suppress rampant price growth.
| Portfolio | XMHQ | IVV | MDY | EZM | SPHQ |
| Initial Balance | $10,000 | $10,000 | $10,000 | $10,000 | $10,000 |
| Final Balance | $15,399 | $14,868 | $13,544 | $13,204 | $15,130 |
| CAGR | 12.20% | 11.16% | 8.43% | 7.69% | 11.68% |
| Stdev | 21.19% | 19.37% | 22.95% | 26.03% | 18.45% |
| Best Year | 26.25% | 28.76% | 24.21% | 30.99% | 27.58% |
| Worst Year | -12.42% | -18.16% | -13.28% | -12.24% | -15.77% |
| Max. Drawdown | -22.81% | -23.93% | -29.63% | -36.80% | -24.33% |
| Sharpe Ratio | 0.59 | 0.58 | 0.42 | 0.37 | 0.63 |
| Sortino Ratio | 0.96 | 0.89 | 0.61 | 0.52 | 0.98 |
| Market Correlation | 0.94 | 1 | 0.94 | 0.91 | 0.97 |
Created by the author using data from Portfolio Visualizer
By all means, it is also of note that the funds I selected for comparison including the WisdomTree U.S. MidCap Earnings ETF (EZM) and SPHQ also delivered bleaker results despite their focus on high-quality names (e.g., as described by WisdomTree, EZM favors mid-caps with "positive cumulative earnings over their most recent four fiscal quarters prior to the index measurement date.")
Bearish voices
There are risks related to comparatively expensive valuation
I believe the following valuation considerations should not be ignored:
- Over 61% of the net assets are allocated to companies with a D+ Quant Valuation rating and worse; the share of such names in MDY is below 51%.
- Nevertheless, XMHQ has a ~26% allocation to relatively appealingly valued stocks (B- and better), while MDY has about 23.5%.
- Upon closer inspection, if analyzed using the weighted-average EV/EBITDA ratio (with the financial sector excluded and its weight re-distributed equally among remaining holdings), XMHQ still looks fairly expensive as the ratio is at ~22.8x. Interestingly, this figure is heavily influenced by UAA, Axon Enterprise (AXON), and Azenta (AZTA), which have triple-digit ratios, while the median that ignores stock weights is only 10.3x.
XMHQ is unappealing for dividend investors
Unfortunately, XMHQ is hardly appealing for dividend investors since it has a low weighted-average dividend yield of only 1.1%, partly because ~35.5% of its holdings do not return cash to shareholders via dividends, while the median DY for those that have a DPS is just 1.4%.
Investor takeaway
In light of the most recent CPI data that support the view that the economy is past the inflation zenith, I believe exposure to top-quality mid-cap stocks should be considered. XMHQ demonstrated an ability to navigate different market narratives of the previous years, and I believe its factor mix is robust enough to deliver gains going forward.
This article was written by

Analyst’s Disclosure: I/we have no stock, option or similar derivative position in any of the companies mentioned, and no plans to initiate any such positions within the next 72 hours. I wrote this article myself, and it expresses my own opinions. I am not receiving compensation for it (other than from Seeking Alpha). I have no business relationship with any company whose stock is mentioned in this article.
Seeking Alpha's Disclosure: Past performance is no guarantee of future results. No recommendation or advice is being given as to whether any investment is suitable for a particular investor. Any views or opinions expressed above may not reflect those of Seeking Alpha as a whole. Seeking Alpha is not a licensed securities dealer, broker or US investment adviser or investment bank. Our analysts are third party authors that include both professional investors and individual investors who may not be licensed or certified by any institute or regulatory body.