Dividend Cuts A-Plenty

Summary
- Almost $1.5 trillion of U.S. commercial real estate debt comes due for repayment before the end of 2025.
- Most REITs are in good shape in terms of their balance sheets, but we are beginning to see more cracks in the foundation.
- Today, we will examine three REITs that are in jeopardy of a dividend cut.
- Looking for more investing ideas like this one? Get them exclusively at iREIT on Alpha. Learn More »
Eleganza
I just finished lunch at the famous Beacon Restaurant in Spartanburg, SC, legendary for the Cheeseburger-a-Plenty. When I first moved to this city (out of college), I would dine at this Southern landmark weekly to enjoy the chili-cheeseburger buried underneath piles of sweet onion rings and french-fried potatoes.
You have to witness this for yourself to understand the concept of an “A-Plenty.”
Besides the Beacon, there are other greasy “a-plenty” dishes that I’m going to be discussing today…
Dividend Cuts A-Plenty.
According to Bloomberg, “almost $1.5 trillion of US commercial real estate debt comes due for repayment before the end of 2025.” And it’s not just the fact that the loans are coming due in so much as many banks aren’t lending.
It’s a double-whammy in that rates are now two times higher and many property sectors – such as office and retail – are drastically underwater.
Things are unsettling, and I’m beginning to see more and more distress as property valuations for some property sectors could fall by as much as 50% from peak to trough. There’s no more cheap money in commercial real estate, and I believe that the next 12 months are going to present significant opportunities for investors with cash.
We already seeing cracks in the foundation in the real estate investment trust ("REIT") sector, as several REITs have recently cut their dividend:
Gladstone Commercial (GOOD) decreases monthly dividend by -20.3% to $0.10/share.
SL Green (SLG) cuts dividend by 13% to $0.2708
Broadmark Realty (BRMK) cut the dividend to $0.035 per share for November 2022 from $0.07 in October.
Fortunately, we were ready for these cuts, as we had previously informed members at iREIT on Alpha to buckle up in advance.
Today, consider this another harbinger, as we believe these three REITs referenced below are likely to cut their dividend which could result in a Cheeseburger-a-Plenty-style stomachache.
Easterly Government Properties, Inc. (DEA)
Easterly Government Properties is a real estate investment trust that specializes in the acquisition and development of Class A commercial properties that are leased to U.S. Government agencies.
They primarily invest in office properties, which makes up 62% of their portfolio when based on square feet. In addition to office properties DEA invests in VA Outpatient centers, Labs, and Courthouses. VA Outpatient makes up 20% of their portfolio, Labs makes up 6%, Courthouses makes up 4%, and the remaining 8% is described as “other” which includes warehouse and distribution centers.
As of December 31, 2022, DEA wholly owned 78 properties and had an ownership interest in 8 properties through a joint venture. In total, their properties encompass roughly 8.7 million leased square feet and are 98.8% leased. 85 of their properties are primarily leased to U.S. government tenant agencies, while one property is leased to a private tenant. DEA’s properties serve mission-critical functions due to the nature of the properties they own and the fact that the U.S government and its agencies are essentially DEA’s only tenant.
DEA - Investor Presentation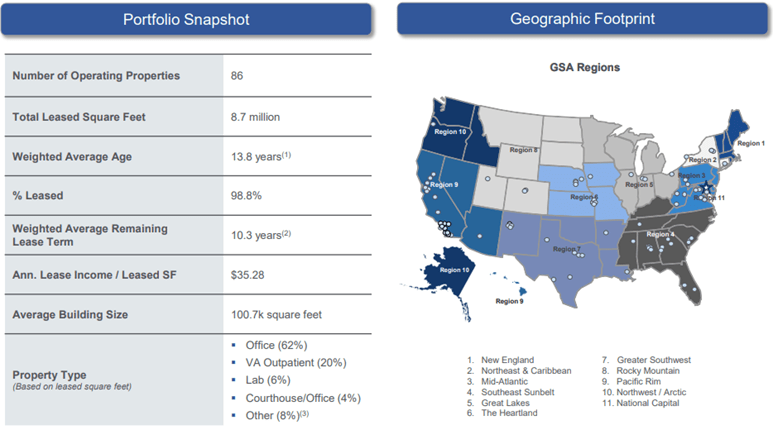
DEA’s adjusted net debt to pro forma EBITDA of 7.1x is a little on the high side, but their other debt metrics are fairly strong. They have a cash interest coverage ratio of 3.6x, a net debt to total enterprise value of 45.9%, and a long-term debt to capital ratio of 49.73%.
Their debt is 93.5% fixed rate with a weighted average interest rate of 3.7% and a weighted average maturity of 5.6 years. DEA has no debt maturing in 2023 and approximately $160 million maturing in 2024. As of December 31, 2022, they had roughly $17.3 million in cash and cash equivalents and approximately $384.4 million available to them under their revolving credit facility.
DEA - Investor Presentation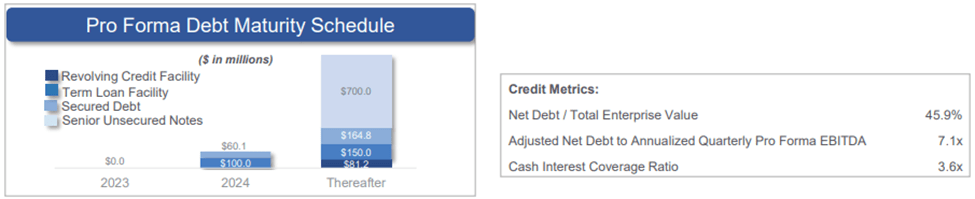
From 2016 to year end 2022, DEA has averaged a funds from operations (“FFO”) growth rate of 2.90%. FFO fell by 7% in 2018, but increased 3% in 2019, 5% in 2020 and 4% in 2021, however FFO declined by -3% in 2022. Analysts expect FFO to fall by -10% in 2023, -1% in 2024 and then increase by 3% in 2025.
FAST Graphs (compiled by iREIT)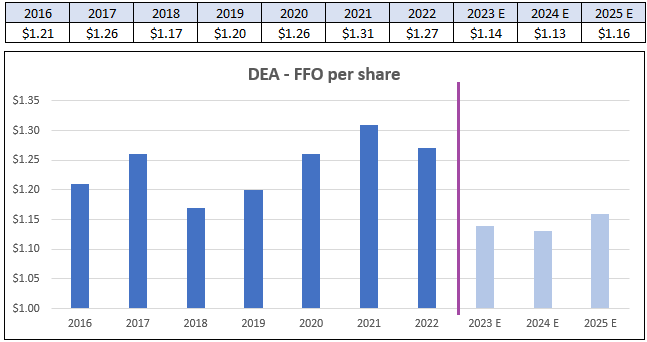
Since 2016, DEA has an average dividend growth rate of 12.14% but that is in large part due to the 70.37% increase in 2016. The dividend was raised again in 2017 to $1.00 and 2018 to $1.04 per share, but then remained unchanged until 2021, when they increased it by a penny.
In 2022, they increased the dividend by another penny. When looking at the average dividend growth rate from 2017 to 2022, it comes in at 2.43%, which I think is a more realistic expectation going forward.
FAST Graphs (compiled by iREIT)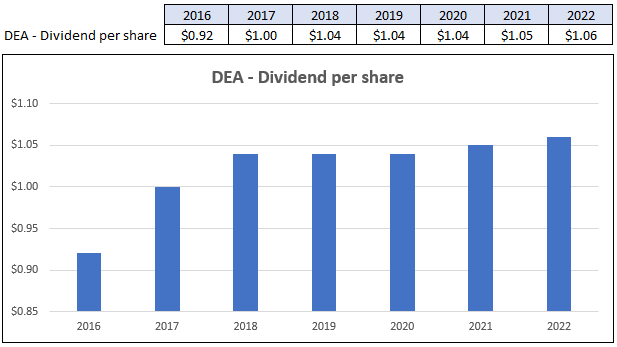
DEA’s AFFO payout ratio in recent years has exceeded 100%, but that improved to 91.30% in 2021 and then to 84.13% in 2022. The payout ratio where it now stands is reasonable, my concern is that analysts expect AFFO to fall to $1.04 in 2023, or an -18% decline, which would put the payout ratio back over 100%, assuming the dividend rate remains the same. DEA guided for core FFO to range between $1.12 to $1.15 in 2023 so it’s likely the analysts’ projections for AFFO will be fairly close.
FAST Graphs (compiled by iREIT)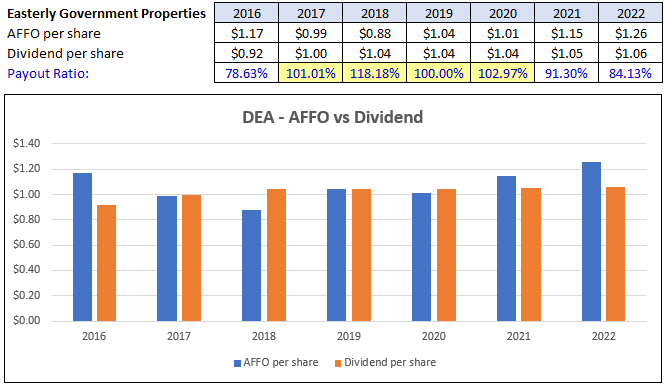
DEA is currently trading at a P/FFO multiple of 11.34x which is well under their normal P/FFO multiple of 16.48x. They pay a 7.58% dividend yield that is currently covered by their AFFO and have modestly increased the dividend over the years.
The payout ratio is something to keep an eye on, though, and we will be watching it closely to see if it goes back over 100%, as that may lead to a future dividend cut. At iREIT, we rate Easterly Government Properties a Sell.
FAST Graphs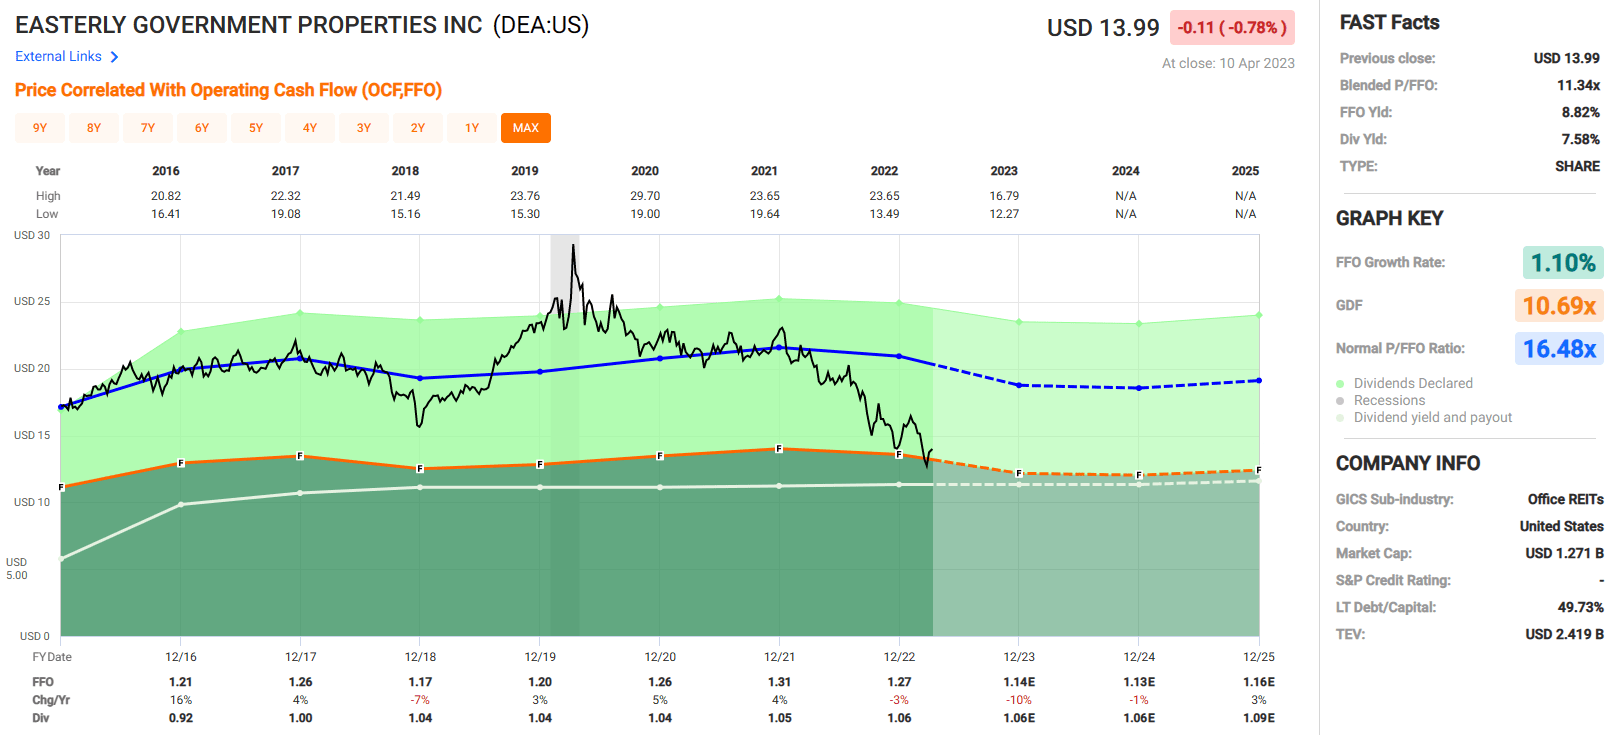
Granite Point Mortgage Trust Inc. (GPMT)
Granite Point Mortgage Trust is an internally-managed mortgage REIT (“mREIT”) that specializes in originating, managing, and investing in senior floating-rate commercial mortgage loans and other debt instruments that are secured by institutional quality commercial properties.
Their portfolio consists of $3.6 billion in total commitments spread across 90 loan investments that are over 98% floating rate. Additionally, the portfolio is comprised of over 99% senior first mortgage loans with a weighted average yield of 8.4% and a weighted average stabilized loan-to-value (“LTV”) of 62.9%. Their loans normally range from $20 to $150 million, with the average size of $35 to $40 million.
GPMT - Investor Presentation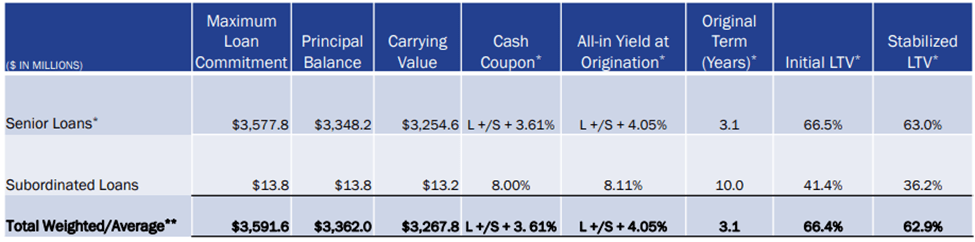
The properties securing their loans are located across the U.S., with their largest concentration in Texas (13.5%), California (10.9%), and New York (10.5%). By property type, they invest in office, multifamily, hotel / hospitality, retail, and industrial.
Their largest property type is office, representing 41.3% of their portfolio. After office, their largest property type is multifamily, which makes up 30.9% of their loan portfolio.
GPMT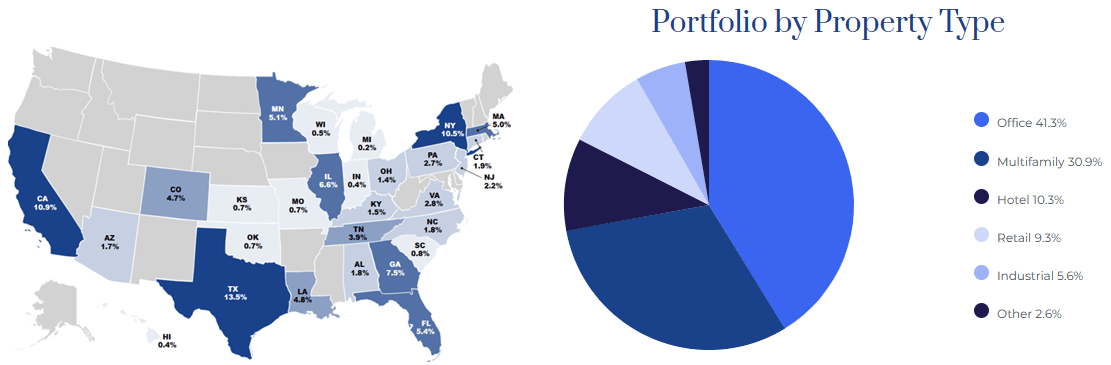
GPMT’s total assets have decreased from $3.98 billion in 2021 to $3.45 billion in 2022. The primary cause of the decline is due to their net loans held for investment, which fell from $3.7 billion in 2021 to $3.3 billion in 2022.
One thing to keep an eye on is their allowance for credit losses which more than doubled in 2022 compared to 2021. In 2021, the allowance for credit losses was 1.08% of their gross loans held for investment, whereas it increased to 2.46% in 2022.
GPMT - Form 10-K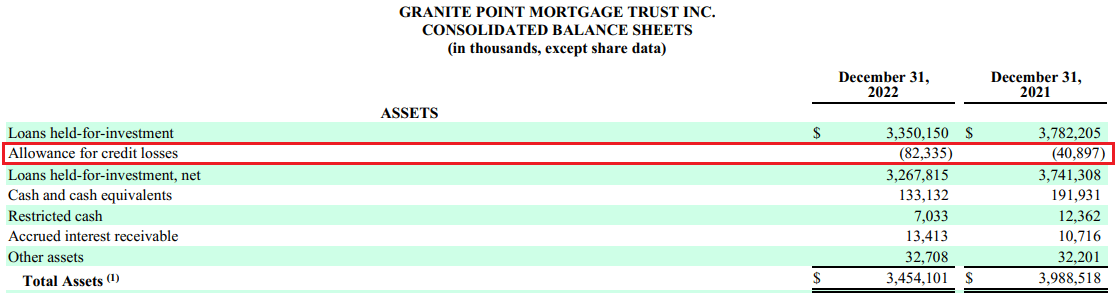
GPMT’s distributable earnings (“DE”) have been in decline since 2019, with a decrease of -8% in 2019, -16% in 2020, -15% in 2021, and -72% in 2022. Analysts expect earnings to increase 129% and 25% in the years 2023 and 2024, respectively, but then fall by -31% in 2025.
GPMT’s dividend payout ratio is concerning as it has been over 100% since 2018 with the exception of 2020. The low payout ratio in 2020 is the result of a significant dividend cut in that same year.
The dividend was cut from $1.68 in 2019 to $0.65 in 2020. The payout ratio spiked to 339.29% in 2022 with distributable earnings falling from $0.99 to $0.28 while the dividend was only cut by $0.05. The 2022 distributable earnings of $0.28 are inclusive of realized losses of -$27.3 million, or -0.48 per share.
GPMT - Earnings Release (compiled by iREIT)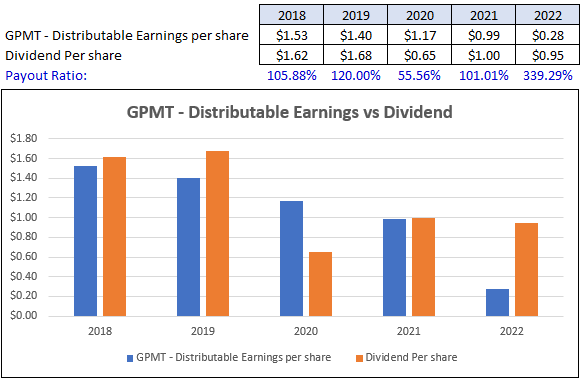
Currently Granite Point Mortgage Trust is trading at a blended P/E ratio of 12.52x, which is below their normal P/E ratio of 13.97x. They pay a dividend yield of almost 19%, but before jumping at the high yield, just realize that GPMT has cut the dividend multiple times over the last several years and their earnings have been in decline since 2018.
With the incredibly high dividend payout ratio 339.29% unless earnings improve significantly, there is a real possibility of another dividend cut. I would avoid this mortgage REIT for the time being. At iREIT we assign GPMT a Tier 3 rating (Sell).
FAST Graphs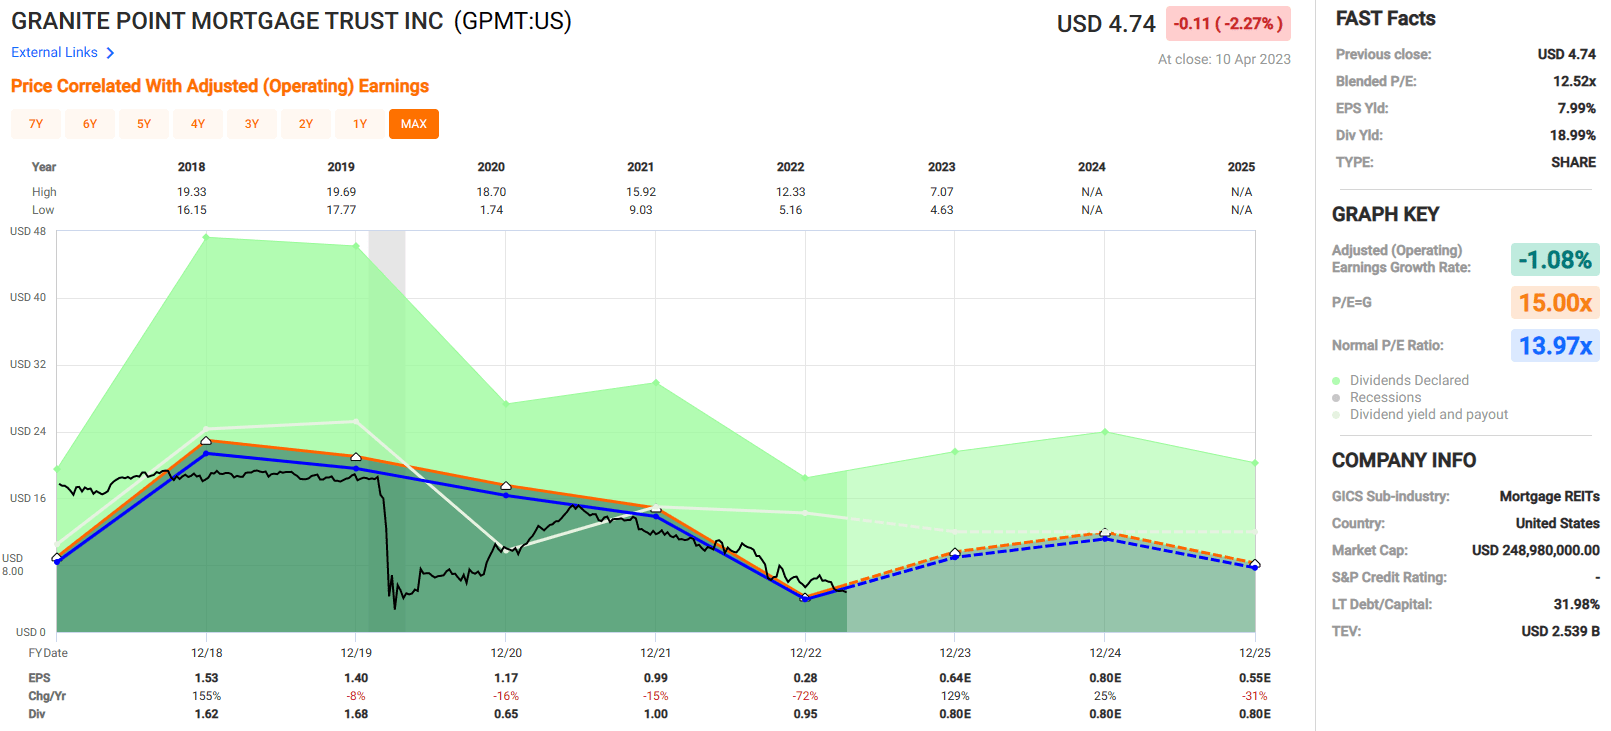
City Office REIT, Inc. (CIO)
City Office REIT is an office REIT that focuses on acquiring and owning office properties located primarily in the Sun Belt markets. CIO’s portfolio currently consists of 60 office buildings covering approximately 6.0 million square feet of net rentable area (“NRA”) and are located in Dallas, Orlando, Denver, Phoenix, Portland, Raleigh, Tampa, Seattle and San Diego.
City Office REIT targets office properties in markets that have positive economic growth, growing populations, increasing rental rates and office occupancy trends, and properties that are in close proximity to universities and government offices. Their largest market is Phoenix, AZ when measured by NRA square feet.
CIO has 23 buildings in Phoenix covering 1.5 million square feet of NRA, with an in-place occupancy of 75.5% and an average remaining lease term of 4.8 years. For all properties combined, CIO has an average gross rent of $31.59 per square foot, an average in-place occupancy of 86.2%, and an average remaining lease term of 4.9 years.
CIO - Investor Presentation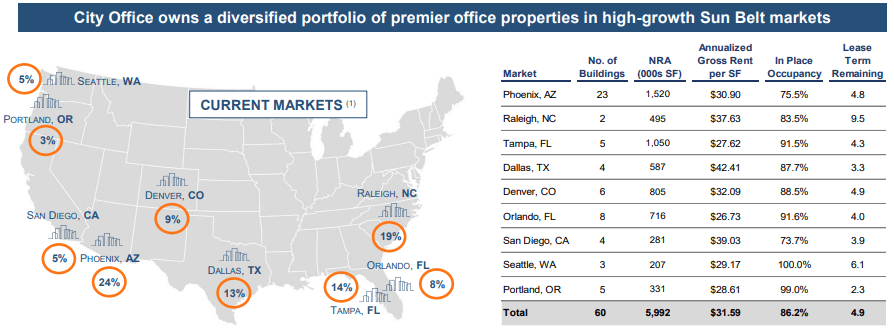
City Office REIT has a diversified tenant base, with their top ten tenants making up only 23.2% of their net rentable area. No tenant makes up more than 3.5% of their NRA, and the majority of their tenants make up less than 2% of their NRA. CIO is also diversified by industry, which includes professional and technical services, finance and insurance, health care and life sciences, technology, real estate, and government.
CIO - Investor Presentation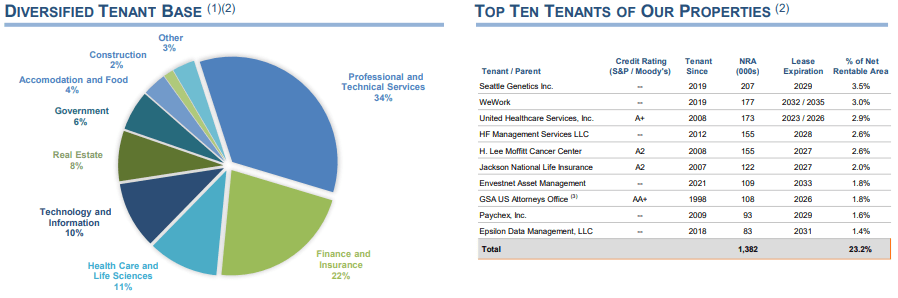
Leasing activity has been mixed picture. New leasing volume has increased each year since 2019, while renewal leasing increased from 2019 to 2020, but has decreased over the past two years.
Similarly, total leasing volume has fallen since 2020. It’s important to note, however, that both their new lease and total leasing volume exceeds their pre-pandemic levels in 2019. CIO’s renewal leasing volume is still under the levels seen in 2019.
CIO - Supplemental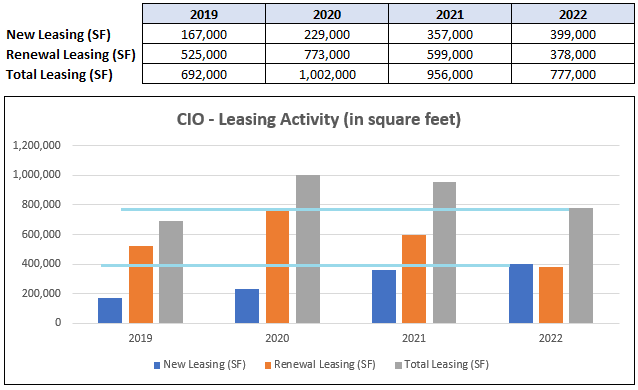
City Office REIT has reasonable debt metrics, with a net debt to adjusted EBITDA of 6.4x, an adjusted interest coverage ratio of 3.4x, a fixed charge coverage ratio of 2.3x, and a long-term debt to capital ratio of 43.74%.
Over 90% of their debt is fixed rate, with a weighted average interest rate of 4.4% and a weighted average debt maturity of 3.2 years. CIO has a well-staggered debt maturity schedule with minimal maturities in 2023. As of December 31, 2022, CIO had $28.0 million of cash and cash equivalents and over $100 million of undrawn availability on their revolving credit facility.
CIO - Investor Presentation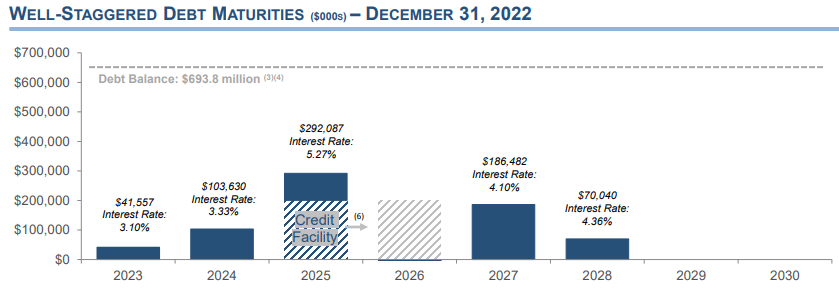
Since 2015, CIO has an average FFO growth rate of 3.79%. FFO fell sharply in 2016, but has increased each year since. Analysts expect FFO to fall by -11% in 2023, -1% in 2024, and -3% in 2025.
FAST Graphs (compiled by iREIT)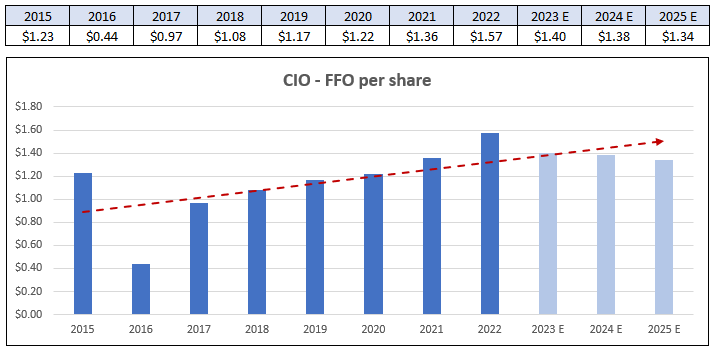
While CIO has delivered modest growth in their FFO, the same cannot be said for their dividend. From 2015 to 2019, the dividend remained flat at $0.94. In 2020, it was cut significantly to $0.69, and then cut again to $0.60 in 2021. However, in 2022 CIO increased the dividend by 33.33%, to $0.80 per share.
FAST Graphs (compiled by iREIT)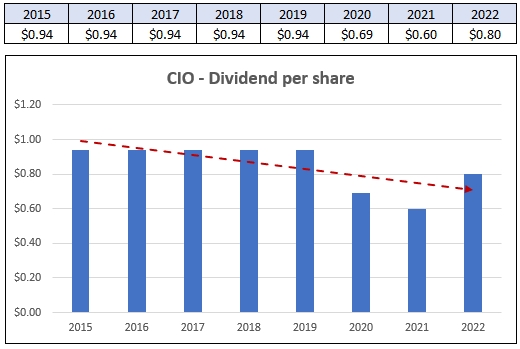
City Office REIT’s dividend payout ratio is concerning. Since 2015 their adjusted funds from operations only covered the dividend in two years (2015 & 2021). The majority of the time their dividend payout ratio is over 100% and came in at 119.40% in 2022. If analysts’ projections are correct and CIO’s FFO falls over the next few years, it will only put more pressure on the payout ratio and could potentially lead to a dividend cut.
FAST Graphs (compiled by iREIT)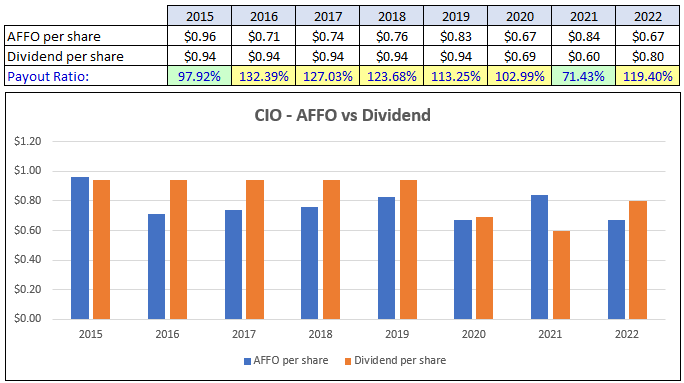
City Office REIT is trading at a P/FFO multiple of 4.23x, which is a significant discount to their normal P/FFO multiple of 11.61x. Over the last year, CIO’s stock has fallen by almost 60%, which has pushed the FFO yield up to 23.63% and the dividend yield up to 12.42%. The payout ratio is concerning and something to keep an eye on, but at the multiple CIO is currently trading at, we rate it a SELL.
FAST Graphs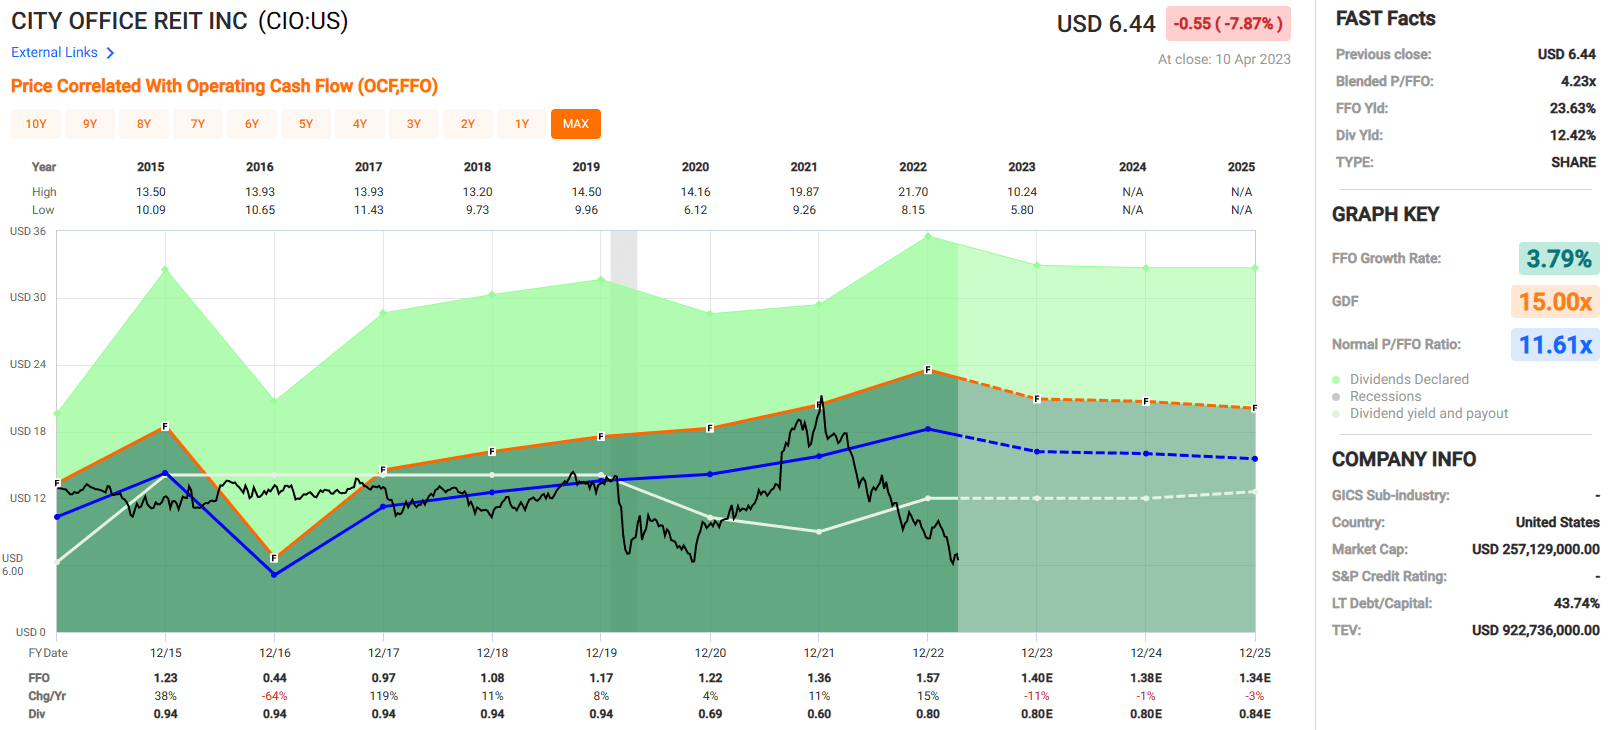
In Closing…
If anyone gets over to Spartanburg, SC to visit the Beacon, please let me know as I would be happy to meet you there in person. I need at least a few hours’ notice, and of course make sure that you prepare because the Cheeseburger-a-Plenty plate is a meal made for a king!
As always, thank you for reading and Happy SWAN investing!
Subscribe to Get the Sweet 16 REIT Report
When you subscribe to iREIT on Alpha you will get a free copy of our Sweet 16 REIT report in addition to access to all of our tools and resources.
Also, every new member will get a free copy of my new book, REITs For Dummies (summer 2023). Take the 2-week FREE trial and I can assure you that you will enjoy being part of the iREIT family.

This article was written by

Brad Thomas is the CEO of Wide Moat Research ("WMR"), a subscription-based publisher of financial information, serving over 100,000 investors around the world. WMR has a team of experienced multi-disciplined analysts covering all dividend categories, including REITs, MLPs, BDCs, and traditional C-Corps.
The WMR brands include: (1) iREIT on Alpha (Seeking Alpha), and (2) The Dividend Kings (Seeking Alpha), and (3) Wide Moat Research. He is also the editor of The Forbes Real Estate Investor.
Thomas has also been featured in Barron's, Forbes Magazine, Kiplinger’s, US News & World Report, Money, NPR, Institutional Investor, GlobeStreet, CNN, Newsmax, and Fox.
He is the #1 contributing analyst on Seeking Alpha in 2014, 2015, 2016, 2017, 2018, 2019, 2020, 2021, and 2022 (based on page views) and has over 108,000 followers (on Seeking Alpha). Thomas is also the author of The Intelligent REIT Investor Guide (Wiley) and is writing a new book, REITs For Dummies.
Thomas received a Bachelor of Science degree in Business/Economics from Presbyterian College and he is married with 5 wonderful kids. He has over 30 years of real estate investing experience and is one of the most prolific writers on Seeking Alpha. To learn more about Brad visit HERE.Analyst’s Disclosure: I/we have no stock, option or similar derivative position in any of the companies mentioned, and no plans to initiate any such positions within the next 72 hours. I wrote this article myself, and it expresses my own opinions. I am not receiving compensation for it (other than from Seeking Alpha). I have no business relationship with any company whose stock is mentioned in this article.
Author's note: Brad Thomas is a Wall Street writer, which means he's not always right with his predictions or recommendations. Since that also applies to his grammar, please excuse any typos you may find. Also, this article is free: Written and distributed only to assist in research while providing a forum for second-level thinking.
Seeking Alpha's Disclosure: Past performance is no guarantee of future results. No recommendation or advice is being given as to whether any investment is suitable for a particular investor. Any views or opinions expressed above may not reflect those of Seeking Alpha as a whole. Seeking Alpha is not a licensed securities dealer, broker or US investment adviser or investment bank. Our analysts are third party authors that include both professional investors and individual investors who may not be licensed or certified by any institute or regulatory body.