Are We Wrong To Be Bearish?

Summary
- Bears have watched as the market has risen in the first quarter even as the real economy has taken a turn for the worse.
- The consumer has remained resilient, but cracks are beginning to form, leaving questions about how much longer this can continue.
- I will explore how extraordinary monetary policy has altered the reaction function of the Fed and market dynamics.
duoogle/iStock via Getty Images
Are We Wrong to Be Bearish?
During the first quarter of this year, investors watched the S&P 500 index rise 7.04%, the Nasdaq followed with a more impressive 20.52% gain, this leaves bears to collectively wonder, are we wrong to be bearish?
It seems, no matter how bad the economic or market data gets, the markets continue to be dependent on Fed action to create a rescue plan and move us from dangerous waters to ever calmer seas. In my last piece, I explored JPMorgan Chase & Co, CEO Jamie Dimon's annual letter in which he described the inversion in the yield curve and why it might be different this time in its ability to predict a recession.
Bloomberg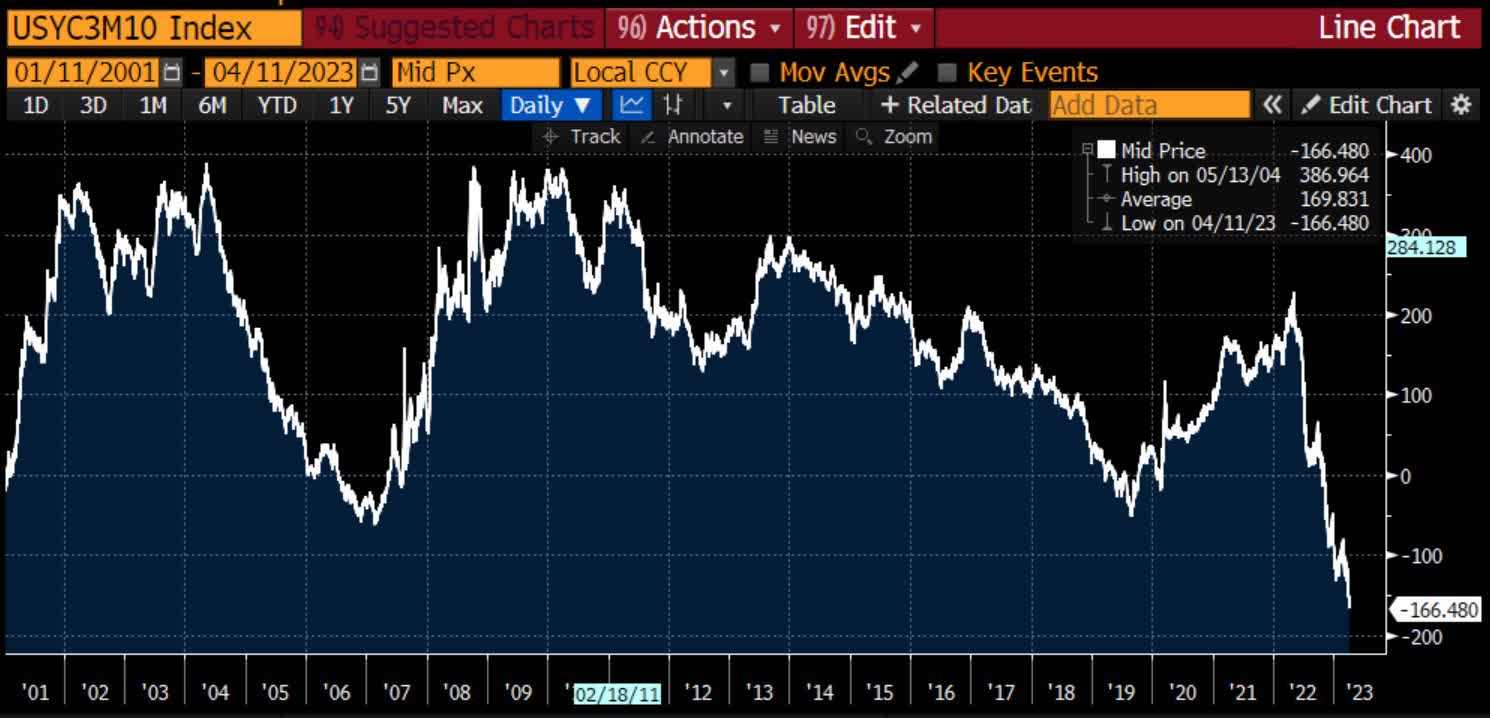
Today’s inverted yield curve implies that we are going into a recession. As someone once said, an inverted yield curve like this is “eight for eight” in predicting a recession in the next 12 months. However, it may not be true this time because of the enormous effect of QT. As previously stated, longer-term rates are not necessarily controlled by central banks, and it is possible that the inversion we see today is still driven by prior QE and not the dramatic change in supply and demand that is going to take place in the future."
This brings about a bigger question that takes us back to the 2008 financial crisis and the Federal Reserve's response to it. The crisis was so deep and severe that the Federal Reserve decided to engage in extraordinary monetary policies the likes of which we have never seen before. Quantitative easing, operation twist, zero lower bound interest rates, all emergency actions the Fed used to stimulate the economy after the most severe downturn since the great depression. But in doing this, Mr. Dimon's comments bring about a larger question as to whether the Fed will be able to take their foot off the pedal and return the economy to some form of normalcy, when Fed meetings are not the anxiety producing event, they have been for markets in the recent past.
I think it is right for market participants to wonder whether we will ever see a truly severe crash in risk assets again. After all, having a Federal Reserve, Treasury, and other governmental entities willing and able to ameliorate the effects of a downturn means the fundamental structure of the market has been changed. Rather than allowing capital to be allocated efficiently, and letting the market decide winners and losers, now the government will decide, as we seemingly privatize gains and socialize losses. This is not a political discussion, but one of market structure and dynamics.
The reaction function of the Fed will always be to rescue the market. We saw this in 2020 when the Fed came in and was actually buying certain bond ETF's to bring further stability to the market. Despite a widespread panic, a shutdown of the real economy, and a raging pandemic, equities posted returns of +47.57% for the Nasdaq (QQQ), and +16.19% for the S&P 500 (VOO).
Even today, when we have experienced the second and third largest bank failures in US history, interest rates have moved nearly 500Bps off the zero lower bound, and inflation continues to be a concern that could indicate even higher rates are ahead, and yet, the Nasdaq (QQQ) has posted returns from 2021-YTD of +1.70%, and +9.24% for the S&P 500 Index (VOO).
I echo the uncertainty shrouding Mr. Dimon's comments, the traditional measures we look at to predict recessions, may not work anymore. The Feds move into unchartered territory in terms of monetary policy and their very reaction function, means that the long-awaited recession may or may not be around the corner. Only time will tell if investors are right or wrong to be bearish but the evidence sure does seem to support a bearish stance.
Making the Bullish Case
Tom Lee and the folks at Fundstrat certainly think the bears are wrong, putting out a note explaining why the markets will see further gains in April. Recently they shared a chart showing that two consecutive quarters of gains marks the beginning of a new bull market that is just climbing a wall of worry. If they are correct, then bears are certainly misreading the data.
...two consecutive quarters of gains validate the start of a new bull market. This only solidifies our view that 10/12/22 was the bear market low and we are 6 months into a bull market... seasonals favor April gains...investor positioning points to gains in April. CFTC data shows speculators are still short 202k contracts, pinning the bearish positioning in place since October 2022. Notably, some bears are beginning to exit the “trap” — Michael Burry @michaeljburry yesterday tweeted “I was wrong to say sell” (which he did in January 2023).
Bottom line: It is the bears who are trapped and could fuel further gains in April
The bear narrative has another problem. As shown below, in each of the 3 major precedent bear markets since 1980, the end was validated by two consecutive quarterly gains."
Fundstrat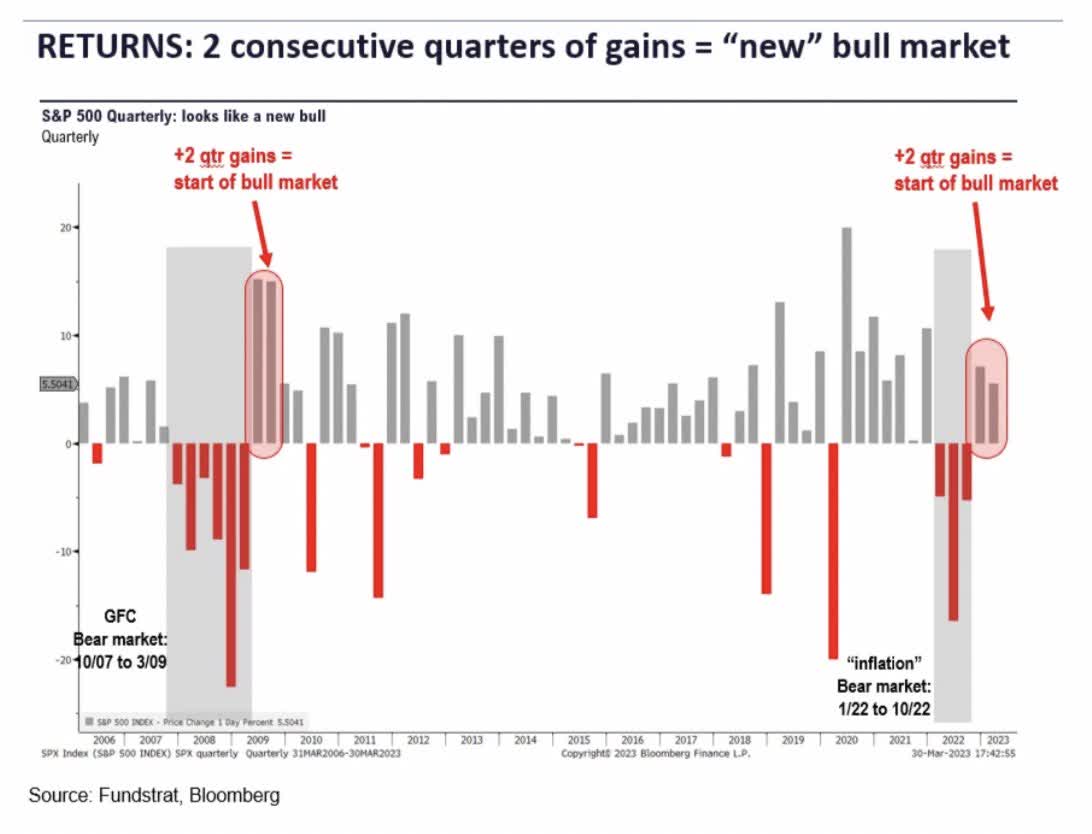
Whether Fundstrat is correct on this call remains to be seen, thus far it appears they are not, but we are early in the month. It is important to note that the S&P 500 has shown incredibly weak breadth, with 4% of the stocks in the index fueling this rally. I will let you decide whether this is evidence of a bull market trend, or whether this is just a bear market rally.
The problem with using historical data is that we have never seen the types of policies we have seen from the central bank, and thus we do not know how this may be manipulating market dynamics, giving us false signals, and so forth. Indicators we have used in the past, like the inverted yield curve, may not work this time. We simply do not know. What we do know is that for the past 12 years the Fed was paying investors to take risks, and now the Fed is paying investors not to take risks, and as they say, don't fight the Fed.
The Evidence Supports the Bears
"Risks to the outlook are heavily skewed to the downside, with the chances of a hard landing having risen sharply." -International Monetary Fund
Wages: YoY real average hourly earnings declined 1.3%, with more decreases likely on the way.
Personal Savings Rate: The personal savings rate has collapsed to an all-time low of 4.6%, furthering the expectation that any dip in the economy or employment could leave consumers with nowhere to turn but credit.
Inflation/Rates: In the most recent NY Fed Survey consumer inflationary expectations are on the rise, proving that the Fed must keep on going in its fight with inflation.
New York Fed Survey of Consumer Expectations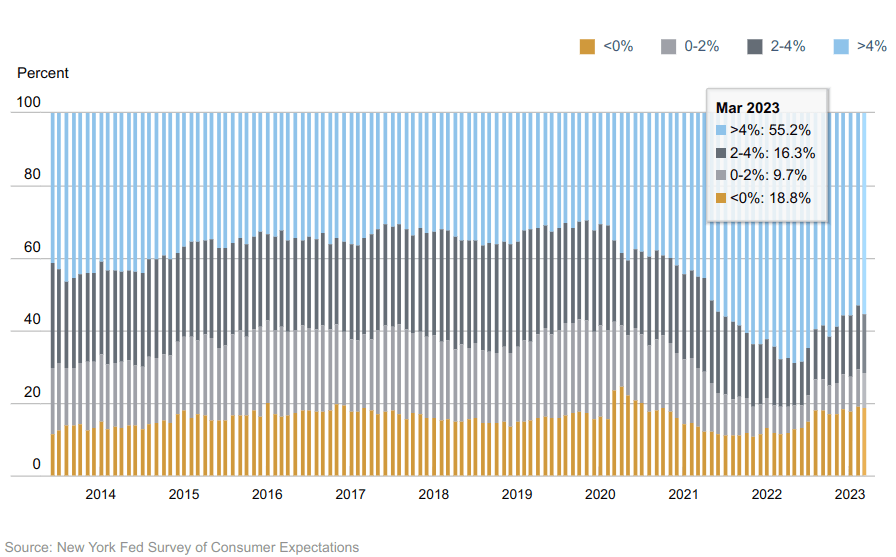
Decline in M2: For the fifth time in 153-years, M2 growth has gone starkly negative. The other times this has happened in the 20th century were 1921, and 1929. Both periods with similar characteristics to today. A recent Bloomberg piece had an interesting comment about this dynamic as it relates to UK M4 growth. "Money supply growth is collapsing in the UK, eurozone and US...a warning of recession and deflation... “Annual broad money growth rates in the UK and Eurozone are well below their 2010s averages – associated with below-target inflation...This is extremely worrying and suggests recession, disinflation and deflation.”
Earnings: With stocks trading above the average valuation level, it leaves them vulnerable to a significant selloff if we get any negative surprises in earnings.
Currently estimates are showing earnings for 2023 at $219.92 ($50.63 in Q1, $54.13 in Q2, $56.84 in Q3, $58.32 in Q4). This assumes a soft-landing scenario and no recession, which I see as unrealistic.
Bank of America analysts wrote in a note that:
"...easy Fed policy and tightening credit conditions typically equate to the worst phase for stocks."
Even uber bulls like Brian Belski at BMO, and Chris Harvey of Wells Fargo who recently said we were in a new bull market, are now admitting things are likely to be difficult in the near term.
"[We] believe the risk/reward over the next six months is skewed to the downside. Over the next 3-6 months, we expect to see a 10% correction, with the SPX trading down to 3700." -Chris Harvey, Wells Fargo
"We believe it will be difficult for stocks to finish this year anywhere near the all-time highs set in early January 2022." -Brian Belski, BMO Capital
Tightening Credit: Consumers are likely to see their credit availability curbed, precisely at the time they need it most. This may mark the end of the Teflon consumer that has held this economy up for so long. Similarly small businesses are seeing their credit tightening.
"More US small businesses reported having greater difficulty getting a loan in March after multiple bank failures led to a further tightening of credit conditions. A net 9% of owners who borrow frequently said financing was harder to get compared to three months earlier, the most since December 2012, according to a survey from the National Federation of Independent Business out Tuesday. The same share expects tougher credit conditions in the next three months, matching the highest level in a decade." -Bloomberg
Market Overvaluation: Markets remain extensively overvalued at over 2 standard deviations from the mean. Previous corrections did not bottom until we reached under 1 standard deviation and in many cases well below the mean. This is telling us that this correction from the extremes resulting from ZIRP are only getting started.
Advisor Perspectives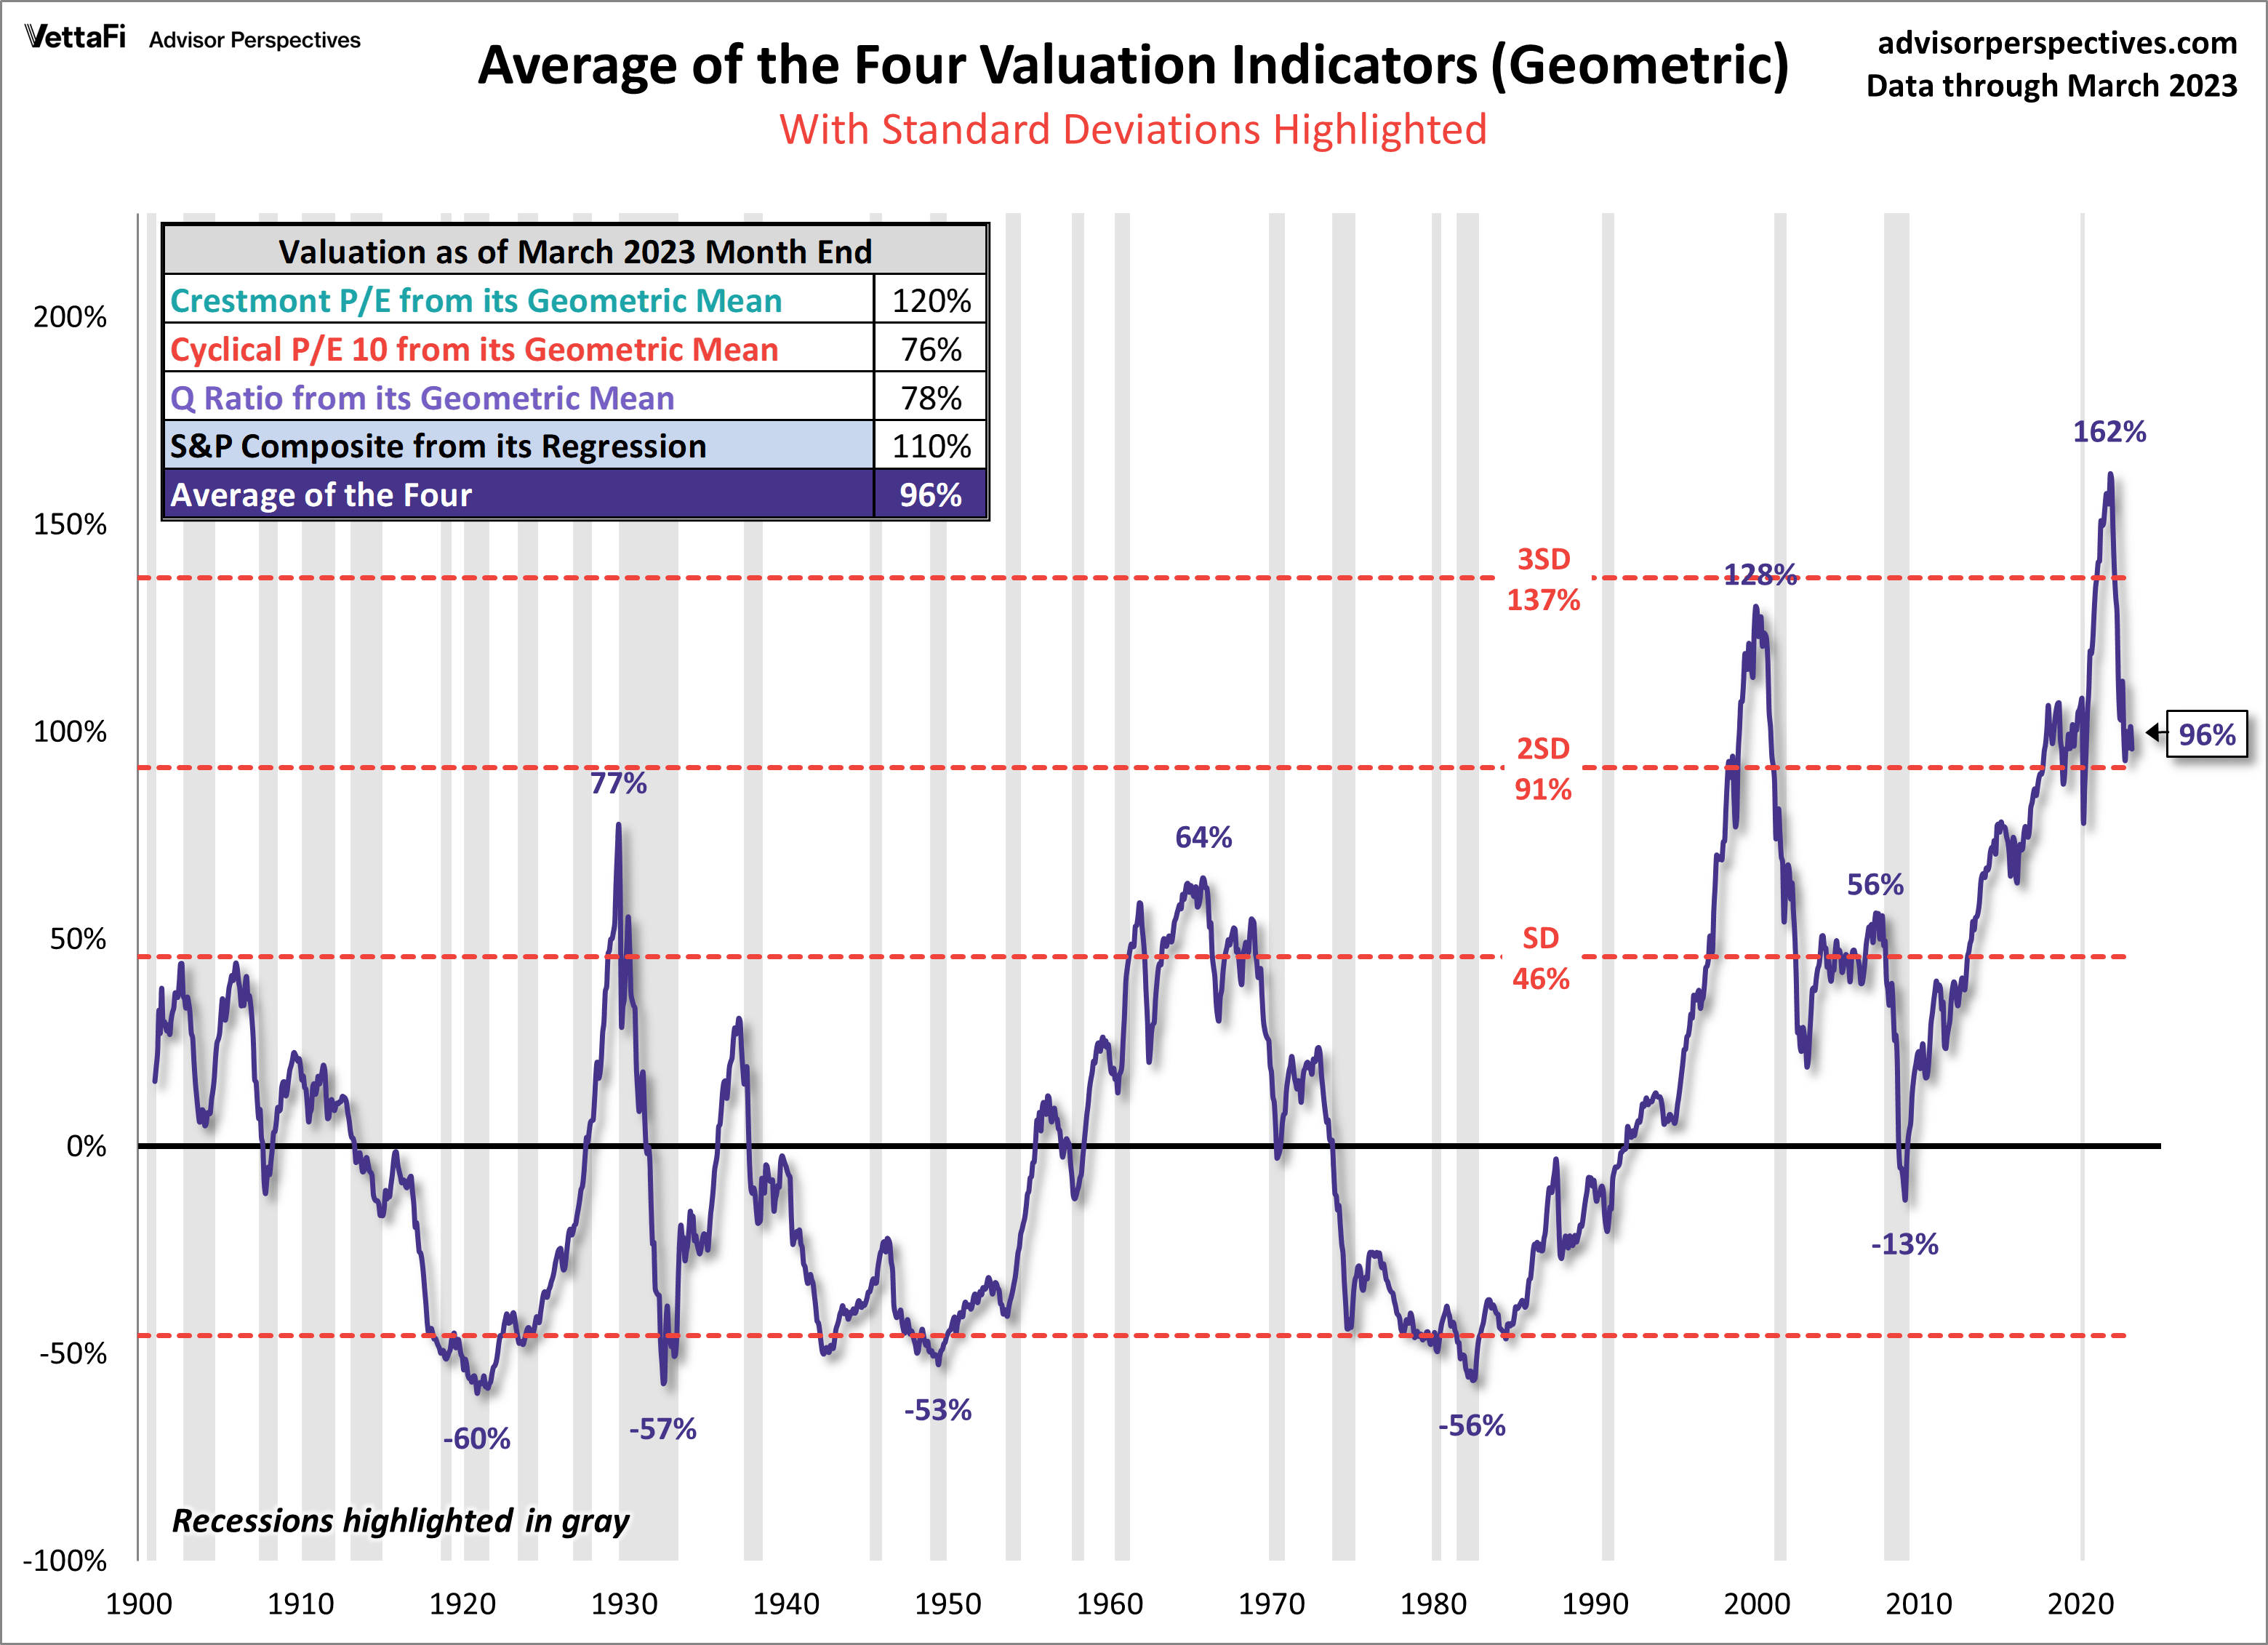
Keith McCullough of Hedgeye has stated that the market currently has a 27:1 downside vs upside, demonstrating the strength of his bearish case. This is further backed up by the severe overvaluation we have in the market.
Hedgeye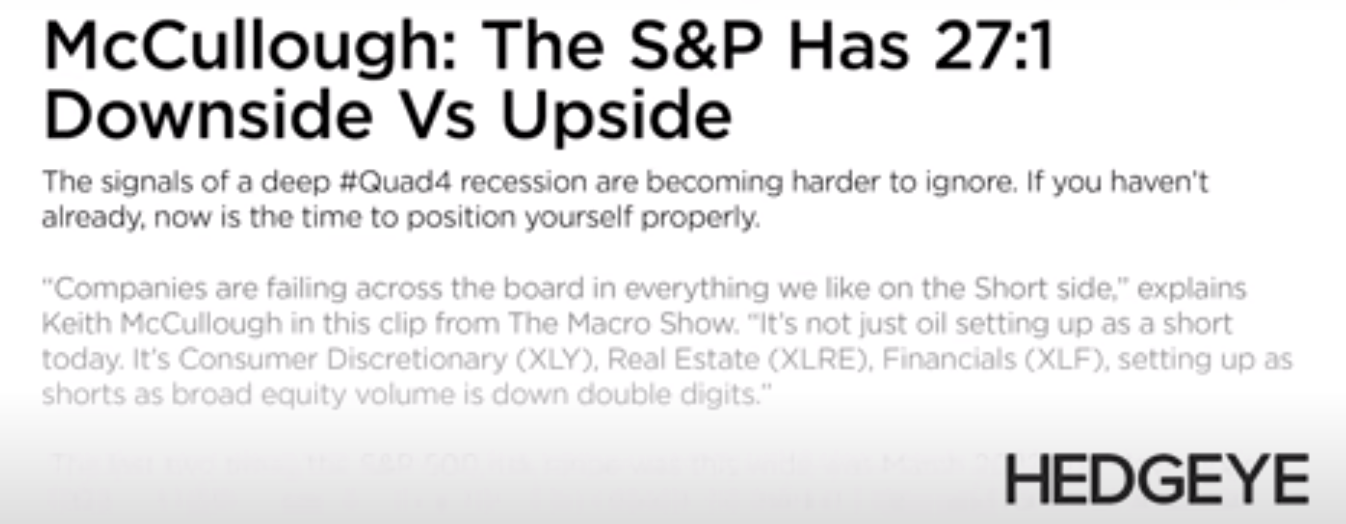
Market Breadth is Weak
The market is up a great deal this year, leading many investors to pile into stocks believing we are in a new bull market. The speculative behavior we have seen from market participants is a very bearish sign. Market breadth is extremely thin as only 20 stocks (4% of the market) have driven the entire rally.
Apollo
Banking System Stability-The banking crisis we have seen after the fall of SVB and other regional banks has driven the inflows of cash to larger money center banks, as well as money market funds.
CNBC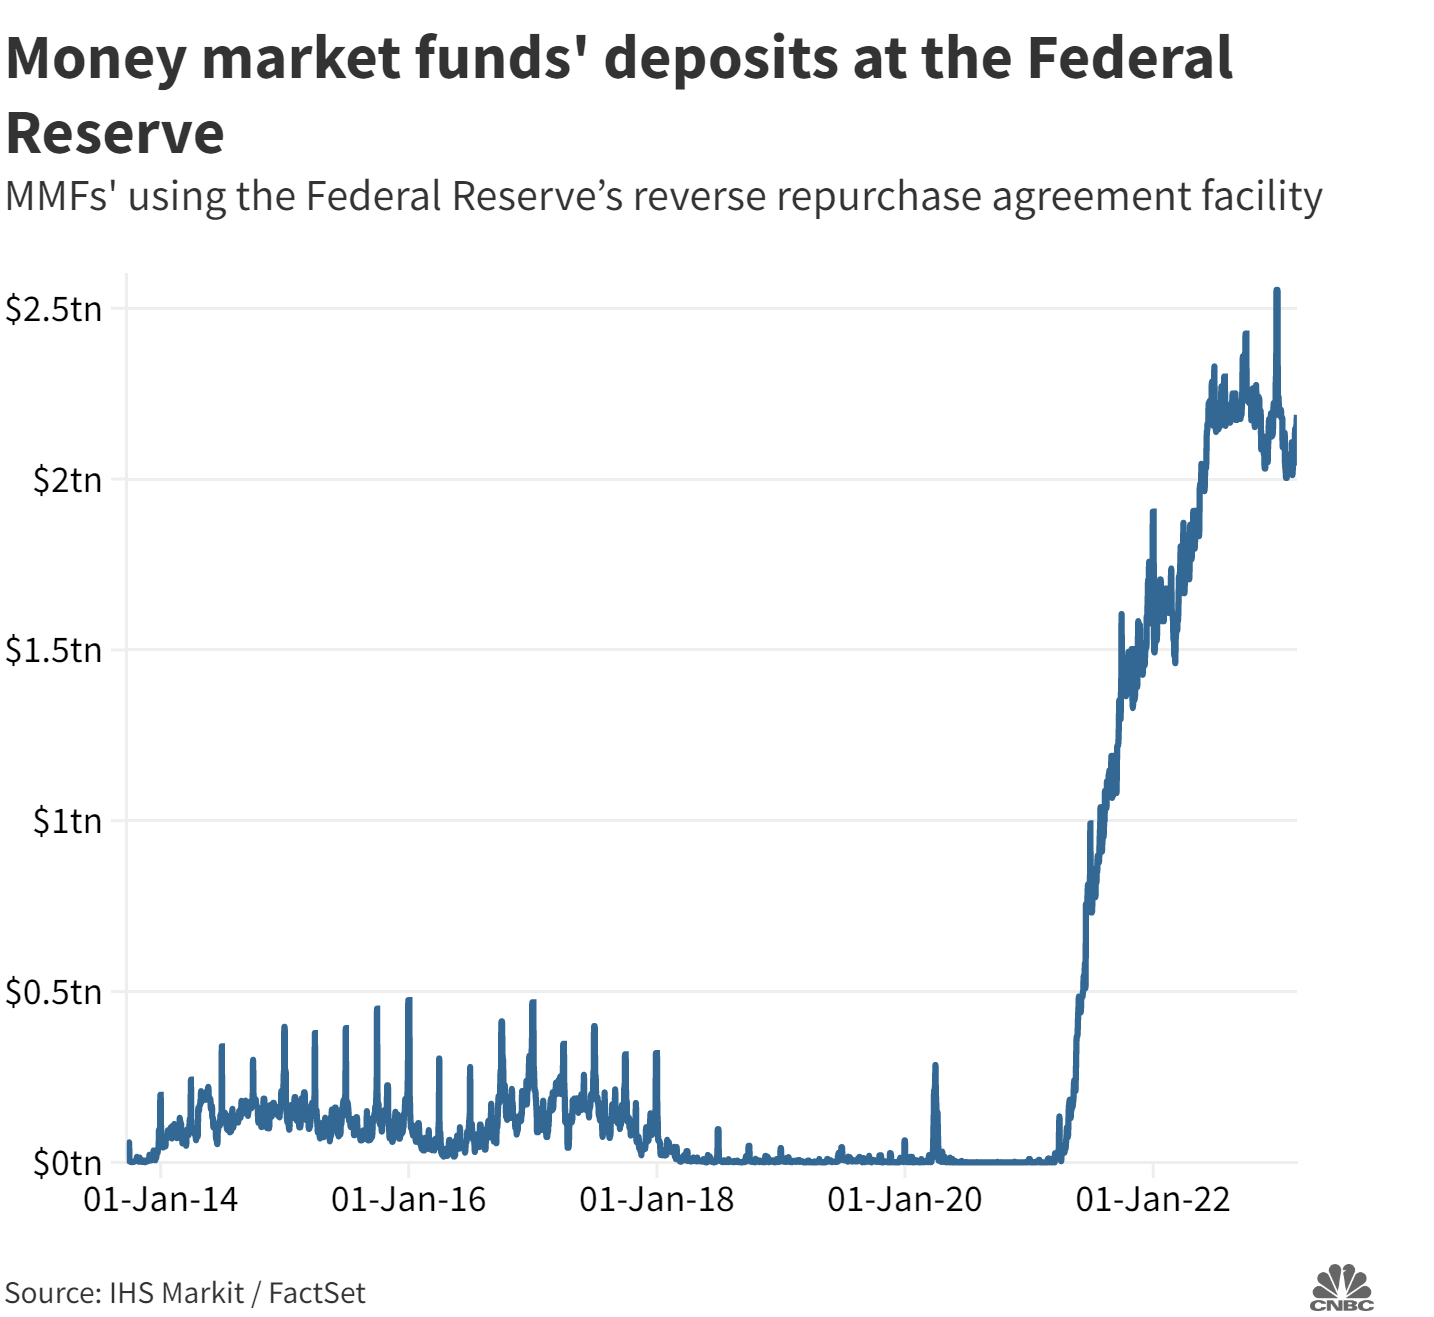
Many believe the worst is over with the banking crisis, but recent data on bank lending tells a different story. banks are clearly under stress, credit is tightening, and deposit shifting is creating an environment where consumer deposits are flowing out of the banking system. This is detailed in a recent article from Bloomberg.
US bank lending contracted by the most on record in the last two weeks of March...Commercial bank lending dropped nearly $105 billion in the two weeks ended March 29, the most in Federal Reserve data back to 1973... Friday’s report also showed commercial bank deposits dropped $64.7 billion in the latest week, marking the 10th-straight decrease... the American Bankers Association index of credit conditions fell to the lowest level since the onset of the pandemic, indicating bank economists see credit conditions weakening over the next six months. As a result, banks are likely to become more cautious about extending credit.
Further analysis of this trend from Jim Bianco @biancoresearch further illustrates the drastic decline we are seeing in lending.
" Total loans at all domestically charted banks are $12.07 trillion (blue). This amount is down $104.7 billion in the last two weeks (middle). This is the largest $ drop ever (data starts in 1974).
@biancoresearch
@biancoresearch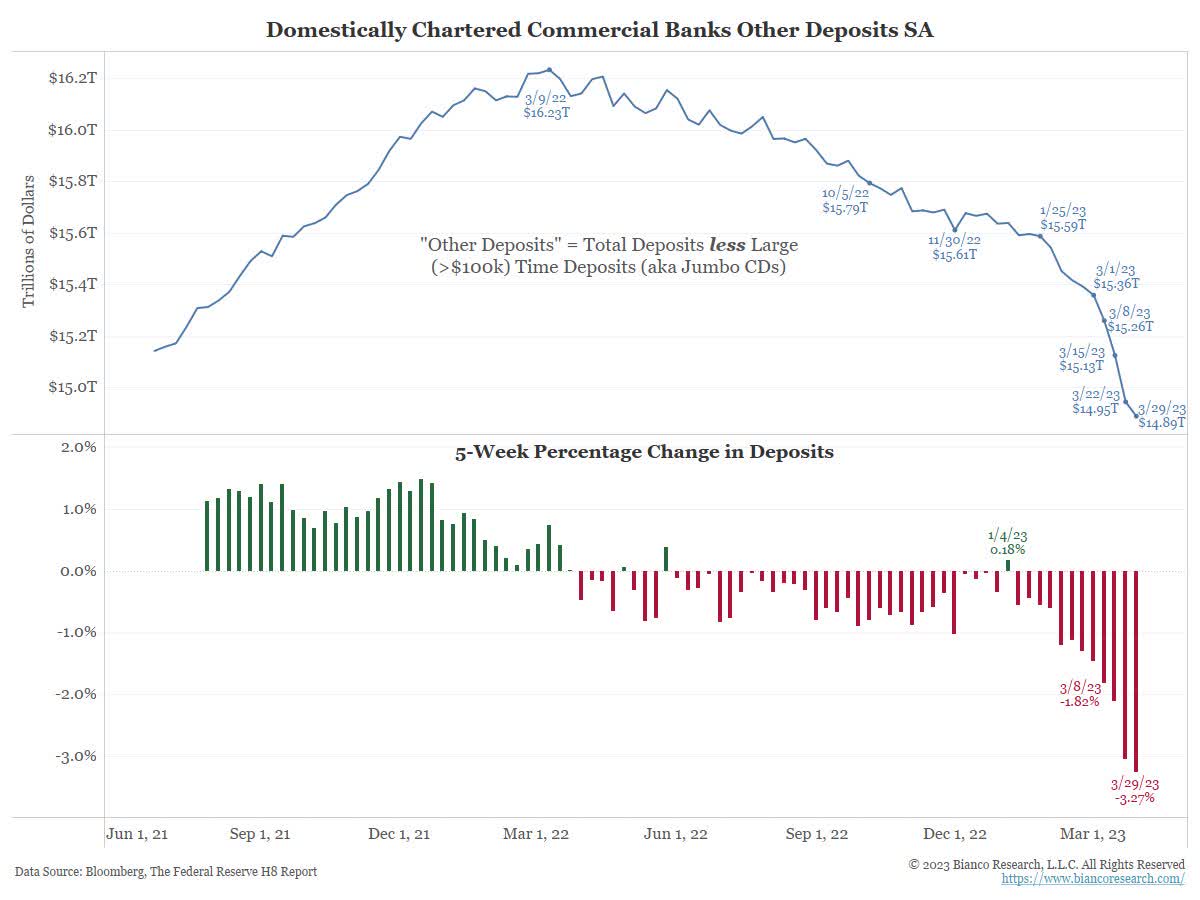
Geopolitical Risk: There are a myriad of risks on the table for markets in the geopolitical sphere. The war in Ukraine rages on, as Russia and China firm their alliance. The looming threat of China's move on Taiwan, and of course our own domestic risks of a refusal of the speaker to push through a clean debt ceiling bill.
"House Speaker Kevin McCarthy said Wednesday that Wall Street should be concerned about the political impasse over the US debt ceiling as the country inches closer to a possible payment default. The California Republican, in an interview with Bloomberg TV’s “Balance of Power” said he is “very concerned” about reaching a deal with Democrats on the debt limit. But he remained opposed to increasing the nation’s debt limit without curbing government spending. “We are never going to move a bill that just raises the debt ceiling,” McCarthy said."
ISM PPI: A report from Pantheon Macro stated: “.. Prices paid fell for the fifth straight month .. a decent leading indicator of wage growth .. Ouch, and worse is coming.”
Pantheon Macroeconomics 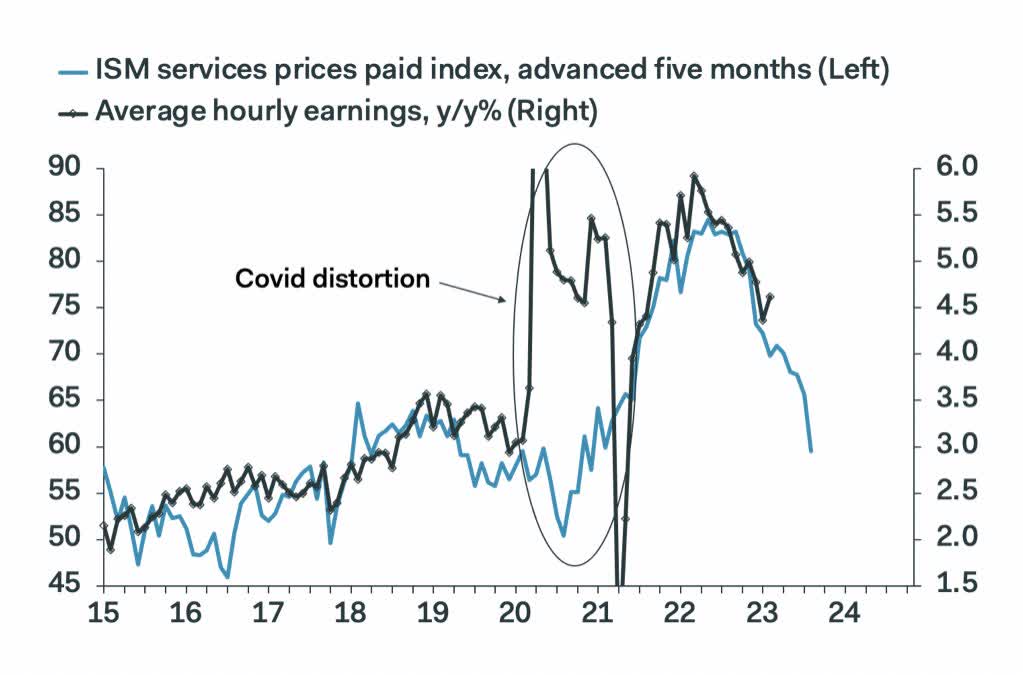
Increases in Small Business bankruptcies- A recent UBS report showed the fastest rise in small business bankruptcies in some time and NFIB data through March showed that access to credit is more difficult than it has been in over a decade.
Closed for business: UBS finds small business bankruptcy filings hit record pace (cnbc.com)
Bloomberg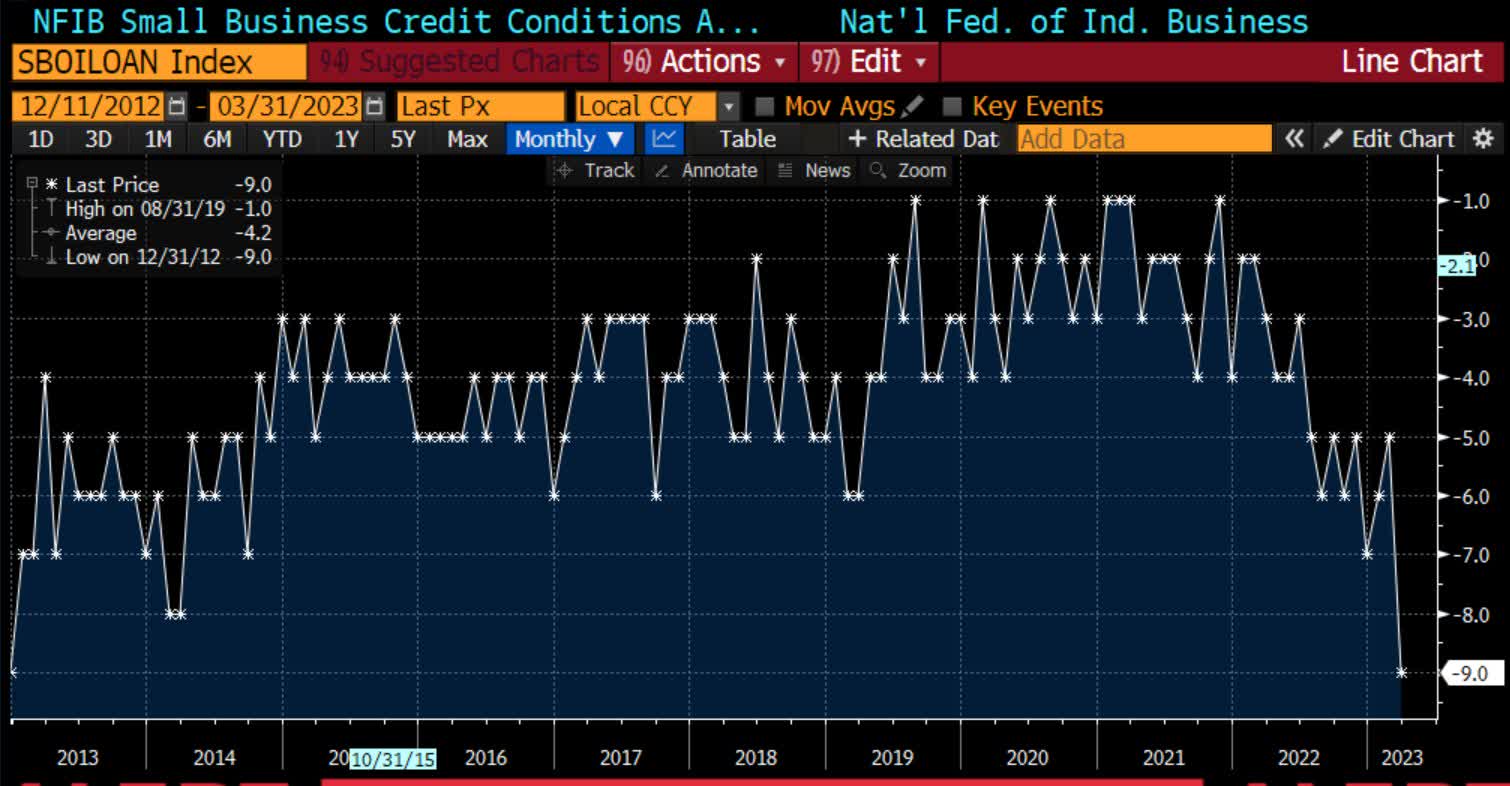
This is all just scratching the surface of evidence I could have brought forward to support the bearish thesis. Bringing further pressure on the markets will be the immediacy of the debt ceiling debate, earnings which will begin this week, as well as a Fed meeting on May 3rd, where they are expected to raise rates another 0.25%.
Conclusion
In conclusion, I believe the preponderance of the evidence supports the conclusion that the economic crisis I have written about for some time is just beginning. Future releases of economic data are likely to show an economy that is weakening.
While there are some environments to take on equity risk, this is not one of them. In this environment, cash and cash equivalents such as U.S. Treasury securities, are an investors best investment option. This is perhaps one of the best environments for fixed income we have seen in over a decade.
Morningstar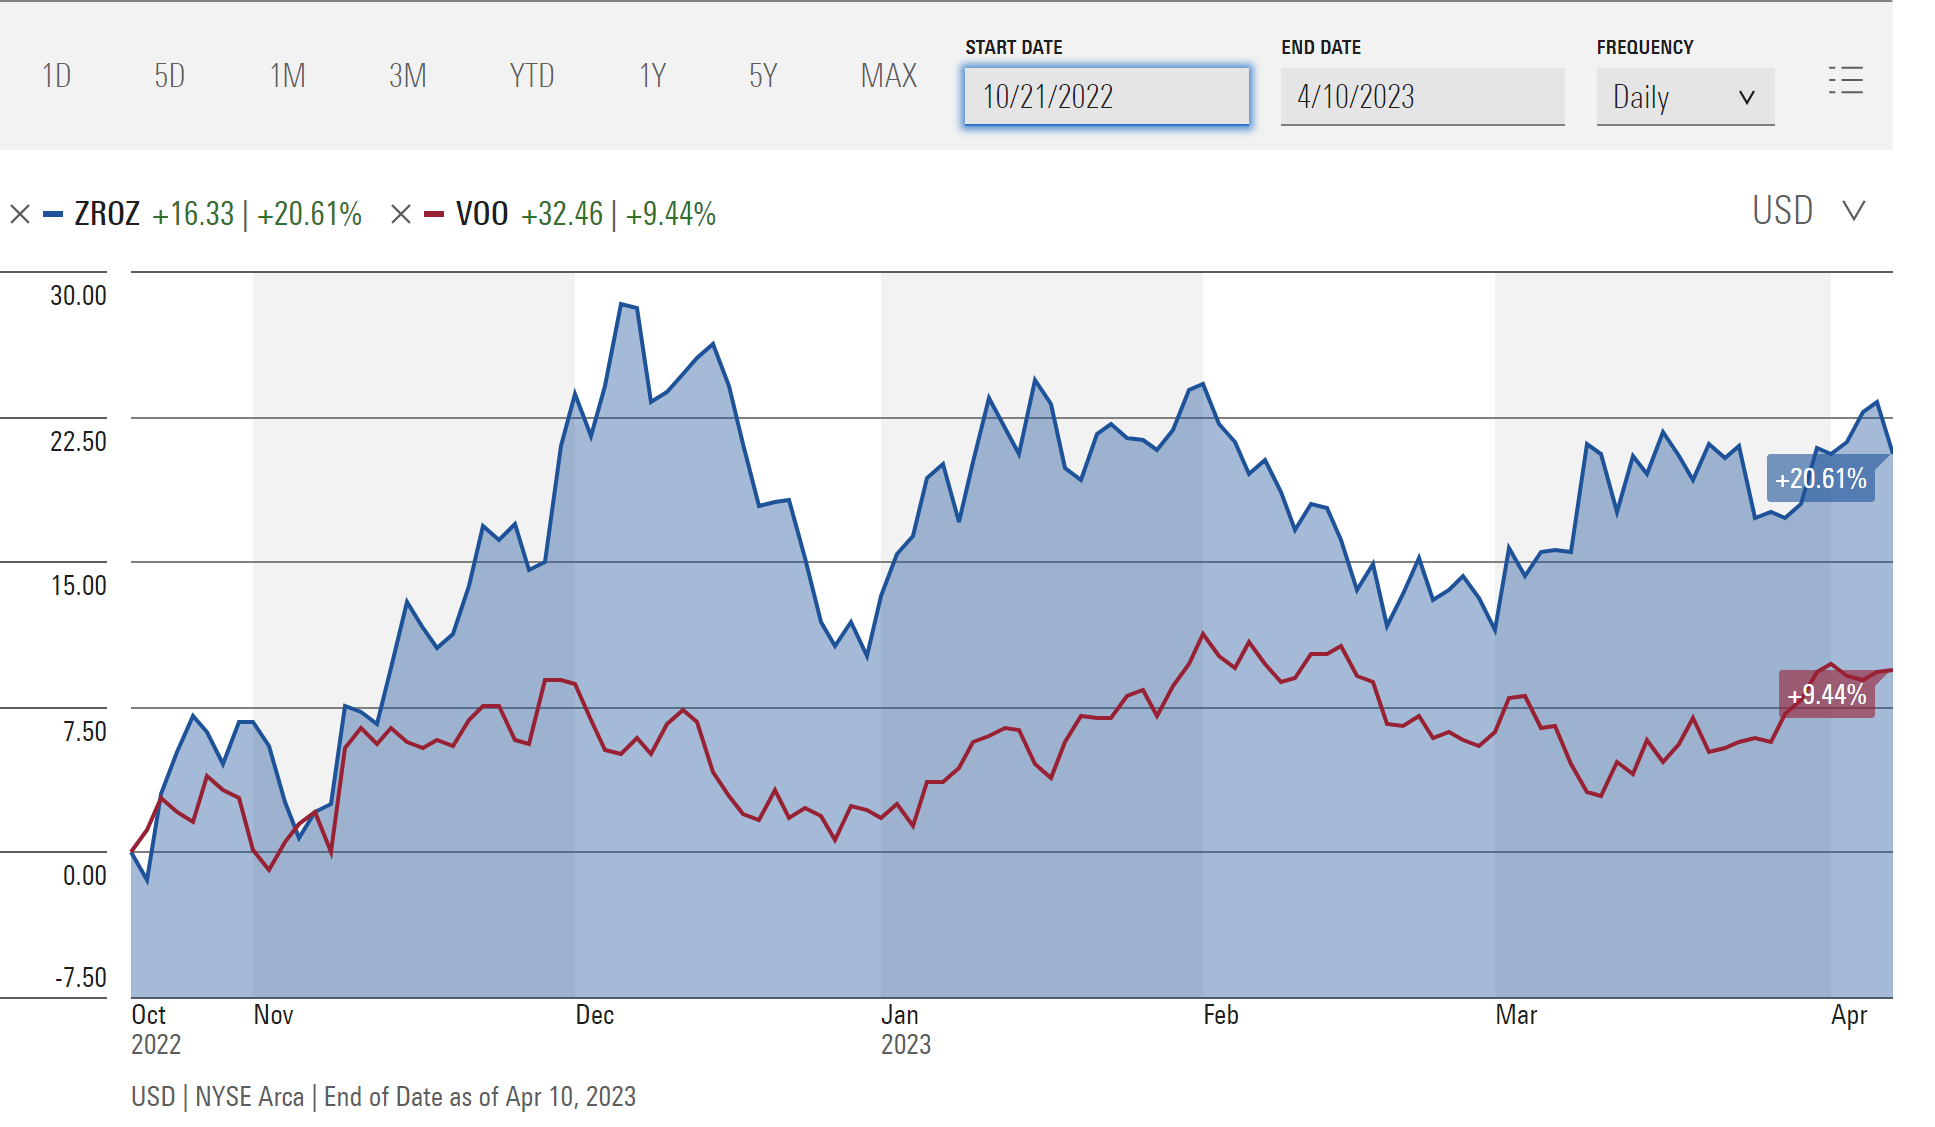
My original call for a top in rates, made on October 21, of 2022, saw the 30-year Treasury zero (NYSEARCA:ZROZ) rally 20.61%, outpacing the S&P 500 Index by 11.17%. Already YTD my bullish call on 30-year Zeroes has produced a return of 9.46% eclipsing the S&P 500 by 234Bps. I believe this continued alpha over the equity index will continue to widen as the bear market thesis plays out. In my view, the bull market in Treasury bonds is just getting started.
This article was written by

Analyst’s Disclosure: I/we have a beneficial long position in the shares of US TREASURY BONDS either through stock ownership, options, or other derivatives. I wrote this article myself, and it expresses my own opinions. I am not receiving compensation for it (other than from Seeking Alpha). I have no business relationship with any company whose stock is mentioned in this article.
This article is for informational purposes only and is not an offer to buy or sell any security. It is not intended to be financial advice, and it is not financial advice. Before acting on any information contained herein, be sure to consult your own financial advisor.
Seeking Alpha's Disclosure: Past performance is no guarantee of future results. No recommendation or advice is being given as to whether any investment is suitable for a particular investor. Any views or opinions expressed above may not reflect those of Seeking Alpha as a whole. Seeking Alpha is not a licensed securities dealer, broker or US investment adviser or investment bank. Our analysts are third party authors that include both professional investors and individual investors who may not be licensed or certified by any institute or regulatory body.