Playing The Steel Price Comeback: Ternium A Value

Summary
- Latin American equities have not enjoyed as much relative strength against the US as some other regions this year.
- With rallying commodities, namely steel prices, there is fundamental upside potential for Ternium.
- I spot key price levels to watch on this.
Vladimir Zapletin
The US dollar has dropped to near its lowest level of the year. Cooler than expected March CPI was the latest catalyst to send investors fleeing from the greenback. That macro price action is typically a boon for non-US stocks. Also, when commodities rally, Materials sector stocks often benefit. This year, though, the Latin America 40 ETF (ILF) is merely oscillating when compared to the S&P 500 ETF (SPY). The chart below is one I will be watching should we continue to see upside in Materials and Energy equities.
Right now, though, I see shares of Ternium (NYSE:TX), a firm with high Latin America business exposure, as a buy on valuation and the stock also sports a high yield.
Latin American Markets Treading Water Vs SPX
Stockcharts.com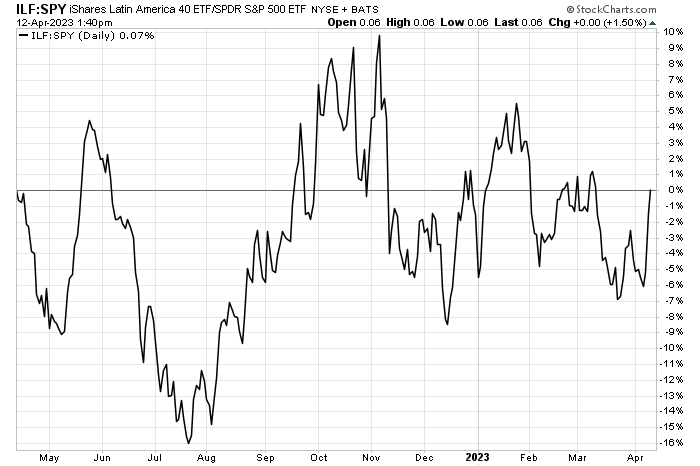
According to Bank of America Global Research, Ternium is the leading flat steel producer in Latin America, with crude steel capacity of 12.4M tons. Its facilities are located in Mexico, Argentina, Brazil, Colombia, and the US. The company is controlled by Techint Group, which directly owns 63% of total capital, and market free float is 18%. Ternium sells most of its products in domestic markets, and the majority of shipments are flat steel products.
Steel Prices: 10-Month Highs
TradingView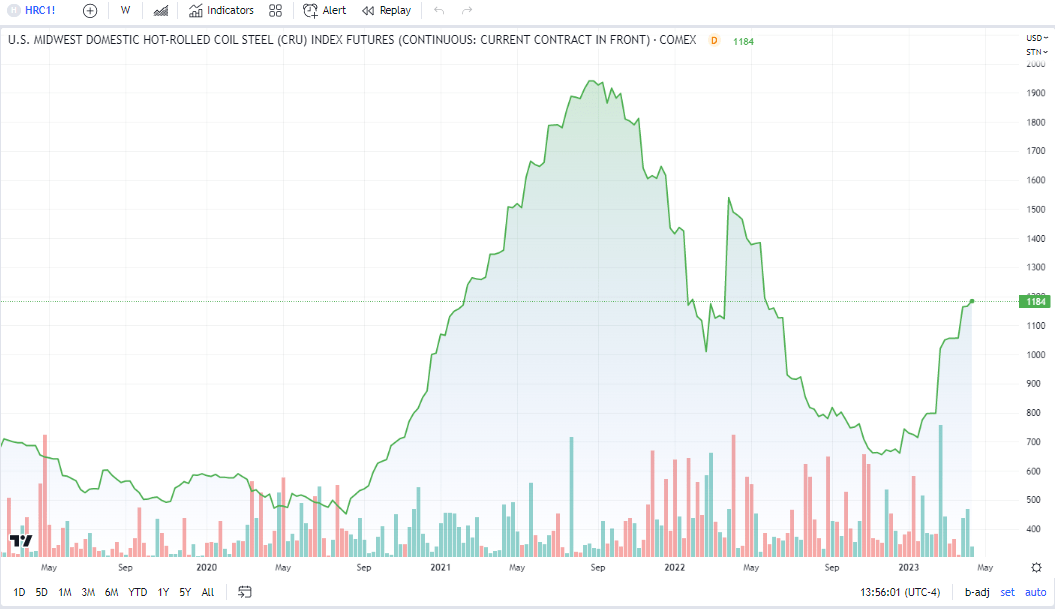
The $8.2 billion market cap Metals & Mining industry company within the Materials sector trades at a low 3.2 trailing 12-month GAAP price-to-earnings ratio and pays a high 6.5% dividend yield, according to The Wall Street Journal. With steel prices notching their highest level since June last year, there are tailwinds for TX.
The steep price decline in Midwest Steel was thought to lead to big sequential earnings drops, but we could see some upward revision estimates when Ternium releases Q1 results later this month. Back in February, the firm missed bottom-line estimates by just a penny while missing on revenue by $180 million. Shares have traded about sideways since.
On valuation, analysts at BofA see earnings falling more than 16% this year and another 14% in 2024. More per-share profit declines on a YoY basis are expected in 2025. The Bloomberg consensus forecast, meanwhile, is even more bearish on earnings. With a variable dividend policy, the dividend yield may turn lower, but the upside here is that TX’s free cash flow yield will not suffer too badly.
I see a lot of these bearish earnings and cash flow trends priced in now that the stock has a mid-single digit P/E and an EV/EBITDA ratio that is about one-third of the S&P 500’s. If we assume $6 of normalized earnings on a look-ahead basis and apply the stock’s 5-year average forward operating P/E, then the stock should be near $48, materially higher than where it is today.
Ternium: Earnings, Valuation, Dividend Forecasts
BofA Global Research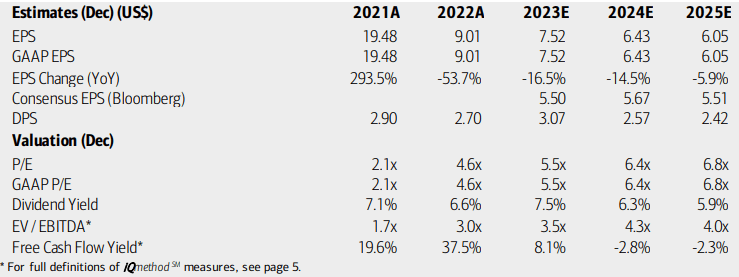
TX: Trades At A Low Valuation Vs History
Seeking Alpha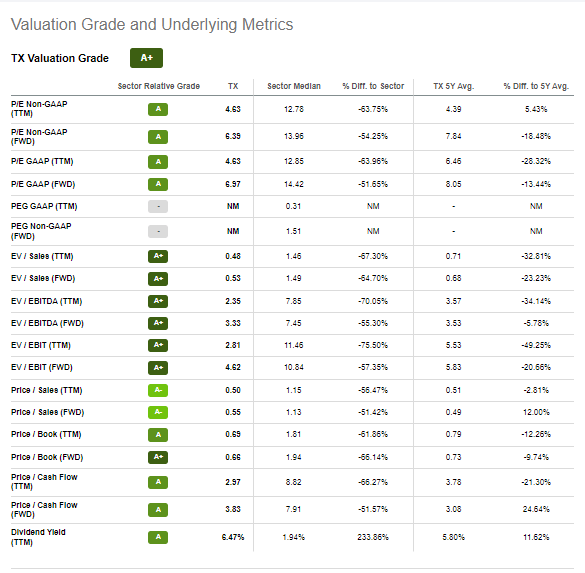
Looking ahead, corporate event data provided by Wall Street Horizon show a confirmed Q1 2023 earnings date of Tuesday, April 25 BMO with a shareholder meeting a week later before its May 4 dividend ex-date.
Corporate Event Risk Calendar
Wall Street Horizon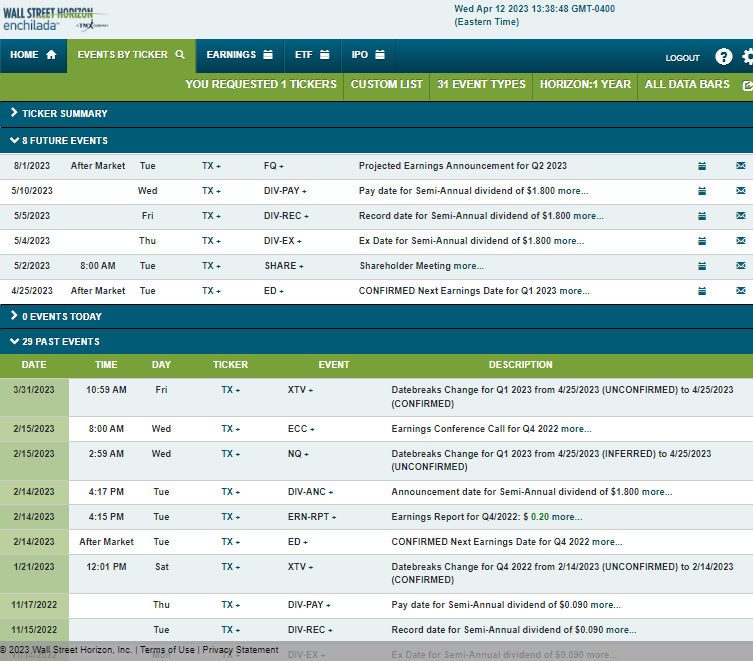
The Technical Take
The primary feature I see on the chart of TX is a bearish head and shoulders pattern in the near term. But price action has been strong in the last few sessions, and the pattern could be on the verge of being negated with this latest upward thrust above the $41.76 level (the right shoulder). Next resistance is the 2023 high that took place in early March near $46.
With shares breaking their downtrend in Q4 last year and having formed a bullish basing pattern from September through early January, the 200-day moving average is now flat to potentially being upwardly sloped before long. So, there are bullish trend signals ongoing. What I would like to see is the RSI momentum indicator holding the $40 level so that it remains in the bullish 40 to 90 range. Overall, long here with a stop under $38 is a favorable risk/reward setup ahead of earnings later this month.
TX: Bearish Head And Shoulders Negated?
Stockcharts.com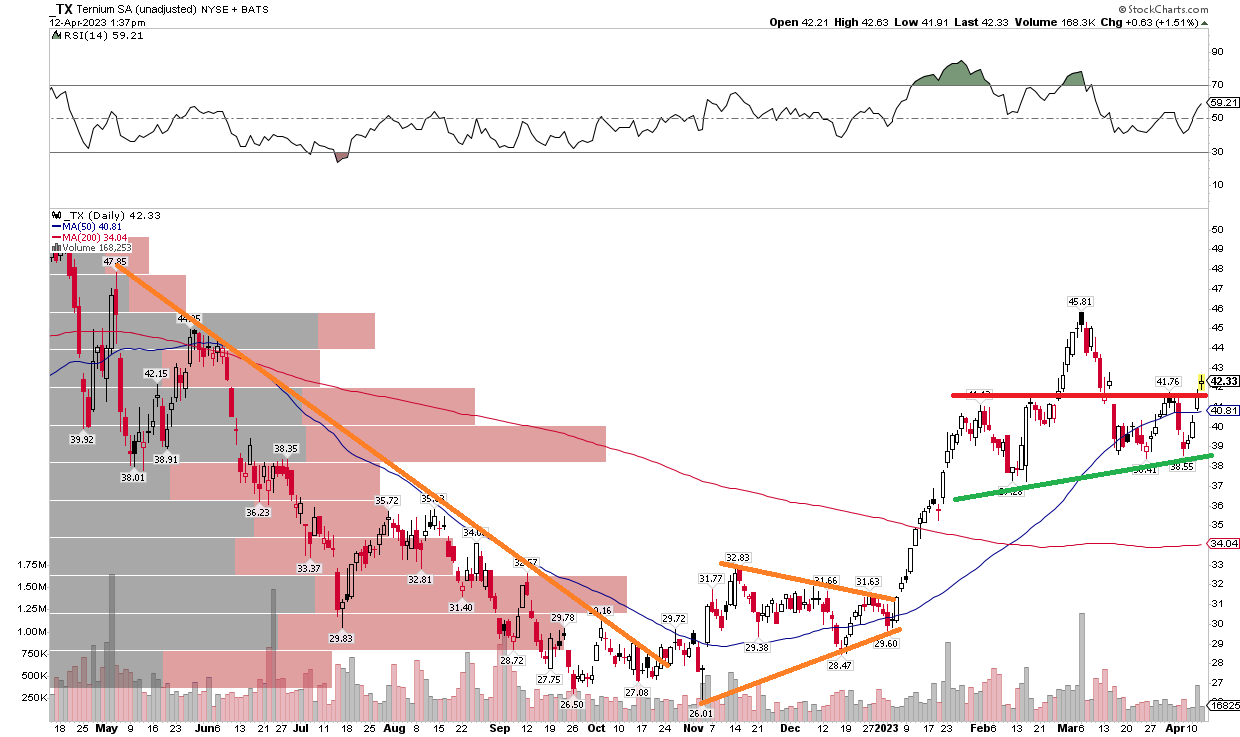
The Bottom Line
I like the valuation on TX, and I see some upside potential on the chart. Long here going into earnings looks like a good play.
This article was written by

Analyst’s Disclosure: I/we have no stock, option or similar derivative position in any of the companies mentioned, and no plans to initiate any such positions within the next 72 hours. I wrote this article myself, and it expresses my own opinions. I am not receiving compensation for it (other than from Seeking Alpha). I have no business relationship with any company whose stock is mentioned in this article.
Seeking Alpha's Disclosure: Past performance is no guarantee of future results. No recommendation or advice is being given as to whether any investment is suitable for a particular investor. Any views or opinions expressed above may not reflect those of Seeking Alpha as a whole. Seeking Alpha is not a licensed securities dealer, broker or US investment adviser or investment bank. Our analysts are third party authors that include both professional investors and individual investors who may not be licensed or certified by any institute or regulatory body.