Amazon: Not Worth Buying Here

Summary
- Amazon stock remains nearly 50% below its 2022 highs. So we revisited our valuation metrics and assessed why investors aren't too keen to return aggressively.
- While AWS and advertising are expected to help Amazon recover its profitability growth, its top-line growth is expected to be well below its pre-COVID metrics.
- As such, valuing AMZN as if it was still a high-growth company likely isn't appropriate.
- We think the market is right, and we don't think we can still justify our Buy rating on AMZN at the current price levels. However, a deeper pullback should help.
- I do much more than just articles at Ultimate Growth Investing: Members get access to model portfolios, regular updates, a chat room, and more. Learn More »
HJBC
Amazon (NASDAQ:AMZN) has outperformed its consumer discretionary sector (XLY) peers since its December lows as investors returned to risk-on stocks. However, AMZN formed a bull trap or false upside breakout in early February.
We also discussed that bull trap in our previous article, which led to further downside subsequently, as AMZN collapsed nearly 25% toward its March lows.
However, buyers returned robustly to support the significant dip in AMZN, committed to stopping it from sliding down further to re-test its December lows.
As such, AMZN survived the selling onslaught and has since recovered but remains below its February highs.
While we had anticipated downside volatility in February, we understated the strength of the bears, as long-term buyers failed to return in droves to push AMZN back higher.
Hence, we reassessed our valuation metrics and evaluated what could keep long-term buyers from taking a more aggressive approach to AMZN, as its relative valuation remains well below its 10Y average.
In other words, with AMZN looking so "attractively valued" relative to its long-term metrics, why aren't buyers returning? Did we miss something critical about AMZN's valuation metrics?
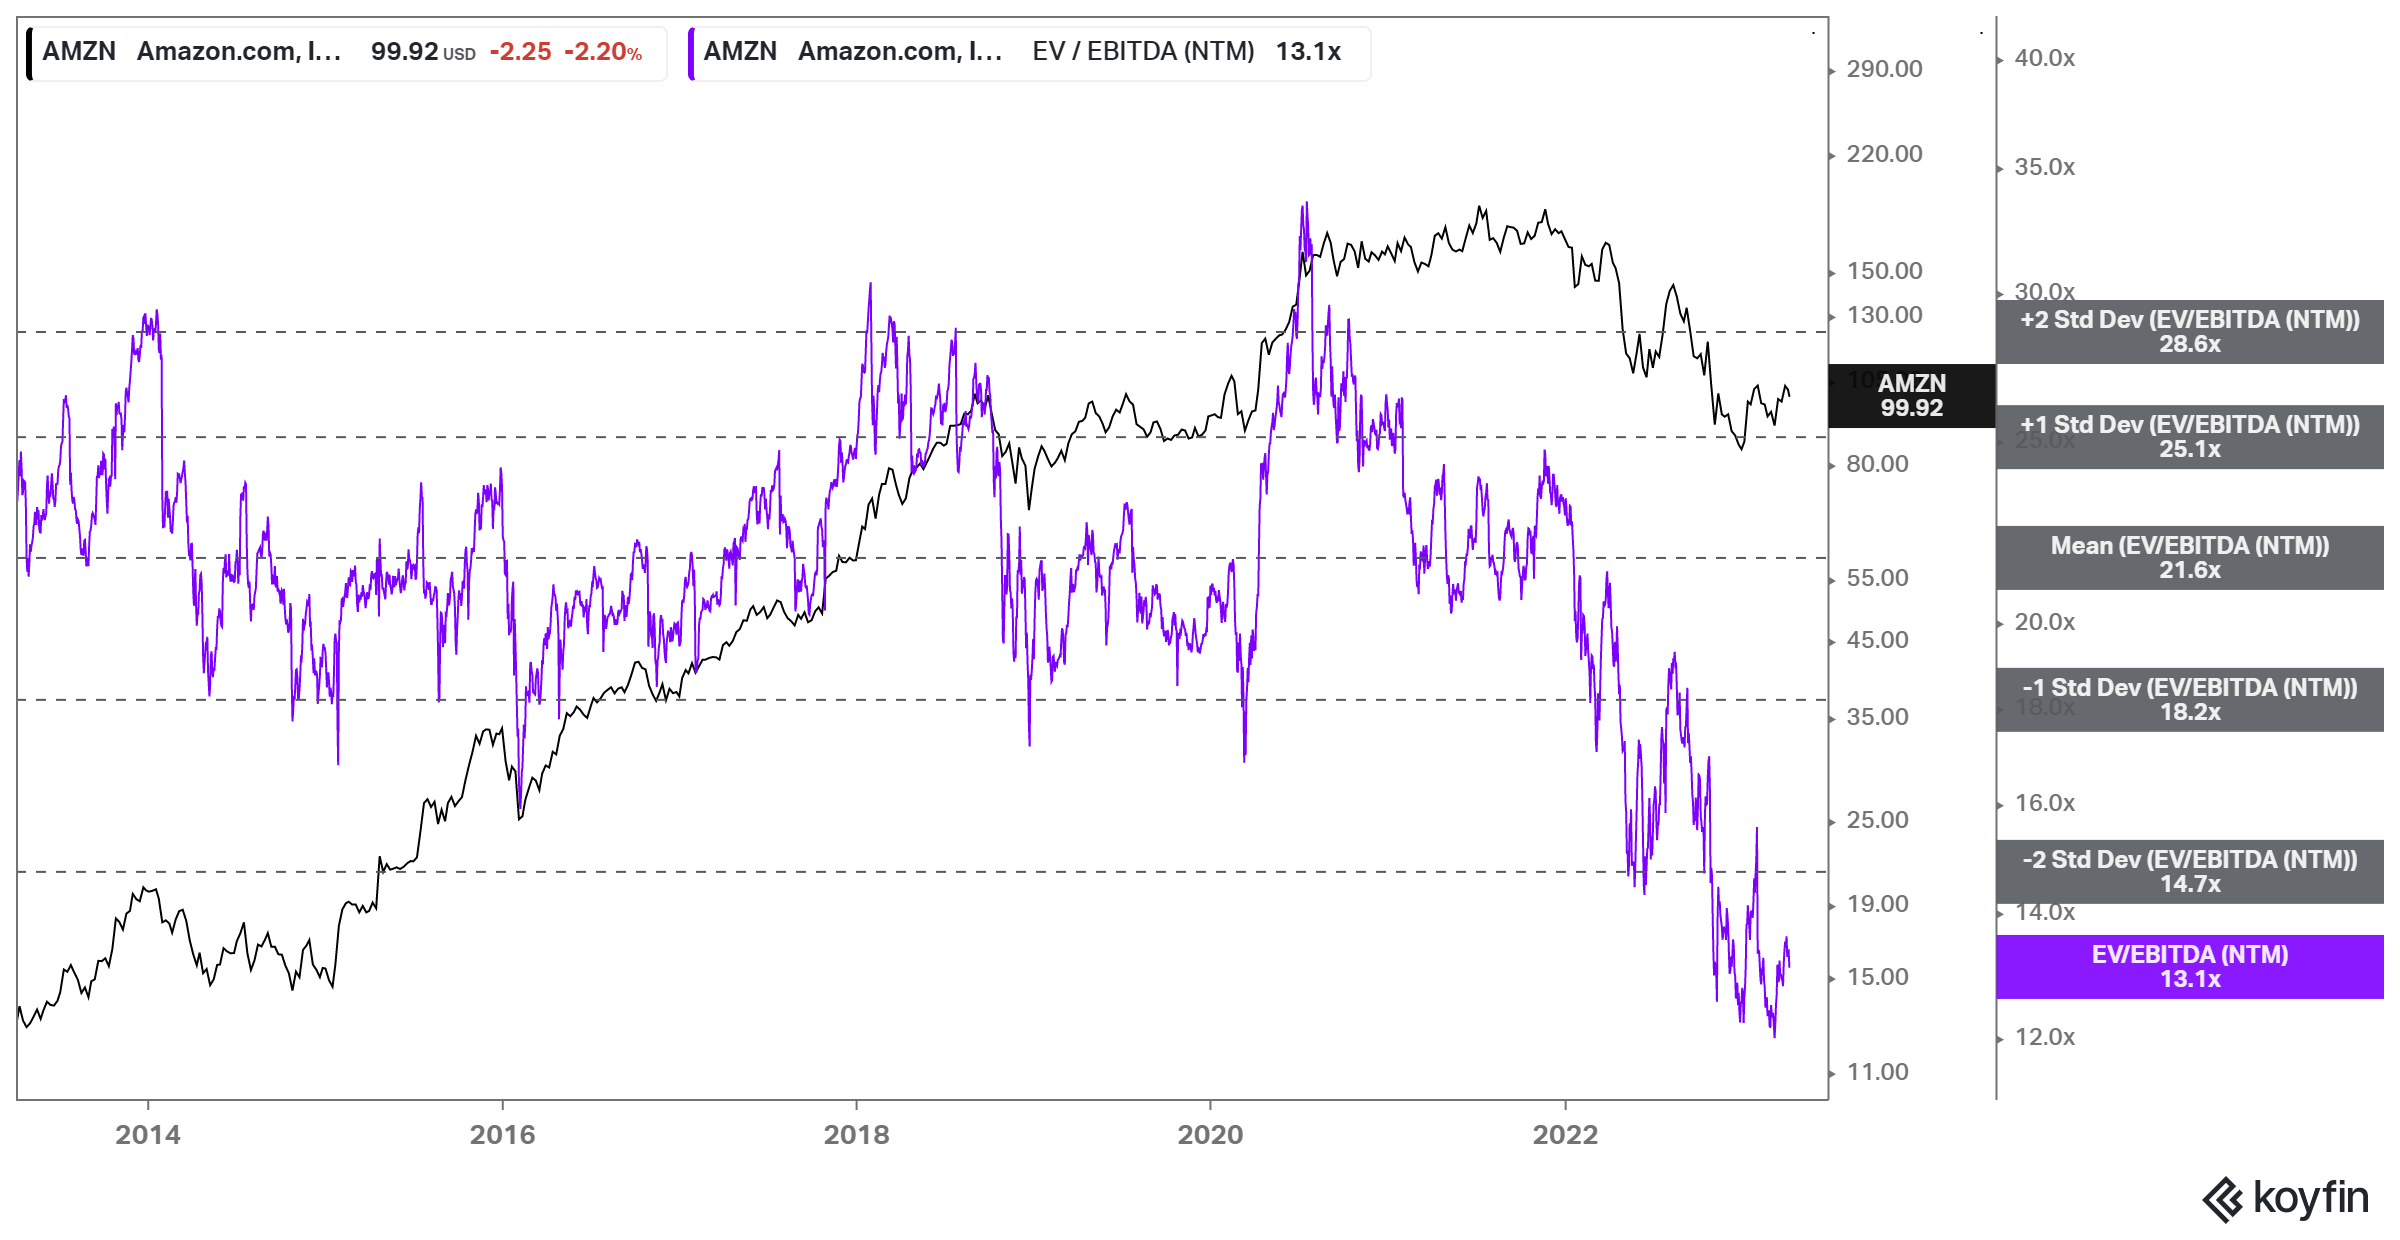
AMZN NTM EBITDA multiples valuation trend (koyfin)
As seen above, AMZN last traded at an NTM EBITDA multiple of 13.1x, well below its 10Y average of 21.6x and below the two standard deviation zone under its 10Y mean.
Therefore, some investors could argue that AMZN seems "too cheap," relatively speaking. However, if that's the case, why aren't investors jumping back on board, even as they loaded up into more expensive semiconductor stocks (SOXX) since the start of the year? The risk-on rally has failed to gain significant traction in AMZN, as it still struggles below its February bull trap highs.
Trefis' sum-of-the-parts or SOTP valuation suggests that AMZN has a nearly 35% implied upside to its SOTP estimate of $134. Morningstar's fair value estimate of $137 indicates that it's pretty close to Trefis' projection.
Wall Street analysts have an average PT of about $137 on AMZN. As such, investors who take these numbers at face value would have considered AMZN as significantly undervalued (we consider >25% implied upside to fair value estimate as significantly undervalued).
However, taking a closer look at the assumptions undergirding these estimates, we begin to discern some issues investors will need to be wary about.
Morningstar pegged its fair value estimate on a free cash flow or FCF yield of 1.7%. Is that low or high? AMZN last traded at an FCF yield of 2%, below its 10Y average of 2.73%.
Hence, Morningstar's assumption is highly aggressive, as it likely values as a high-growth company.
| Revenue growth % | 2013-12 | 2014-12 | 2015-12 | 2016-12 | 2017-12 | 2018-12 | 2019-12 | 2020-12 | 2021-12 | 2022-12 | Latest Qtr |
| YoY % | 21.87 | 19.52 | 20.25 | 27.08 | 30.80 | 30.93 | 20.45 | 37.62 | 21.70 | 9.40 | 8.58 |
| 10Y CAGR % | 30.33 | 29.10 | 28.84 | 28.93 | 28.20 | 28.37 | 27.60 | 27.43 | 25.60 | 23.74 |
AMZN revenue growth metrics. Data source: Morningstar, S&P Cap IQ
Investors who picked AMZN ten years ago invested in a fast-growth company that delivered a 10Y revenue CAGR of more than 30% in FY13. However, that growth has slowed, decelerating to 23.7% last year.
Amazon's 9.4% YoY top-line growth in 2022 was significantly lower than its YoY growth rates over the past ten years. However, with AMZN still nearly 50% below its 2021 highs, hasn't it been reflected in its valuation?
Analysts are optimistic that Amazon could continue to bank on the recovery of Amazon Web Services or AWS and its dominance in retail media ads to drive its forward revenue growth.
Accordingly, AWS is still seen as a 20% annualized grower, while retail media ads are expected to grow by a CAGR of 17% from 2022-25. However, despite Amazon's network advantage, coupled with members' stickiness in Prime, retail isn't expected to grow as fast as its 10Y average.
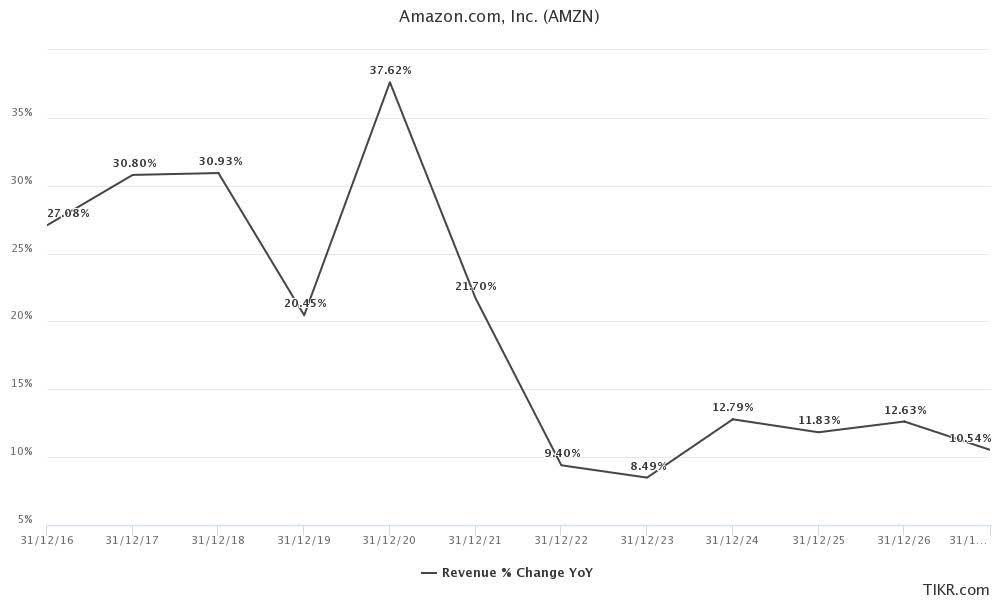
AMZN revenue growth % consensus estimates (TIKR)
As seen above, Amazon is expected to post revenue growth of 8.5% in FY23 before a further recovery to 12.8% in FY24. However, the projections after FY24 are also nowhere close to its 10Y average.
As such, investors must assess how robustly it can lift its operating leverage and recover its battered FCF margins.
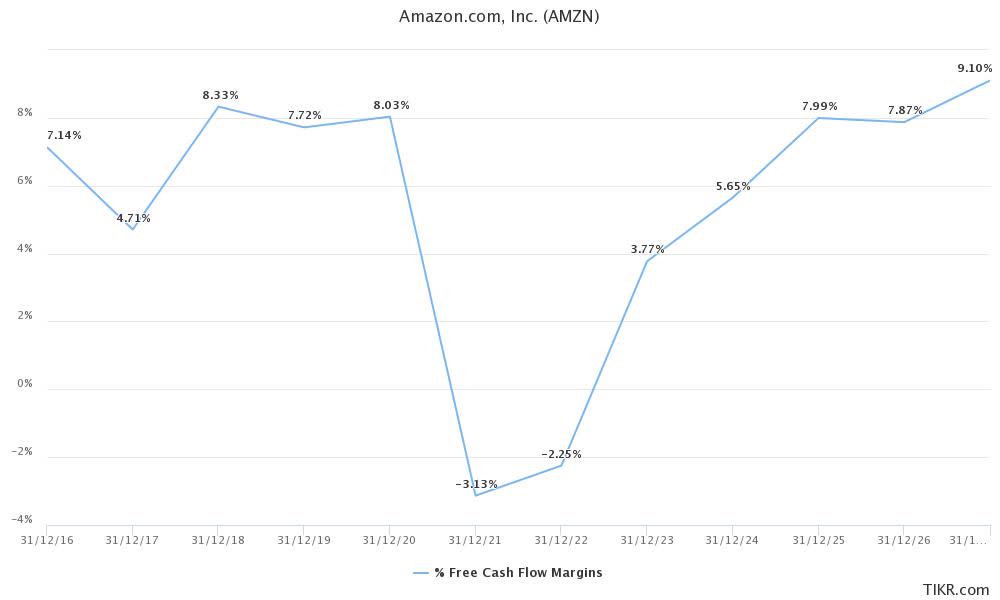
AMZN FCF margins consensus % estimates (TIKR)
The company is expected to recover its pre-COVID FCF margins by FY25. Taking that into account, AMZN last traded at an FY25 FCF yield of 5.5%.
While it may seem reasonable, it suggests that the upside will likely be limited if we consider the February bull trap highs at the $115 level.
That level implies an FY25 FCF yield of 4.7%, which we consider fairly valued for a relatively slow top-line grower like AMZN over the next three years.
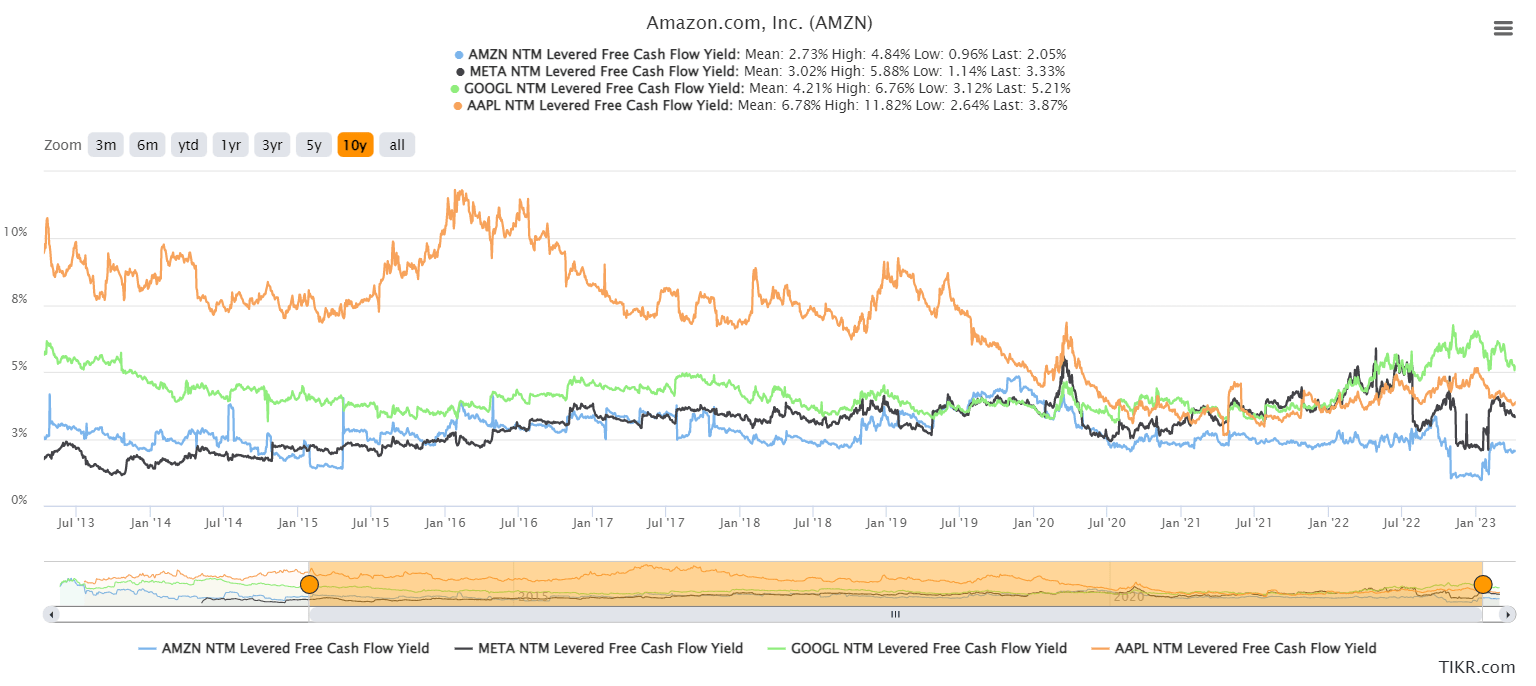
AMZN NTM FCF yield % Vs. peers (TIKR)
As seen above, Amazon's three leading peers are already trading at a much more attractive valuation than AMZN. Google (GOOGL) (GOOG) leads the pack with an NTM FCF yield of 5.2%, while Meta (META) posted 3.33% despite its remarkable recovery from its November 2022 lows.
Even Apple (AAPL) last traded at an FCF yield of 3.87%. Hence, AMZN's highly aggressive valuation (relative to its forward growth potential) isn't constructive, suggesting why market operators aren't too keen to return to it.
We view AMZN's fair value as closer to the $110 level, below the February bull trap.
Therefore, it suggests an implied upside of just above 10% to fair value, which we don't think is sufficient to continue justifying a buy rating, given other undervalued opportunities in the market right now.
Rating: Hold (Revised from Buy).
Important note: Investors are reminded to do their own due diligence and not rely on the information provided as financial advice. The rating is also not intended to time a specific entry/exit at the point of writing unless otherwise specified.
We Want To Hear From You
Have additional commentary to improve our thesis? Spotted a critical gap in our thesis? Saw something important that we didn’t? Agree or disagree? Comment below and let us know why, and help everyone to learn better!
A Unique Price Action-based Growth Investing Service
- We believe price action is a leading indicator.
- We called the TSLA top in late 2021.
- We then picked TSLA's bottom in December 2022.
- We updated members that the NASDAQ had long-term bearish price action signals in November 2021.
- We told members that the S&P 500 likely bottomed in October 2022.
- Members navigated the turning points of the market confidently in our service.
- Members tuned out the noise in the financial media and focused on what really matters: Price Action.
Sign up now for a Risk-Free 14-Day free trial!

This article was written by

JR research was featured as one of Seeking Alpha's leading contributors in 2022. See: https://seekingalpha.com/article/4578688-seeking-alpha-contributor-community-2022-by-the-numbers
Unlock the key insights to growth investing with JR Research - led by founder and lead writer JR. Our dedicated team is focused on providing you with the clarity you need to make confident investment decisions.
Transform your investment strategy with our popular Investing Groups service.
Ultimate Growth Investing specializes in a price action-based approach to uncovering the opportunities in growth and technology stocks, backed by actionable fundamental analysis.
We believe price action is a leading indicator.
Price action analysis is a powerful and versatile toolkit for the informed investor because it can be used to analyze any publicly traded security. As such, it offers investors with invaluable insights into understanding market behavior and sentiments.
Plus, stay ahead of the game with our general stock analysis across a wide range of sectors and industries.
Improve your returns and stay ahead of the curve with our short- to medium-term stock analysis.
We not only identify long-term potential but also seize opportunities to profit from short-term market swings, using a combination of long and short set-ups.
Join us and start seeing experiencing the quality of our service today.
Lead writer JR's profile:
I was previously an Executive Director with a global financial services corporation. I led company-wide award-winning wealth management teams that were consistently ranked among the best in the company.
I graduated with an Economics Degree from National University of Singapore [NUS]. NUS is Asia's #1 university according to Quacquarelli Symonds [QS] annual higher education ranking. It also held the #11 position in QS World University Rankings 2022.
I'm also a Commissioned Officer (Reservist) with the Singapore Armed Forces. I was the Battalion Second-in-command of an Armored Regiment. I currently hold the rank of Major. I graduated as the Distinguished Honor Graduate from the Armor Officers' Advanced Course as I finished first in my cohort of Armor officers. I was also conferred the Best in Knowledge award.
My LinkedIn: www.linkedin.com/in/seekjo
Analyst’s Disclosure: I/we have a beneficial long position in the shares of AMZN, GOOGL, META either through stock ownership, options, or other derivatives. I wrote this article myself, and it expresses my own opinions. I am not receiving compensation for it (other than from Seeking Alpha). I have no business relationship with any company whose stock is mentioned in this article.
Seeking Alpha's Disclosure: Past performance is no guarantee of future results. No recommendation or advice is being given as to whether any investment is suitable for a particular investor. Any views or opinions expressed above may not reflect those of Seeking Alpha as a whole. Seeking Alpha is not a licensed securities dealer, broker or US investment adviser or investment bank. Our analysts are third party authors that include both professional investors and individual investors who may not be licensed or certified by any institute or regulatory body.