JOET: Well-Diversified ETF Combining Quality, Momentum, And Unexpected Value

Summary
- Virtus Terranova U.S. Quality Momentum ETF holds 125 large and mid-caps screened on quality and momentum.
- It is well-diversified across sectors and holdings.
- The high-quality portfolio surprisingly shows good valuation metrics.
- Performance is below par, but price history is too short to assess the strategy.
- Quantitative Risk & Value members get exclusive access to our real-world portfolio. See all our investments here »
gesrey
This article series aims at evaluating ETFs (exchange-traded funds) regarding the relative past performance of their strategies and quality metrics of their current portfolios. As holdings change over time, updated reviews are posted from time to time.
JOET strategy and portfolio
Virtus Terranova U.S. Quality Momentum ETF (NASDAQ:JOET) has been tracking the Terranova U.S. Quality Momentum Index since 11/17/2020. It has a portfolio of 125 stocks, $109M in asset value, a 12-month distribution yield of 1.21% and an expense ratio of 0.29%. The fund implements a strategy mixing quality factors and momentum.
As described by Virtus, quality and momentum scores are calculated for the 500 largest U.S. securities in market capitalization. The momentum score is based on the 12-month return. The quality score combines three factors: return on equity ("ROE"), debt to equity ratio and three-year sales growth rate. The underlying index selects a set of 125 stocks determined as the better half regarding the quality score within the better half regarding the momentum score. The index is reconstituted and rebalanced in equal weight every quarter.
JOET invests almost exclusively in U.S. companies (96.7% of asset value), about 59% in large caps and 41% in mid-caps.
Healthcare is the heaviest sector with 17.2% of assets. It is followed by industrials, information technology and financials (almost on par between 14% and 15%). Other sectors are below 12%. Compared to the S&P 500 (SP500), JOET overweights mostly industrials, energy and materials. It underweights technology, communication, consumer discretionary, real estate and utilities. As a result, it is better diversified across sectors than the large cap benchmark (see next chart).
Sector breakdown (chart: author; data: Fidelity, SSGA)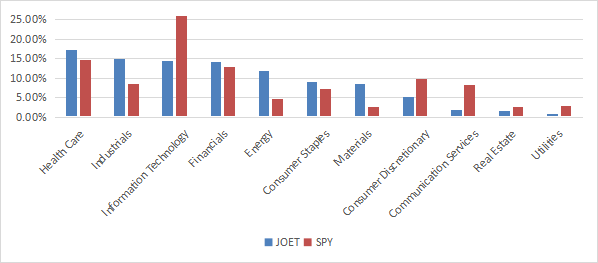
JOET is cheaper than the S&P 500 regarding the usual valuation ratios, as reported in the next table. This is quite surprising: focusing on momentum or quality factors usually results in selecting more expensive stocks.
JOET | SPY | |
Price / Earnings TTM | 16.25 | 20.62 |
Price / Book | 3.64 | 3.78 |
Price / Sales | 1.86 | 2.39 |
Price / Cash Flow | 12.61 | 15.41 |
All positions are reset in equal weight on rebalancing dates, but they may drift with price action. The next chart lists the top 10 holdings as of writing. These are the constituents with the highest return since the last rebalancing. They represent 9.4% of asset value and the heaviest position weighs less than 1.1%, so the fund is well-diversified and risks related to individual stocks are low.
Ticker | Name | Weight | EPS growth %TTM | P/E TTM | P/E fwd | Yield% |
Arista Networks, Inc. | 1.07% | 62.40 | 37.31 | 27.42 | 0 | |
The Hershey Co. | 0.96% | 11.94 | 32.56 | 27.52 | 1.60 | |
Cadence Design Systems, Inc. | 0.94% | 23.69 | 69.28 | 42.91 | 0 | |
Copart, Inc. | 0.94% | -0.85 | 33.74 | 31.71 | 0 | |
Progressive Corp. | 0.94% | -79.22 | 126.01 | 23.40 | 0.27 | |
W.W. Grainger, Inc. | 0.93% | 51.53 | 21.45 | 19.43 | 1.06 | |
Lululemon Athletica, Inc. | 0.93% | -10.95 | 54.78 | 31.64 | 0 | |
Activision Blizzard, Inc. | 0.91% | -44.34 | 44.35 | 22.11 | 0.55 | |
General Mills, Inc. | 0.90% | 23.57 | 18.80 | 20.55 | 2.48 | |
Stryker Corp. | 0.90% | 18.34 | 47.09 | 28.96 | 1.03 |
Performance
The next chart compares the total return since inception of JOET, the benchmark SPY, and four other quality-style ETFs:
- iShares MSCI USA Quality Factor ETF (QUAL), reviewed here
- Invesco S&P 500 Quality ETF (SPHQ), reviewed here
- Vanguard U.S. Quality Factor ETF (VFQY), reviewed here
- JPMorgan U.S. Quality Factor ETF (JQUA), reviewed here.
JOET is lagging this group. However, price history is too short to assess the strategy performance in the long term.
JOET vs competitors and SPY (Seeking Alpha)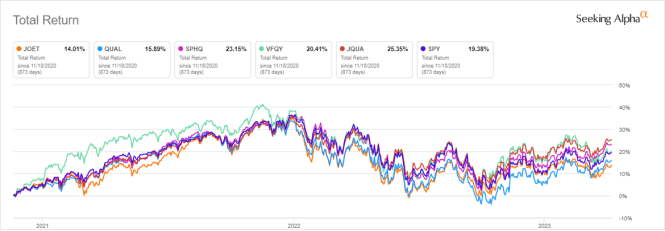
I have simulated the strategy as I understand it from January 2000 to June 2021 (next table). The rules are not completely disclosed in the prospectus, so my code is just one possible interpretation.
1/1/2000-1/1/2021 | Total Return | Annual.Return | MaxDrawdown | Sharpe ratio | Volatility |
simulated JOET - my interpretation | 510.01% | 8.99% | -50.91% | 0.56 | 15.19% |
S&P 500 (SPY) | 278.67% | 6.55% | -55.42% | 0.41 | 15.33% |
Equal-weight S&P 500 (RSP) | 531.28% | 9.17% | -59.90% | 0.51 | 17.70% |
Data calculated with Portfolio123.
ETF management fees are included in SPY performance, but must be subtracted from the simulation result. With JOET's 0.29% expense ratio, my interpretation of the strategy would have outperformed SPY by 2.15 percentage points annualized. It also shows a slightly lower risk measured in maximum drawdown.
The fund has an equal-weight methodology, so I included the equal-weight S&P 500 (RSP) in the table: it may be a more appropriate benchmark. The difference in annualized return is immaterial, but risk reduction in drawdown and volatility is significant. Once again, this simulation is not based on the fund's real rules, but on a simple (maybe simplistic) interpretation of the prospectus.
JOET vs. my quality benchmark
In previous articles, I have presented my preferred quality metrics: Return on Assets, Piotroski F-score, Altman Z-score.
The next table simulates a subset of the S&P 500 since JOET inception: stocks with an above-average ROA, a good Altman Z-score and a good Piotroski F-score. The subset is rebalanced quarterly to make it comparable with the fund's strategy.
11/18/2020-4/11/2023 | Total Return | Annual.Return | MaxDrawdown | Sharpe ratio | Volatility |
Quality subset | 24.50% | 9.58% | -24.30% | 0.45 | 19.50% |
SPY | 19.38% | 7.68% | -24.50% | 0.39 | 18.17% |
Past performance is not a guarantee of future returns. Data Source: Portfolio123.
My quality subset outperforms JOET by over 10% in total return (the fund returned 14% according to the previous chart). However, the ETF's performance is real, whereas the subset is simulated. My core portfolio holds 14 stocks selected in this subset (more info at the end of this post).
Scanning JOET with quality metrics
JOET holds 125 stocks. According to my calculations, the aggregate ROA, Altman Z-score and Piotroski F-score are better than for the S&P 500 (see next table). These metrics, which are more comprehensive than the factors used in the strategy, confirm that the portfolio quality is superior to the benchmark.
JOET | SPY | |
Altman Z-score | 5.19 | 3.42 |
Piotroski F-score | 6.17 | 5.58 |
ROA % TTM | 10.71 | 7.61 |
In my ETF reviews, risky holdings are companies with at least 2 red flags among: bad Piotroski score, negative ROA, unsustainable payout ratio, bad or dubious Altman Z-score, excluding financials and real estate, where these metrics are unreliable. Here, there is only one risky holding, and its weight is negligible (0.62%). This company is Gen Digital Inc. (GEN), with an Altman Z-score of 0.65 and a Piotroski F-score of 3.
Takeaway
Virtus Terranova U.S. Quality Momentum ETF invests in 125 large and mid-caps with a methodology combining quality, momentum and equal-weight. It is well-diversified across sectors and holdings. My preferred quality metrics confirm the fund has a high-quality portfolio. Unexpectedly, Virtus Terranova U.S. Quality Momentum ETF is also cheaper than the S&P 500 regarding valuation metrics. The fund has lagged competitors since inception, but price history is too short to assess performance. A long-term simulation of my interpretation of the strategy slightly beats the S&P 500. JOET is not very liquid: if you trade it, use limit orders (it is always recommended anyway).
Quantitative Risk & Value (QRV) features data-driven strategies in stocks and closed-end funds outperforming their benchmarks since inception. Get started with a two-week free trial now.

This article was written by

Step up your investing experience: try Quantitative Risk & Value for free now (limited offer).
I am an individual investor and an IT professional, not a finance professional. My writings are data analysis and opinions, not investment advice. They may contain inaccurate information, despite all the effort I put in them. Readers are responsible for all consequences of using information included in my work, and are encouraged to do their own research from various sources.
Analyst’s Disclosure: I/we have no stock, option or similar derivative position in any of the companies mentioned, and no plans to initiate any such positions within the next 72 hours. I wrote this article myself, and it expresses my own opinions. I am not receiving compensation for it (other than from Seeking Alpha). I have no business relationship with any company whose stock is mentioned in this article.
Seeking Alpha's Disclosure: Past performance is no guarantee of future results. No recommendation or advice is being given as to whether any investment is suitable for a particular investor. Any views or opinions expressed above may not reflect those of Seeking Alpha as a whole. Seeking Alpha is not a licensed securities dealer, broker or US investment adviser or investment bank. Our analysts are third party authors that include both professional investors and individual investors who may not be licensed or certified by any institute or regulatory body.