Why We Prefer Verizon Over AT&T Now

Summary
- We have been long-term bulls on both AT&T and Verizon.
- However, recent developments have led us to reconsider our thesis.
- Price advancements made the valuation of T less attractive and the safety of its dividends is now on the borderline only, much weaker than VZ.
- Existing investors might want to consider trimming their T position.
- And potential telecom investors should take a closer look at VZ.
- I do much more than just articles at Envision Early Retirement: Members get access to model portfolios, regular updates, a chat room, and more. Learn More »
youngvet/iStock Unreleased via Getty Images
Thesis
Readers familiar with our writings know that we have been long-term bullish on both AT&T (NYSE:T) and Verizon (NYSE:VZ). We liked both for their capital-appreciation potential in the next few years, the wide margin of safety at their compressed valuations, and the safe and high dividend yield. For example, as shown in the chart below, we first published our bullish thesis on T stock in Feb 2022 when the price was about $18. Since then, T has delivered a total return of ~17%. While in contrast, the S&P 500 has lost almost 7%. Last, we covered both the tickers in Nov 2022.
Seeking Alpha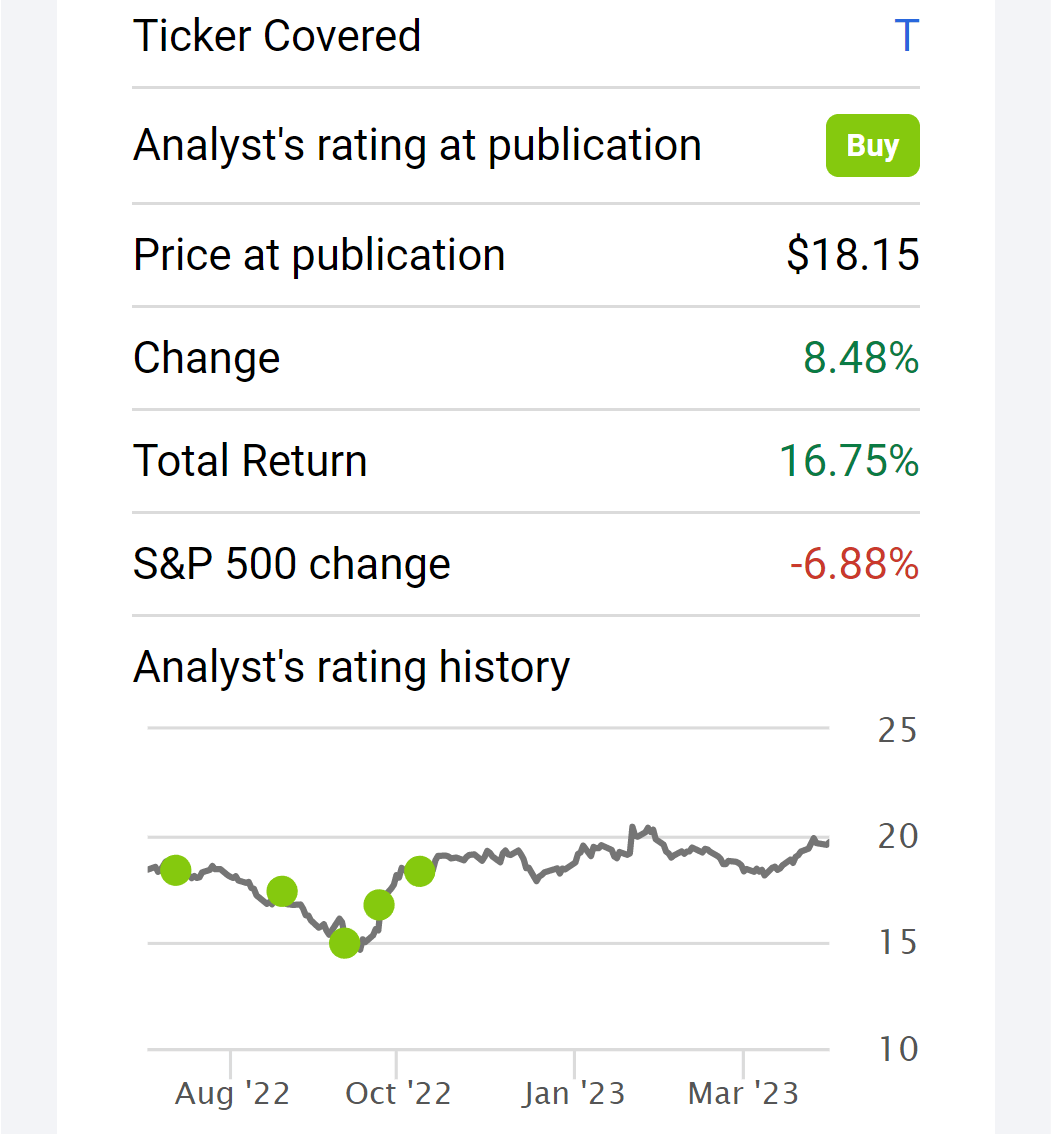
However, recent developments have led us to reevaluate our thesis. And in the remainder of this article, we will explain why we remain bullish on VZ stock but have changed our thesis to "hold" on T. The main considerations are summarized below and will be elaborated on immediately next.
- The price advancements have made the valuation of T less attractive. The margin of safety in T is now much narrower compared to those when we were bullish on it. Now T trades at about the same valuation as VZ (see the next chart below) on traditional metrics like P/E, price/sales, and also leverage-adjusted metrics such EV/Sales and EV/EBITDA. This does not make sense to us as we see T is in a weaker financial position and also a competitive position compared to VZ.
- As a reflection of its weaker position (and also a key consideration for many telecom investors), the safety of T's dividends kept deteriorating. In terms of the dividend cushion ratio, which is the most reliable and comprehensive indicator of dividend safety, is now on the borderline only, much weaker than VZ.
Seeking Alpha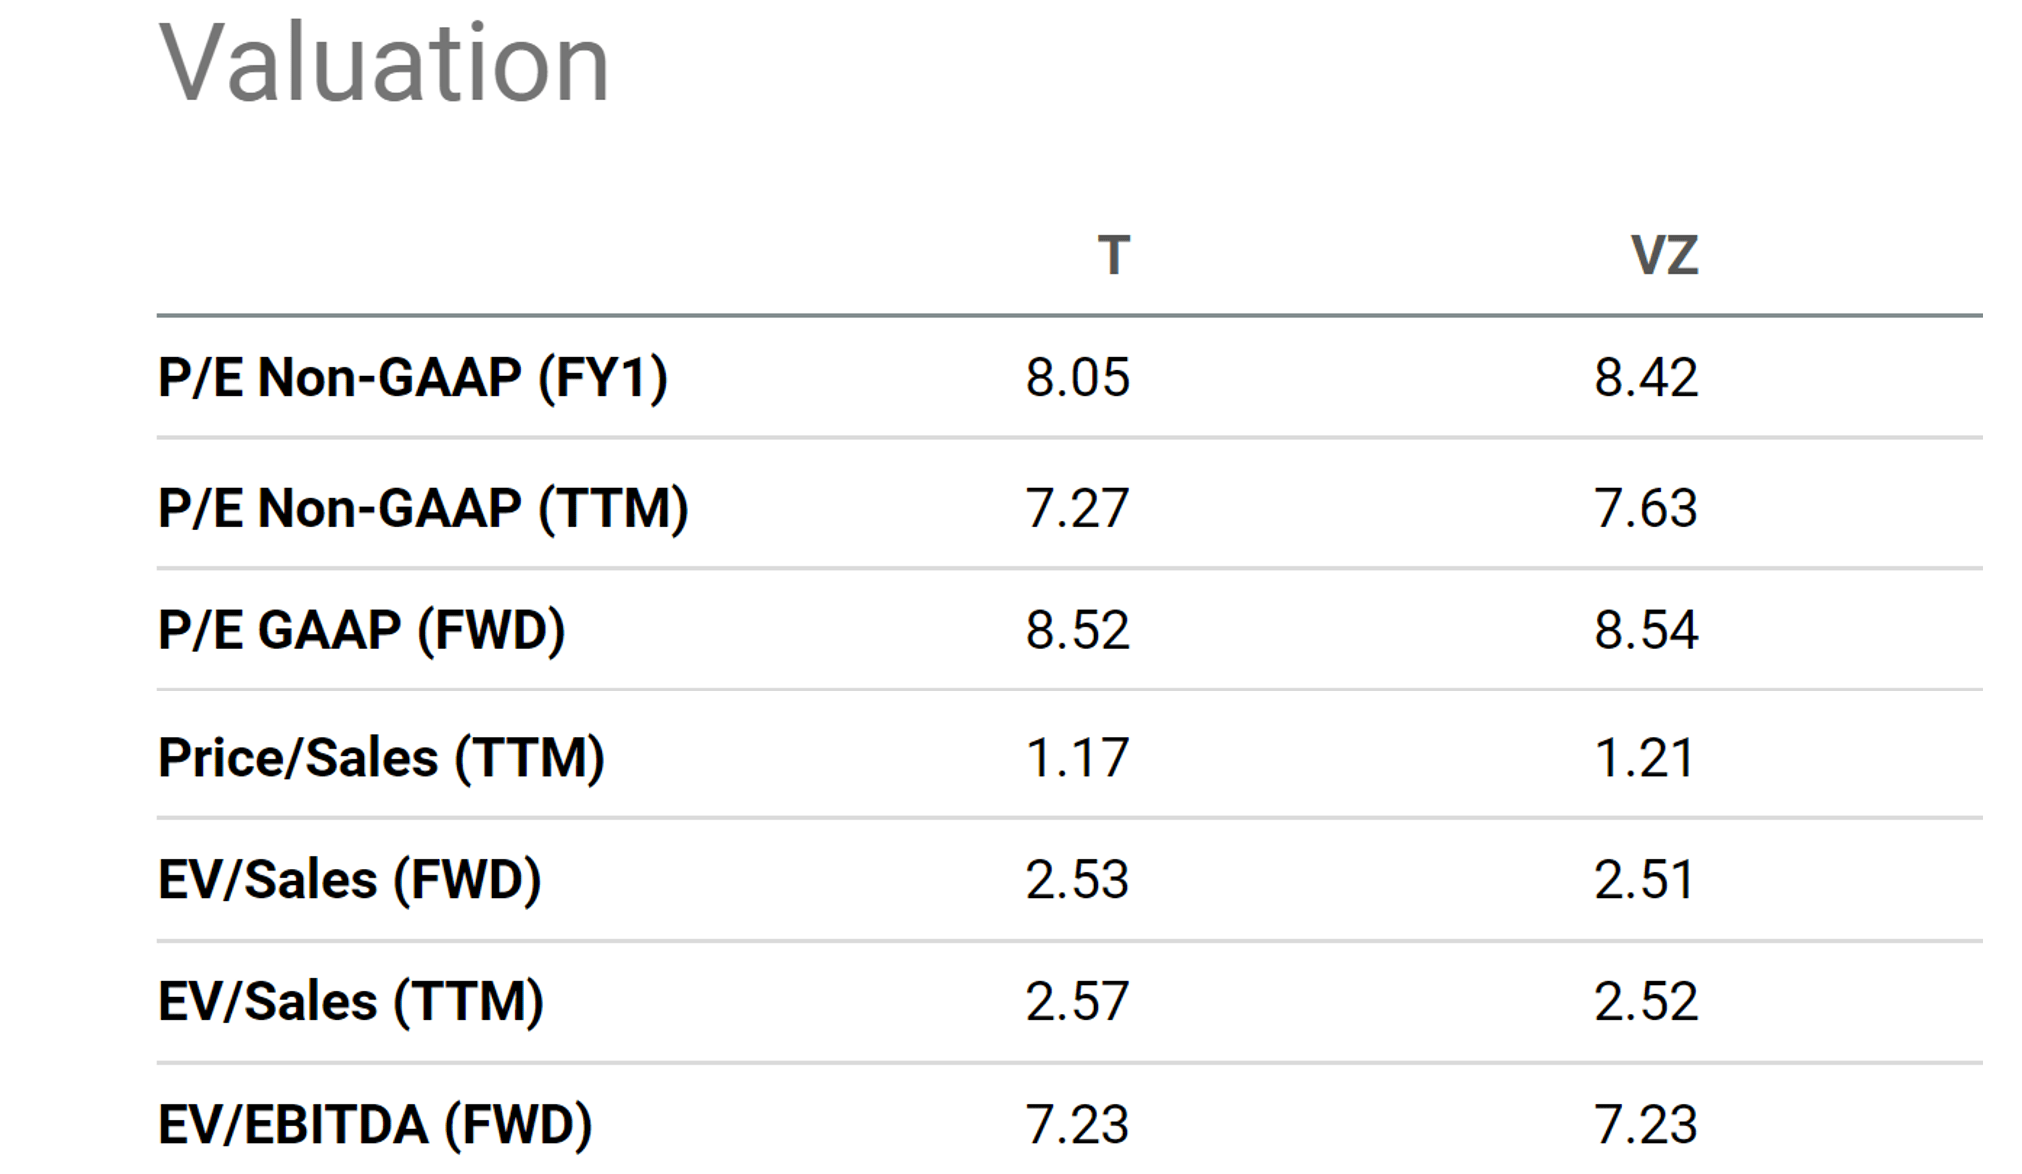
The payout ratios and their limitations
Dividend investors are all familiar with the use of payout ratios to assess the safety of a company's dividend safety. While payout ratios can be a useful tool for assessing the safety of dividends, they have limitations that investors should be aware of. There are many limitations and here we will just focus on the following two, which we think are most relevant to the case of T and VZ.
- Incomplete Picture: Payout ratios typically focus on the dividend payments relative to the company's earnings or cash flows. However, they may not provide a complete picture of a company's financial health or its ability to sustain dividend payments. For example, a company with a low payout ratio may still face challenges if it has high levels of debt, significant capital expenditure requirements, or other financial obligations that could impact its ability to continue paying dividends.
- Accounting Practices: Payout ratios are based on financial metrics, which can be subject to accounting practices and adjustments. Different accounting practices, such as depreciation methods or revenue recognition policies, can impact a company's reported earnings or cash flows, and subsequently, its payout ratios. Investors should carefully review a company's financial statements and accounting policies to understand the potential impact on payout ratios.
Due to these limitations, the common payout ratios (such as earnings payout ratio or cash payout ratio) are of limited use for evaluating the dividend safety of T and VZ as seen. The data is so choppy that they provide no insights at all.
Seeking Alpha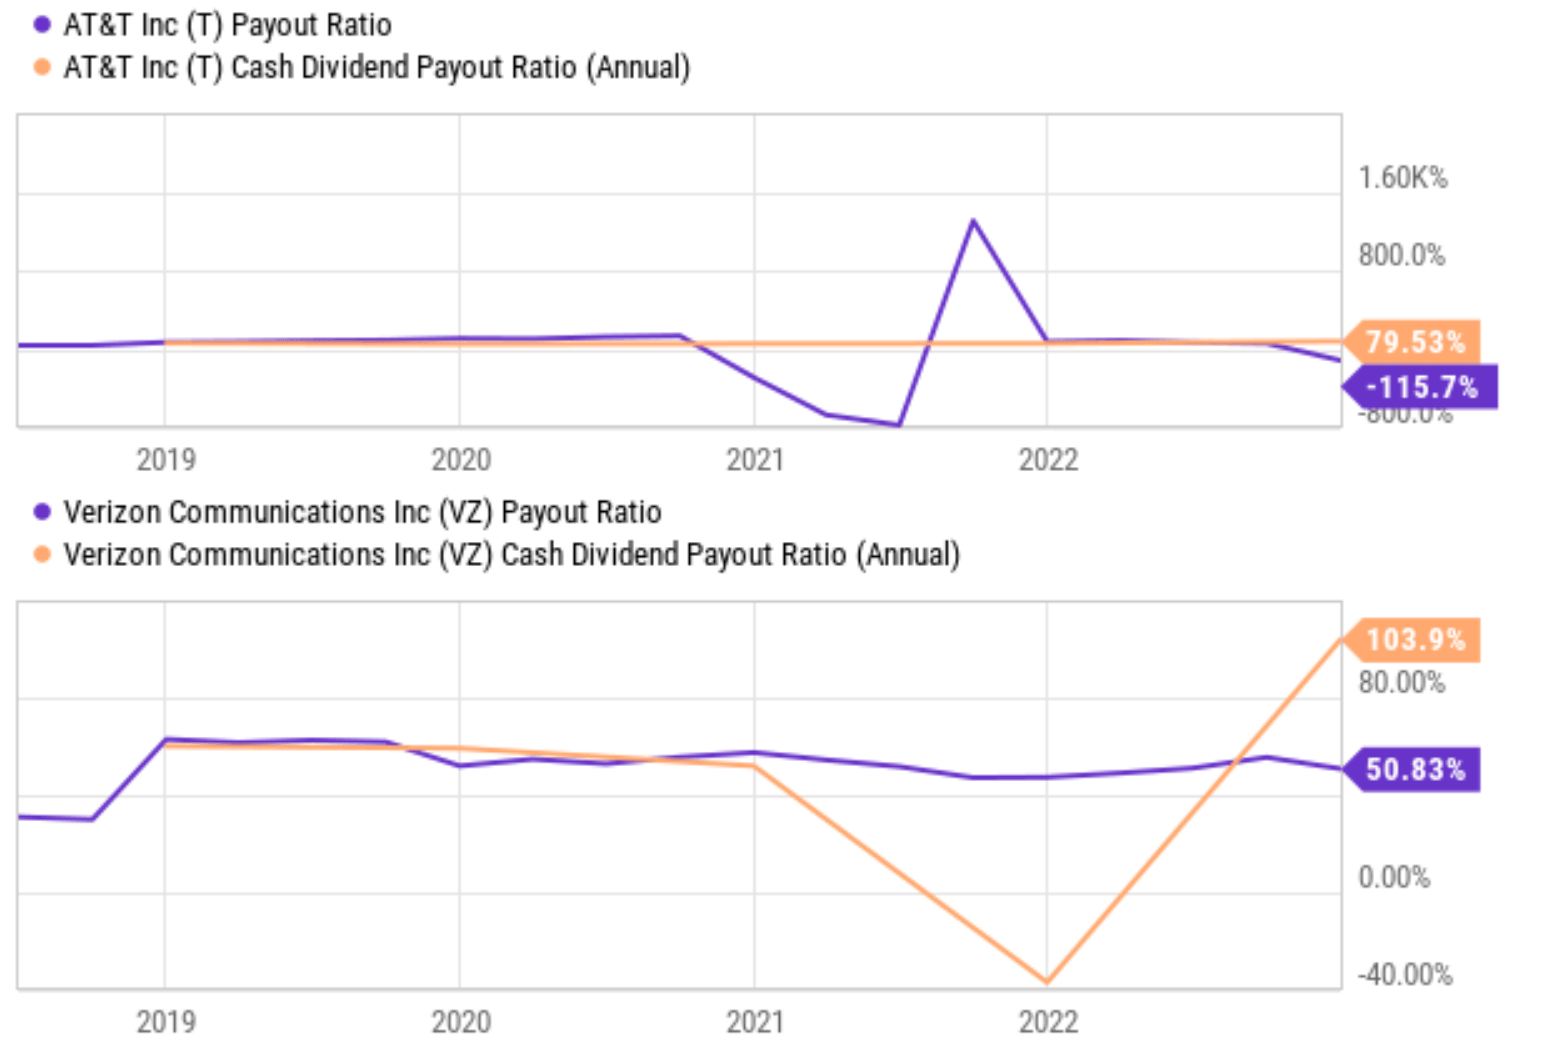
Dividend cushion ratio provides a more comprehensive assessment
The most effective tool, in our view, to overcome the above issues is the dividend cushion ratio ("DCR"). A detailed description of DCR is provided in Brian M Nelson's book entitled Value Trap. And a brief summary is quoted below:
- The DCR is obtained by A) summing the existing net cash a company has on its balance sheet plus its expected future free cash flows over the next five years, and B) dividing that sum by future expected cash dividends (including expected growth in them, where applicable) over the same time period. If the ratio is significantly above 1, the company generally has sufficient financial capacity to pay out its expected future dividends. The higher the ratio, the better, all else equal.
- Please note that we have made one revision to the above method in our analysis in this article to suit the level of leverage for T and VZ. Instead of subtracting total long-term debt, we subtracted total interest expenses incurred over the past five years. This revision is made to account for the common practice of using higher leverage in the telecom space. And also, businesses as mature as T and VZ, it is unlikely that they will ever need to repay all of their debt at once. However, they do need to generate enough earnings to service their debt by covering the interest expenses on an ongoing basis.
With the above background, the next chart shows the DCR for T and VZ since 2016, with recent developments in 2022 highlighted on a quarterly TTM basis.
As observed from these results, both T and VZ have maintained a DCR that has been well above the threshold of 1x in the past. T's average DCR has been 1.58x in recent years, while VZ's average has been even higher at 1.97x. However, due to the challenges (more on this in the next section), T's DCR has been on a path of rapid decline. To wit, its DCR has deteriorated from about 1.97x at the end of 2021 to the current level of 1.14x, not only substantially below its historical average of 1.58x but also close to the borderline of 1x.
In contrast, VZ's cushion ratio has been largely stable and remains far above the danger level. As seen, its DCR has also declined over the past year, but the decline is much milder, from about 2.02x at the end of 2021 to the current level of 1.84x, still far above the threshold of 1x.
Author based on Seeking Alpha data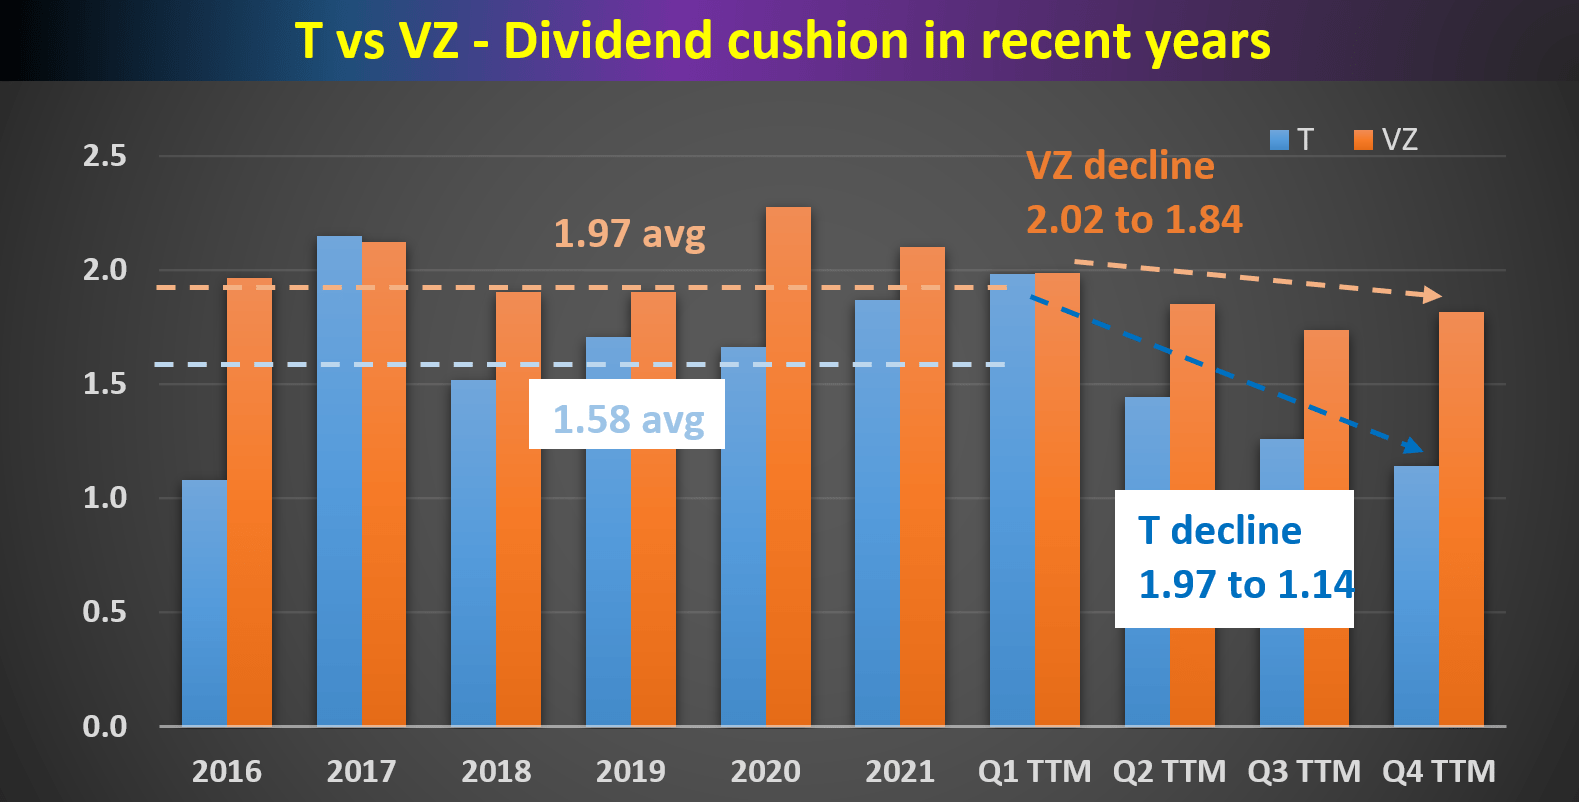
Risks and final thoughts
As two of the most popular tickers on Seeking Alpha, most of the risks associated with both stocks have been thoroughly discussed by other SA authors. As such, here we will focus on the risks more specific to the particular comparisons that we have presented above. As mentioned earlier, the key consideration for us to downgrade our thesis on T is that we do not think T should be trading at the same valuation multiples as VZ due to VZ's strong financial position, safer dividend, and also better competitive advantage. However, there is counterevidence to our arguments. For example, in terms of the most important profitability metric, return on capital employed ("ROCE"), both firms are equally profitable as shown in the chart below. Both T and VZ have been maintaining a consistent and also healthy ROCE of about 30%.
Author based on Seeking Alpha data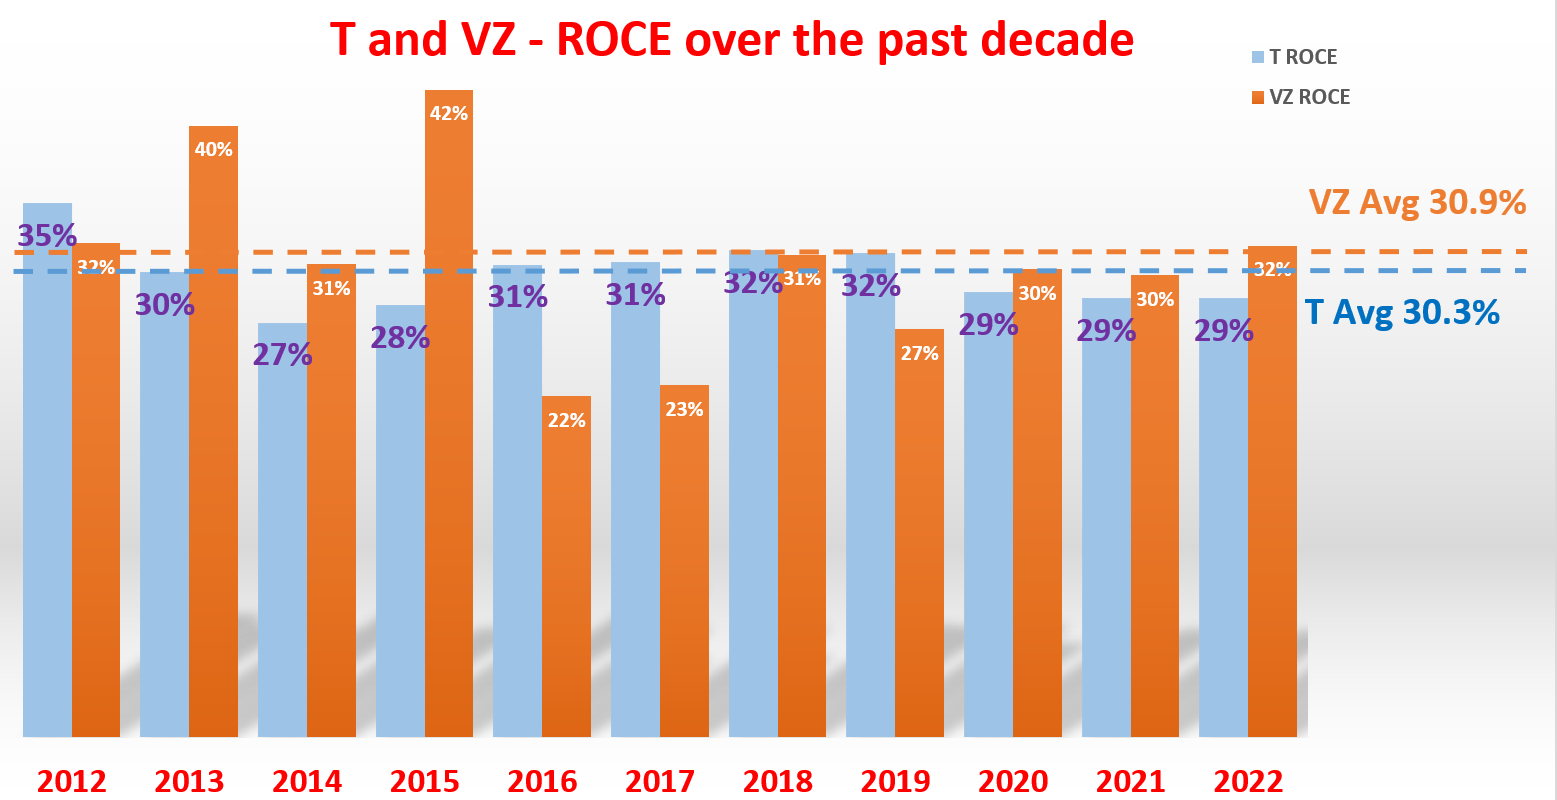
Despite the almost identify ROCE, T's growth could be throttled due to its financial burdens. As mentioned above already, its dividend represents a larger piece of its overall financial pie. And you can also see its interest coverage (about 0.5x only) is much lower than VZ (more than 9x). As such, going forward, I expected VZ to have better capital allocation flexibility and maintain a higher reinvestment rate in the competition ahead.
Seeking Alpha data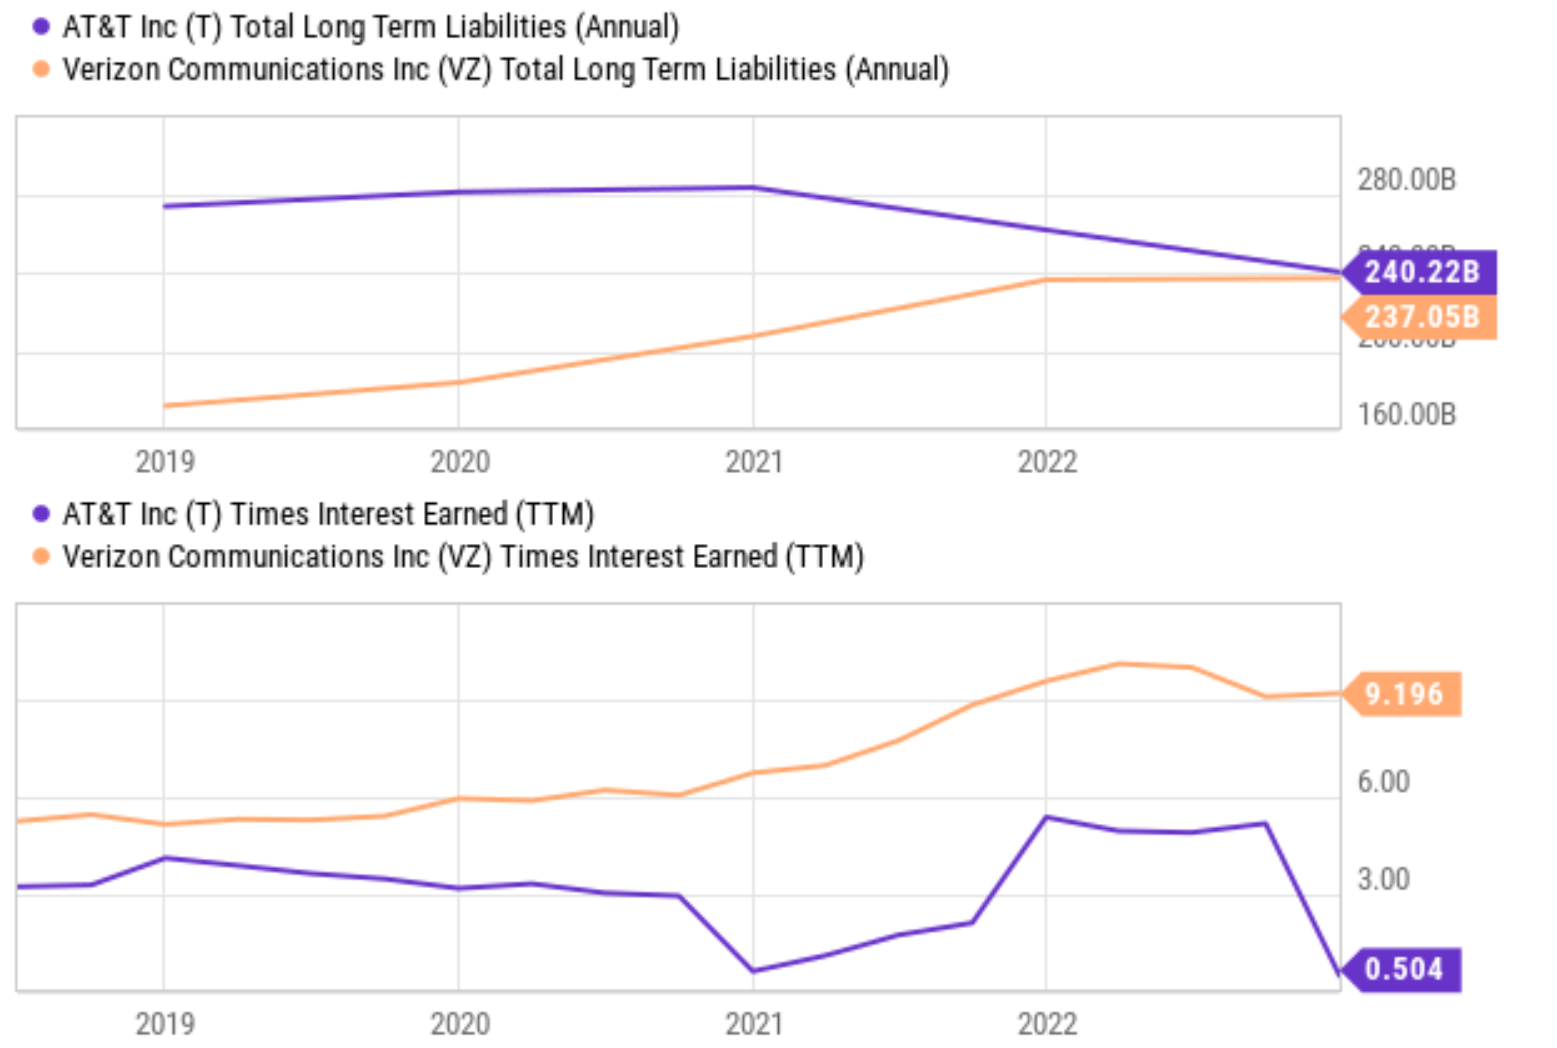
To conclude, recent developments have led us to reevaluate T and VZ. And our conclusion is to remain bullish on VZ but to downgrade T to "hold". To us, T's price advancements since we first published our bull thesis have substantially shrunken the margin of safety. At the same time, its dividend safety has deteriorated significantly and is now on the borderline only. While in contrast, VZ still maintained a very safe dividend cushion ratio and is expected to maintain higher reinvest rates (and hence growth rates too) going forward. As such, existing investors might want to take advantage of T's price advancements and consider trimming their T position. And potential investors interested in the telecom space should take a closer look at VZ.
Join Envision Early Retirement to navigate such a turbulent market.
- Receive our best ideas, actionable and unambiguous, across multiple assets.
- Access our real-money portfolios, trade alerts, and transparent performance reporting.
- Use our proprietary allocation strategies to isolate and control risks.
We have helped our members beat S&P 500 with LOWER drawdowns despite the extreme volatilities in both the equity AND bond market.
Join for a 100% Risk-Free trial and see if our proven method can help you too. You do not need to pay for the costly lessons from the market itself.

This article was written by

** Disclosure** I am associated with Envision Research
I am an economist by training, with a focus on financial economics. After I completed my PhD, I have been professionally working as a quantitative modeler, with a focus on the mortgage market, commercial market, and the banking industry for more than a decade. And at the same time, I have been managing several investment accounts for my family for the past 15 years, going through two market crashes and an incredible long bull market in between.
My writing interests are mostly asset allocation and ETFs, particularly those related to the overall market, bonds, banking and financial sectors, and housing markets. I have been a long time SA reader, and am excited to become a more active participator in this wonderful community!
Analyst’s Disclosure: I/we have a beneficial long position in the shares of VZ either through stock ownership, options, or other derivatives. I wrote this article myself, and it expresses my own opinions. I am not receiving compensation for it (other than from Seeking Alpha). I have no business relationship with any company whose stock is mentioned in this article.
Seeking Alpha's Disclosure: Past performance is no guarantee of future results. No recommendation or advice is being given as to whether any investment is suitable for a particular investor. Any views or opinions expressed above may not reflect those of Seeking Alpha as a whole. Seeking Alpha is not a licensed securities dealer, broker or US investment adviser or investment bank. Our analysts are third party authors that include both professional investors and individual investors who may not be licensed or certified by any institute or regulatory body.