DLN Beats The S&P 500 In Value And Quality, Not In Performance

Summary
- DLN is a dividend-oriented ETF invested in U.S. large cap companies.
- The portfolio is well-diversified across sectors and holdings.
- It beats the S&P 500 in valuation and quality metrics.
- However, total return and dividend growth are behind the benchmark.
- Quantitative Risk & Value members get exclusive access to our real-world portfolio. See all our investments here »
deepblue4you/iStock via Getty Images
This article series aims at evaluating ETFs regarding the relative past performance of their strategies and quality metrics of their current portfolios. Holdings and their weights change over time, so reviews are updated from time to time.
DLN strategy and portfolio
WisdomTree U.S. LargeCap Dividend Fund (NYSEARCA:DLN) has been tracking the WisdomTree U.S. LargeCap Dividend Index since 06/16/2006. As of writing, DLN has 300 holdings, a 12-month distribution yield of 2.64% and an expense ratio of 0.28%. Distributions are paid monthly.
As described by WisdomTree, the index is constituted of the 300 largest companies ranked by market capitalization from the WisdomTree U.S. Dividend Index. Weights are calculated...
...annually to reflect the proportionate share of the aggregate cash dividends each component company is projected to pay in the coming year, based on the most recently declared dividend per share.
It means constituents are weighted based on paid dividends, not yields. This results in overweighting mega-cap companies.
The fund invests only in U.S. companies, with 84% of asset value in large caps and the rest in mid-caps. It is better diversified across sector than the S&P 500 (SPY). No sector weighs more than 17% of asset value, whereas information technology represents 26% of the large cap benchmark.
The top four sectors are quite balanced: healthcare (16.7%), technology (16.6%), financials (13.4%) and consumer staples (13.1%). Compared to the S&P 500, DLN significantly overweights consumer staples, energy, utilities and real estate. It underweights technology, consumer discretionary, communication and materials.
Sector breakdown (chart: author; data: WisdomTree, SSGA)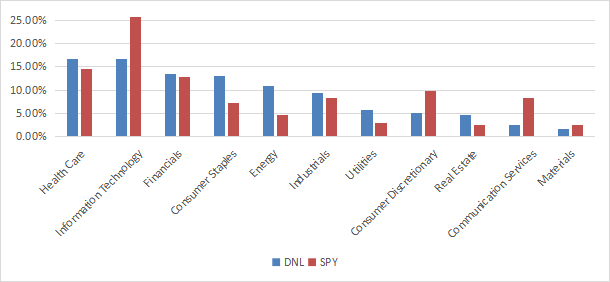
The top 10 holdings, listed below with fundamental ratios, represent 26% of asset value. None of them weighs more than 4%, so risks related to individual companies are moderate.
Ticker | Name | Weight | EPS growth %ttm | P/E ttm | P/E fwd | Yield% |
Apple, Inc. | 3.95% | -2.28 | 27.53 | 27.19 | 0.57 | |
Exxon Mobil Corp. | 3.93% | 146.43 | 8.62 | 11.04 | 3.18 | |
Microsoft Corp. | 3.84% | -4.31 | 32.18 | 31.07 | 0.94 | |
Chevron Corp. | 2.56% | 124.46 | 9.22 | 11.41 | 3.59 | |
AbbVie, Inc. | 2.52% | 2.82 | 24.32 | 14.57 | 3.67 | |
JPMorgan Chase & Co. | 1.87% | -21.22 | 10.58 | 10.00 | 3.13 | |
Merck & Co., Inc. | 1.85% | 11.08 | 19.71 | 16.27 | 2.59 | |
The Coca-Cola Co. | 1.84% | -2.59 | 28.59 | 24.14 | 2.94 | |
Pfizer Inc. | 1.81% | 42.09 | 7.62 | 11.53 | 3.93 | |
Johnson & Johnson | 1.79% | -13.75 | 24.38 | 15.64 | 2.75 |
Ratios from Portfolio123
Performance
Since inception in June 2006, DLN has underperformed SPY by 1.2 percentage point in annualized return. Volatility is a bit lower than the benchmark, but the maximum drawdown is a bit deeper, as reported in the next table.
Total Return | Annual.Return | Drawdown | Sharpe ratio | Volatility | |
DLN | 277.56% | 8.60% | -58.76% | 0.57 | 14.56% |
SPY | 349.31% | 9.77% | -55.42% | 0.61 | 15.69% |
Data calculated with Portfolio123
The next chart compares the 5-year total return of DLN and 3 popular competitors:
- Schwab U.S. Dividend Equity ETF (SCHD)
- Vanguard Dividend Appreciation Index Fund (VIG)
- SPDR S&P Dividend ETF (SDY)
DLN is slightly ahead of SDY, but behind SCHD and VIG.
DLN vs. Competitors, last 5 years (Seeking Alpha)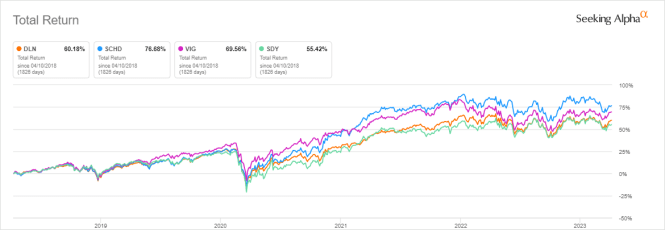
In previous articles, I have shown how three factors may help cut the risk in a dividend portfolio: Return on Assets, Piotroski F-score, and Altman Z-score.
The next table compares DLN with a subset of the S&P 500: stocks with an above-average dividend yield, an above-average ROA, a good Altman Z-score, a good Piotroski F-score and a sustainable payout ratio. The subset is rebalanced annually to make it comparable with a passive index.
Total Return | Annual.Return | Drawdown | Sharpe ratio | Volatility | |
DLN | 288.35% | 8.41% | -57.84% | 0.54 | 14.90% |
Dividend quality subset | 487.45% | 11.12% | -41.97% | 0.69 | 15.39% |
Past performance is not a guarantee of future returns. Data Source: Portfolio123
DLN underperforms this dividend quality subset. However, ETF performance is real and the subset is simulated. My core portfolio holds 14 stocks selected in this subset (more info at the end of this post).
The sum of annual distributions went up from $0.80 per share in 2012 to $1.57 in 2022. It is an increase of 96%, or 6.97% annualized. It is not bad, but DLN lags the benchmark regarding this metric. In the same period, the S&P 500 had an annualized dividend growth rate of 7.38%.
DLN distributions since 2012 (Seeking Alpha)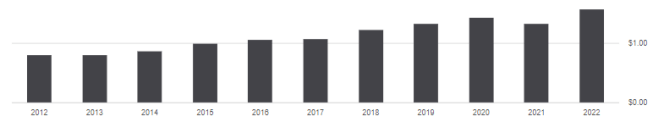
Scanning DLN portfolio
The WisdomTree fund is cheaper than SPY regarding the usual valuation ratios reported in the next table.
DLN | SPY | |
Price/Earnings TTM | 16.43 | 20.62 |
Price/Book | 3.07 | 3.78 |
Price/Sales | 2 | 2.39 |
Price/Cash Flow | 12.12 | 15.41 |
Data: Fidelity
I have scanned DLN holdings with the quality metrics described in the previous paragraph. I consider that risky stocks are companies with at least 2 red flags among: bad Piotroski score, negative ROA, unsustainable payout ratio, bad or dubious Altman Z-score, excluding financials and real estate where these metrics are unreliable. With these assumptions, 21 holdings out of 300 are risky and they weigh only 6.4% of asset value, which is a good point.
Based on my calculation, the aggregate return on assets is superior to SPY’s value. Altman Z-score and Piotroski F-score are not significantly different. These metrics point to a portfolio quality slightly superior to the S&P 500.
DLN | SPY | |
Altman Z-score | 3.91 | 3.42 |
Piotroski F-score | 5.92 | 5.58 |
ROA % TTM | 10.17 | 7.61 |
Takeaway
DLN tracks an index of 300 U.S. stocks weighted on paid dividends. It is well-diversified across several sectors. Healthcare, technology, financials and consumer staples are the heaviest ones, and they weigh almost 60% of asset value in aggregate. The fund looks better than the S&P 500 index regarding valuation and quality metrics. It has underperformed the large cap benchmark in total return since inception, and in dividend growth in the last 10 years. However, its quality and value characteristics may become an advantage in a bear market.
Quantitative Risk & Value (QRV) features data-driven strategies in stocks and closed-end funds outperforming their benchmarks since inception. Get started with a two-week free trial now.

This article was written by

Step up your investing experience: try Quantitative Risk & Value for free now (limited offer).
I am an individual investor and an IT professional, not a finance professional. My writings are data analysis and opinions, not investment advice. They may contain inaccurate information, despite all the effort I put in them. Readers are responsible for all consequences of using information included in my work, and are encouraged to do their own research from various sources.
Analyst’s Disclosure: I/we have a beneficial long position in the shares of KO, PFE either through stock ownership, options, or other derivatives. I wrote this article myself, and it expresses my own opinions. I am not receiving compensation for it (other than from Seeking Alpha). I have no business relationship with any company whose stock is mentioned in this article.
Seeking Alpha's Disclosure: Past performance is no guarantee of future results. No recommendation or advice is being given as to whether any investment is suitable for a particular investor. Any views or opinions expressed above may not reflect those of Seeking Alpha as a whole. Seeking Alpha is not a licensed securities dealer, broker or US investment adviser or investment bank. Our analysts are third party authors that include both professional investors and individual investors who may not be licensed or certified by any institute or regulatory body.