DTD: Why Dividend Investors Should Replace It With SCHD And VIG

Summary
- DTD is WisdomTree's Total Market U.S. Dividend ETF. It's well-diversified with 800+ holdings and yields 2.82% with a 0.28% expense ratio.
- Historical performance is solid, but combining SCHD and VIG is a better choice. Lower fees mean higher distributions, and other key metrics, like earnings growth and valuation, are virtually identical.
- SCHD and VIG are also higher-quality funds. My fundamental analysis reveals how current selections have delivered superior dividend growth over the last five years, so this approach is a win-win.
- Given this alternative and how investors often use multiple ETFs to achieve their investment objectives anyway, I rate DTD a hold.
- Looking for a portfolio of ideas like this one? Members of Hoya Capital Income Builder get exclusive access to our subscriber-only portfolios. Learn More »
Richard Drury
Investment Thesis
The WisdomTree U.S. Total Dividend ETF (NYSEARCA:DTD) is a solid but ultimately unnecessary fund for dividend investors. The reason is that holding two cheaper ETFs in equal weight delivers the same gross dividend yield but provides investors with a higher-quality portfolio likely to generate higher dividend growth. The two funds I'm referring to are the Schwab U.S. Dividend Equity ETF (SCHD) and the Vanguard Dividend Appreciation ETF (VIG), and I'm confident that after evaluating historical performance and the latest fundamentals of these three funds, you'll arrive at the same conclusion.
DTD Overview
Strategy Discussion and Key Exposures
DTD tracks the WisdomTree U.S. Dividend Index, selecting dividend-paying stocks from nearly all the U.S. investable equity market. Constituents are weighted based on total cash dividends expected to be paid over the next year based on the last dividend payment. Reconstitutions occur annually in December, and qualifying securities must meet the following criteria:
- be listed on a U.S. stock exchange
- be incorporated and headquartered in the U.S.
- pay regular cash dividends
- have a minimum $100 million market cap
- have a minimum $100K average daily dollar trading volume
WisdomTree U.S. domestic dividend ETFs like DTD exclude securities that fall in the bottom 10% of a composite risk factor score. This proprietary system evaluates securities for momentum and quality, as described below.
- Quality: return on equity, return on assets, gross profits over assets, and cash flow over assets trends
- Momentum: risk-adjusted six- and twelve-month total returns
These screens eliminate some well-known names like Verizon Communications (VZ), Kinder Morgan (KMI), and Intel (INTC). They are among the 38 excluded dividend-paying stocks in the SPDR S&P 500 ETF (SPY) with a combined 4.71% market-cap-weighting and a 7.82% dividend-dollar-weighting. These securities have a 0.88 weighted average five-year beta and 4.00% indicated dividend yield. Therefore, DTD's defensiveness and yield suffer, and only sometimes for a good reason. A weight-adjusted portfolio highlights the likely explanation for the exclusion was the momentum score based on poor returns last year. However, this same portfolio is outperforming DTD by about 2% YTD.
Portfolio Visualizer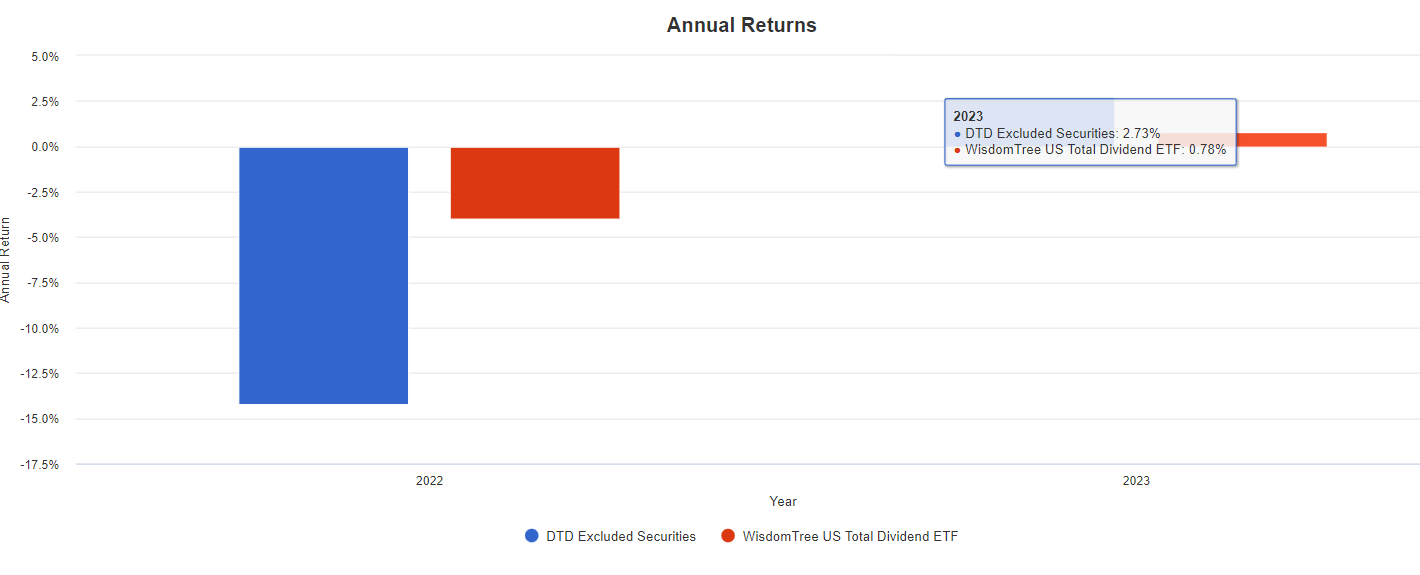
Still, the impact is low because it's a relatively small portion of the total portfolio. For context, DTD holds 800+ securities and probably needs more strict criteria. The top 100 total 68.40% of the portfolio compared to 0.78% for the bottom 100, so there's likely some "diworsification" going on.
DTD's top ten holdings are below, which include Apple (AAPL), Exxon Mobil (XOM), Microsoft (MSFT), and Chevron (CVX). Except for JPMorgan Chase (JPM), the remainders are Health Care and Consumer Staples stocks that lower the portfolio's volatility.
WisdomTree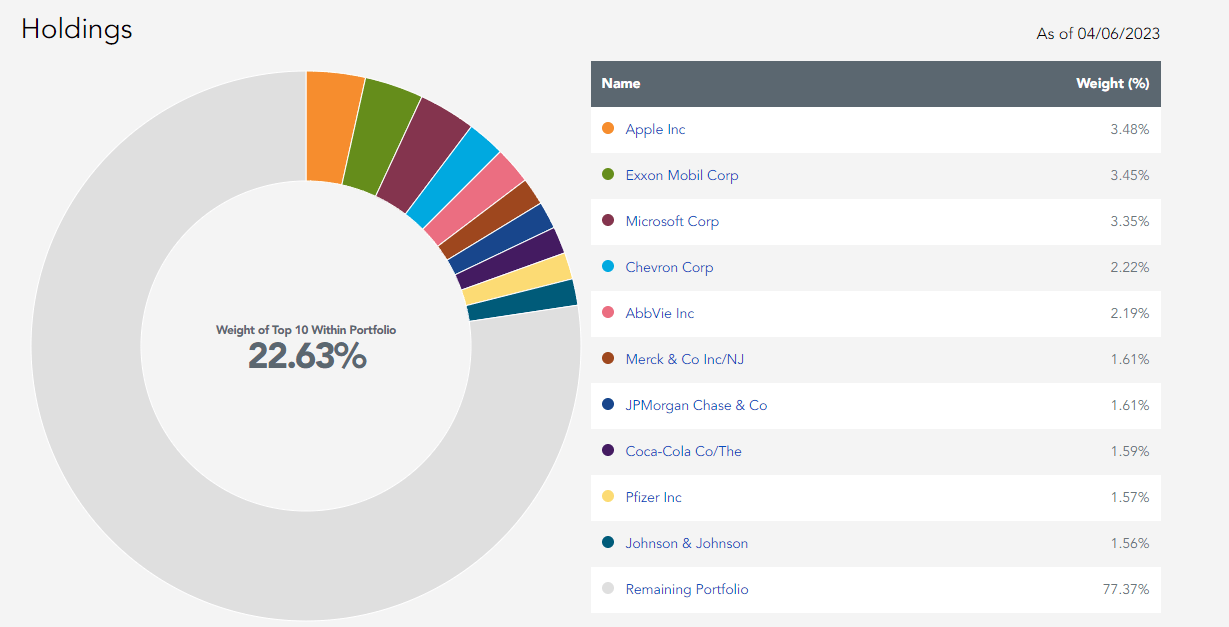
Below are DTD's sector exposures compared with SCHD and VIG. All are similar in Consumer Staples, Financials, and Health Care. However, VIG has higher Technology exposure (24% vs. 15%) than DTD, while SCHD overweights Industrials. Notably, DTD is the only fund to have Real Estate Exposure, approximately 5%.
Morningstar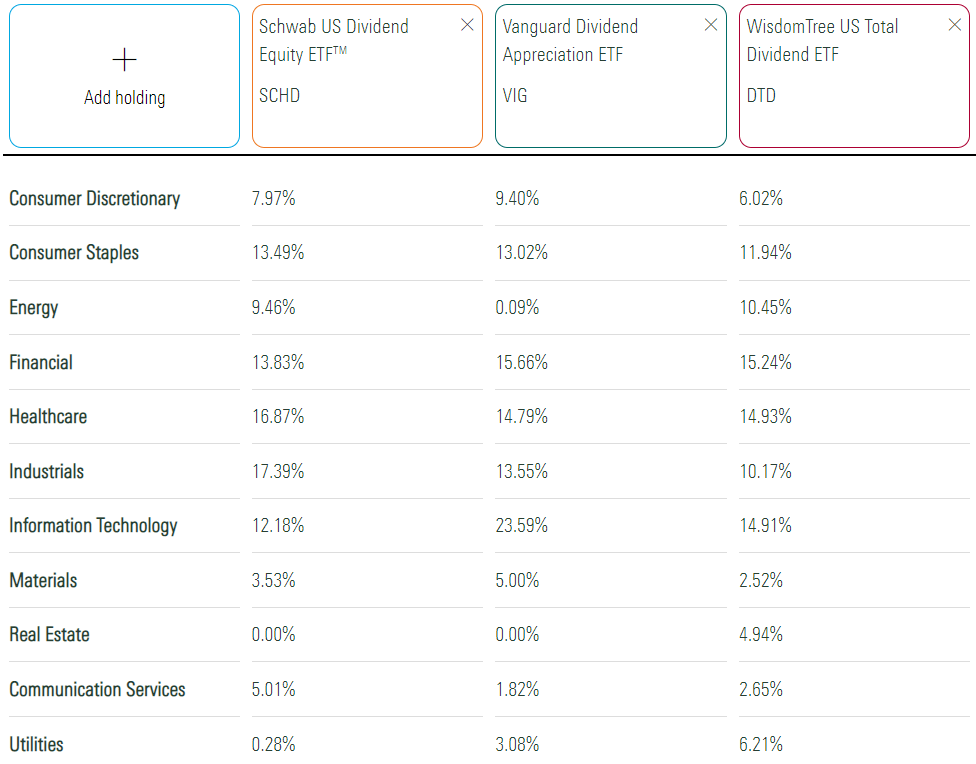
VIG's exposures listed above aren't entirely accurate for two reasons. The first is that its Index was recently reconstituted, with Apple as the key addition. The second is because the exposures are as of February 28, 2023, before the March GICS changes. Notably, Visa (V) and Mastercard (MA) moved from Technology to Financials, and VIG's total Technology exposure is now 21%. However, the figures listed for SCHD and DTD are accurate.
Performance
DTD's returns are close to what its large-cap cutout, the WisdomTree U.S. LargeCap Dividend Fund (DLN), delivered since the ETF's inception in June 2006. Both lagged the SPDR S&P 500 ETF, especially post-pandemic, which was not unusual for value-oriented funds.
Portfolio Visualizer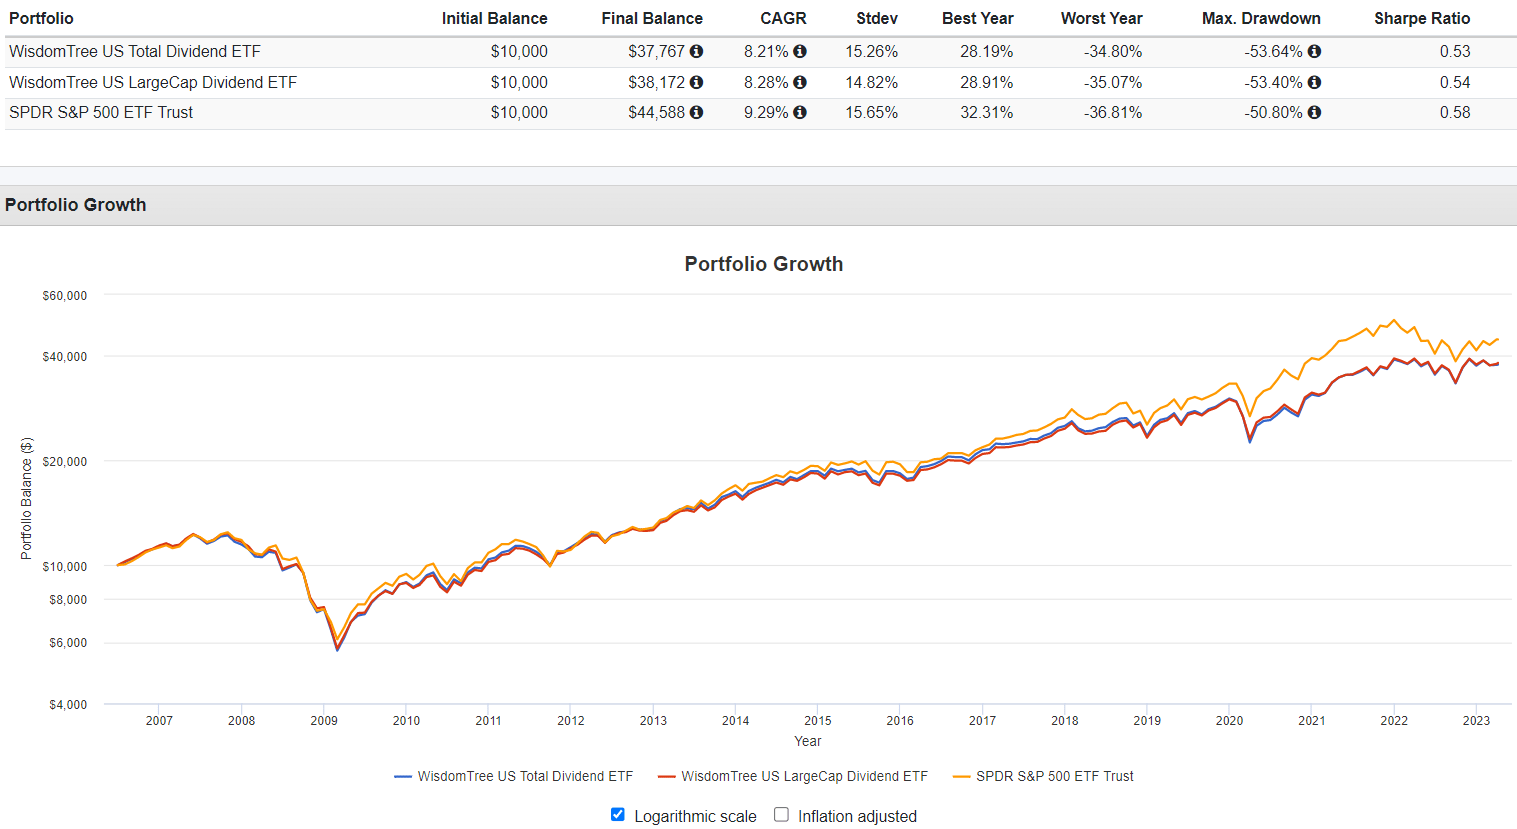
The following table is more comprehensive because it includes historical returns for 34 large and total market dividend ETFs with at least $50 million in assets under management. I've sorted this list by ten-year returns through March 2023 and included each fund's expense ratio and trailing dividend yield.
The Sunday Investor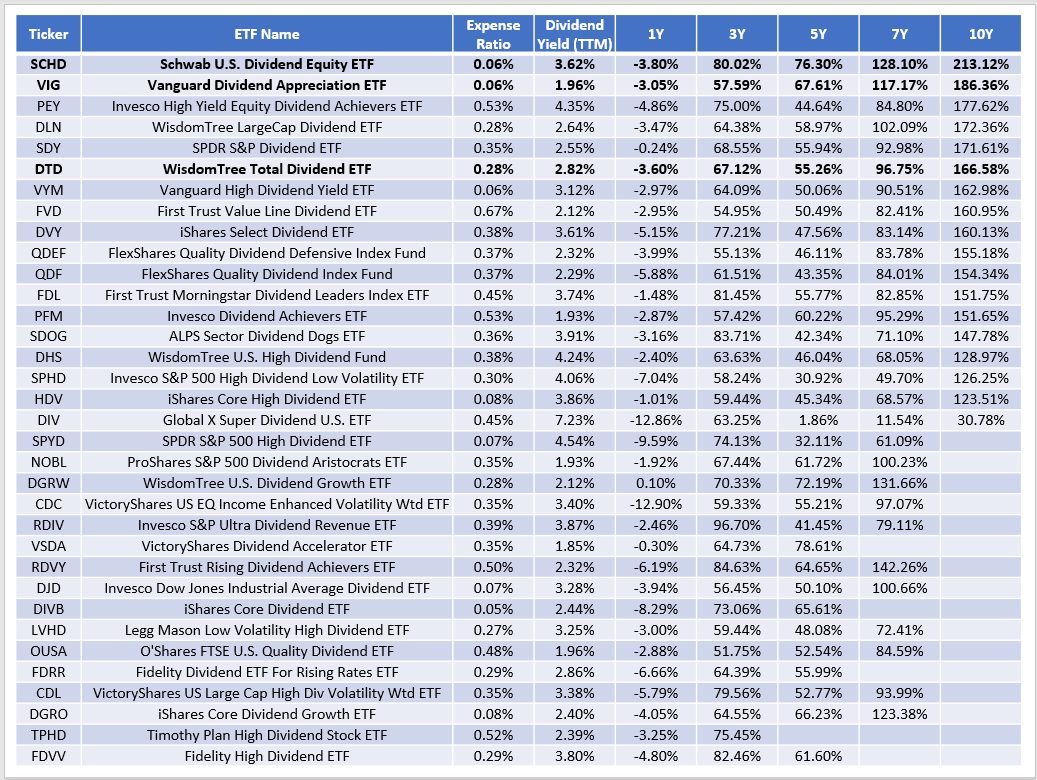
DTD's 166.58% return over the last decade was sixth-best, slightly better than the Vanguard High Dividend Yield ETF (VYM) but well behind SCHD and VIG. Here is how DTD ranks on the metrics listed above:
- Expense Ratio: #10/34
- Dividend Yield: #19/34
- 1Y Total Return: #18/34
- 3Y Total Return: #16/34
- 5Y Total Return: #15/33
- 7Y Total Return: #10/29
- 10Y Total Return: #6/18
These results indicate DTD has a solid, but not optimal, track record. Relative performance used to be better, but it's been just average since the pandemic. It experienced a more significant 25.24% drawdown in Q1 2020 and was slow to recover compared with SCHD and VIG.
Portfolio Visualizer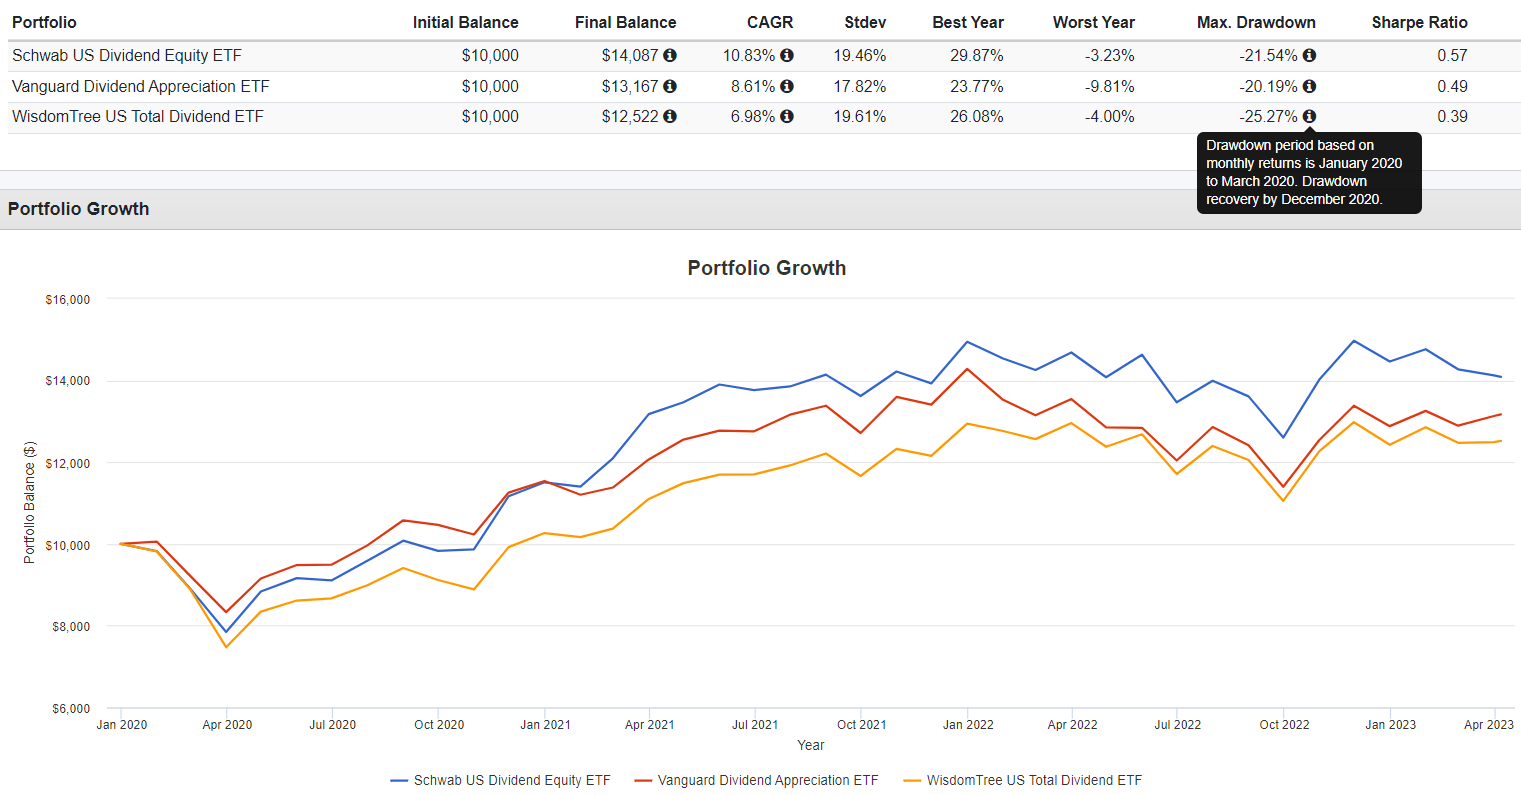
Dividends
Seeking Alpha assigns DTD a solid "A-" Dividend Grade, primarily due to the fund's longevity but also for its above-average 2.82% dividend yield and 8.70% five-year dividend growth rate.
Seeking Alpha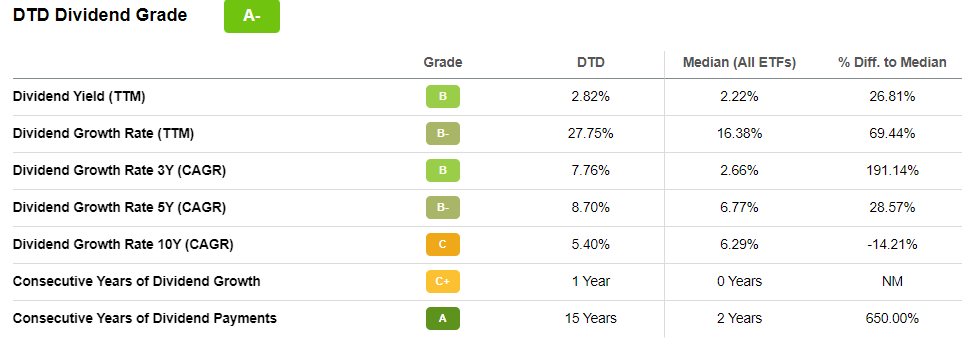
DTD is also a monthly payer, so shareholders can reinvest dividends to boost dividend growth further. The following chart illustrates the annual portfolio income growth from 2017 to 2022 on a $10,000 initial investment with reinvested dividends.
Portfolio Visualizer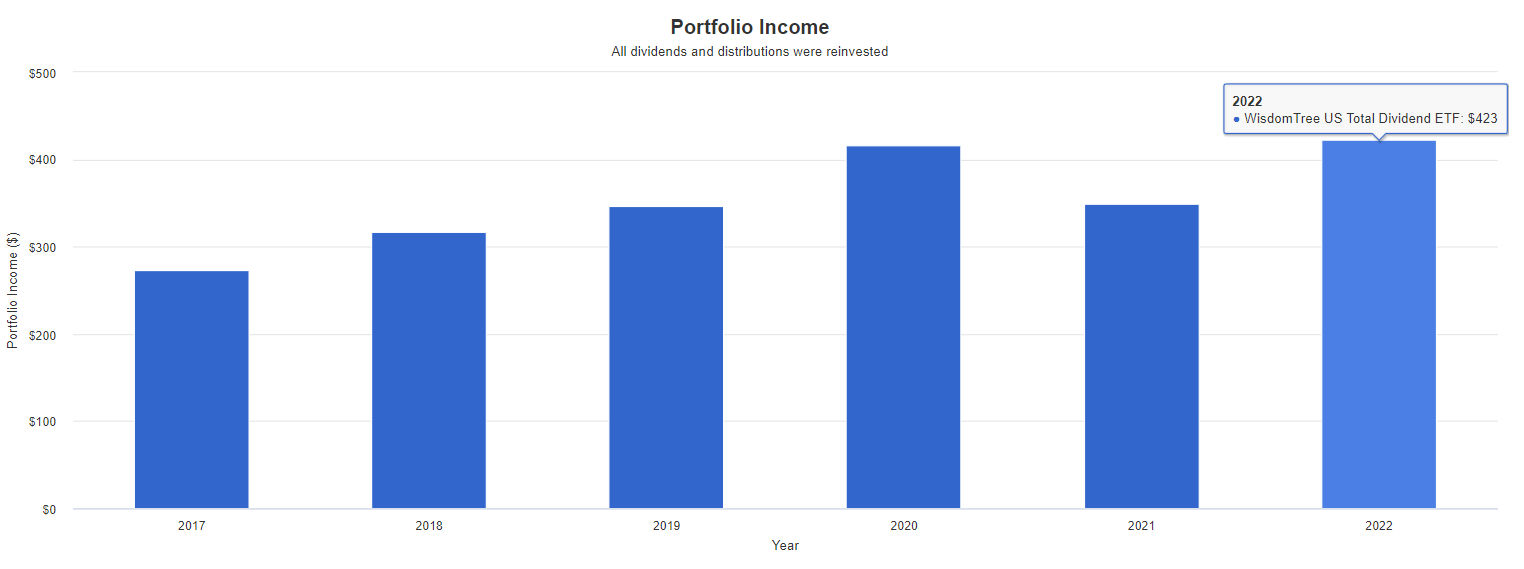
Annual income in 2022 was $423 compared to $274 in 2017, or 9.07% annualized. Without reinvestments, the growth rate declined to 6.27%. However, dividend growth is primarily driven by the dividend growth potential of its underlying holdings. Several times over the last few months, I've written about how investors should no longer expect these rates to continue. Sales and earnings growth estimates are down, and DTD is no different. Let's look at these and other fundamental metrics next.
DTD Analysis
In addition to superior historical performance, a two-fund portfolio consisting of SCHD and VIG makes sense because they net an identical 2.84% gross forward dividend yield. Consider the following summary of DTD's top 25 industries, which total 67% of the fund.
The Sunday Investor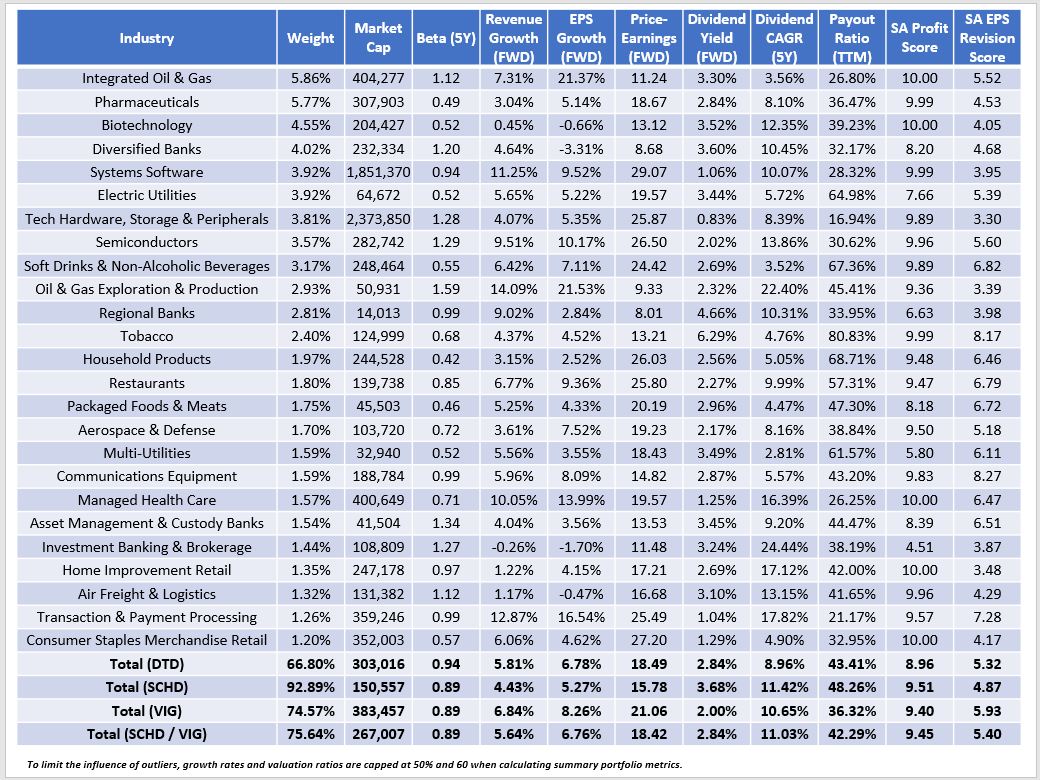
However, the SCHD/VIG portfolio will deliver a higher net yield because of a lower 0.06% annual fee. DTD's 0.28% expense ratio, while still better than average, runs counter to the objectives of high-yield investors. The net yield is just 2.56% compared to 2.78% for the two-ETF portfolio.
SCHD and VIG also have better dividend growth track records. SCHD's five-year dividend growth rate is 15.56%, while VIG's is 9.87%. Current constituents in the two ETFs have 11.42% and 10.65% five-year increases, better than DTD's 8.96%. Unfortunately, neither ETF will continue its amazing track record due to lower estimated earnings growth (6-8%). Still, SCHD and VIG's selections have demonstrated more willingness to increase dividends, leading to superior dividend growth moving forward.
The SCHG/VIG portfolio trades at 18.42x forward earnings, virtually identical to DTD's 18.49x. However, I like the higher quality demonstrated by the 9.45/10 profitability score. This score considers several profitability metrics, including those used by WisdomTree in its composite scoring system. It is an excellent measure of quality and resiliency most applicable to long-term investors. In short, if you can keep this score high and avoid speculating too much, you have a great chance at success. DTD's 8.96/10 score is only about average among peers.
Finally, I've calculated the same fundamental metrics for the SCHD/VIG portfolio's top 25 holdings. The profitability is displayed here, as 24/25 have perfect 10/10 "A+" Seeking Alpha Grades. With the addition of Apple, the $267 billion market cap figure is close to DTD's $303 billion, and the portfolio is less volatile, as indicated by the 0.89 five-year beta.
The Sunday Investor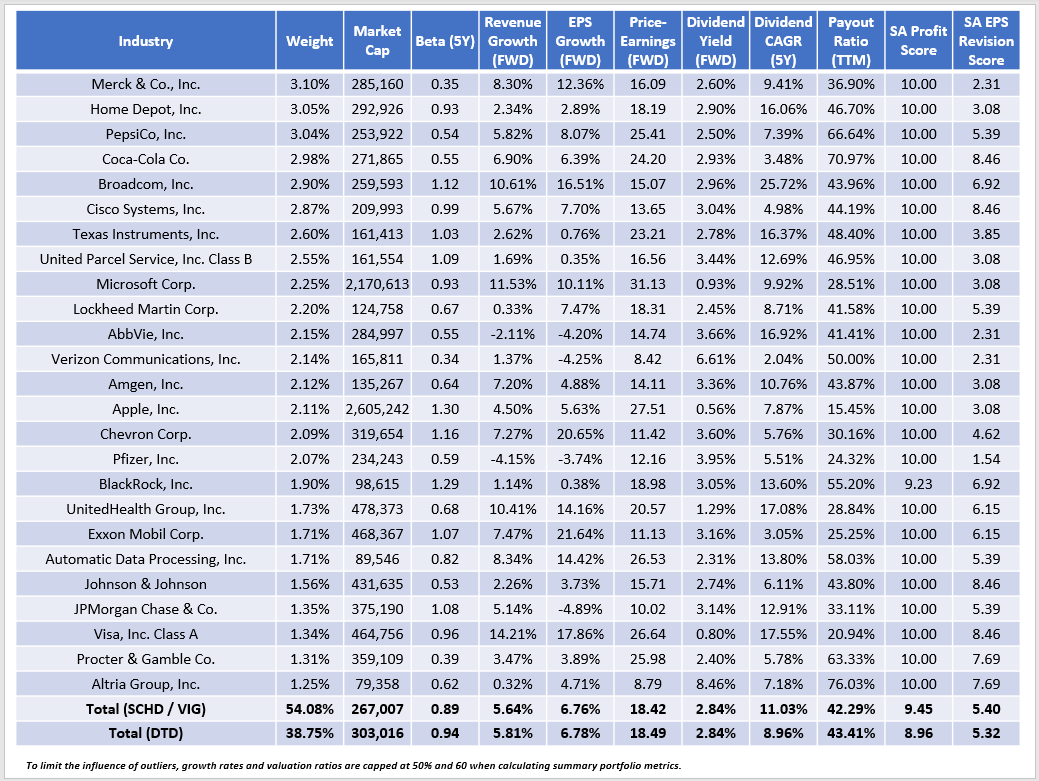
Surprisingly, SCHD's portfolio drags down the 5.40/10 EPS Revision Score. It's one reason I'm in no rush to add more and prefer VIG. However, the equal-weight approach may appeal to investors who give some weight to historical performance. Wall Street may view SCHD's holdings more negatively today, but I'm still comfortable with the long-term strategy.
Investment Recommendation
The WisdomTree U.S. Total Dividend is a solid single-fund solution, but readers should consider combining SCHD and VIG. In exchange for less diversification, distributions will increase because of a lower net expense ratio (0.06% vs. 0.28%). SCHG and VIG's current constituents also have a better dividend growth track record, consistent with what the ETFs themselves delivered. Finally, SCHG and VIG are higher-quality portfolios than DTD when using profitability as a proxy. For that reason, it's a safer long-term approach, so I've decided to limit my rating on DTD to a hold. Thank you for reading, and I look forward to the discussion in the comments section below.
The Sunday Investor Joins Income Builder
The Sunday Investor has teamed up with Hoya Capital to launch the premier income-focused investing service on Seeking Alpha. Members receive complete early access to our articles along with exclusive income-focused model portfolios and a comprehensive suite of tools and models to help build sustainable portfolio income targeting premium dividend yields of up to 10%.
Whether your focus is High Yield or Dividend Growth, we’ve got you covered with actionable investment research focusing on real income-producing asset classes that offer potential diversification, monthly income, capital appreciation, and inflation hedging. Start A Free 2-Week Trial Today!
This article was written by

I perform independent fundamental analysis for over 850 U.S. Equity ETFs and aim to provide you with the most comprehensive ETF coverage on Seeking Alpha. My insights into how ETFs are constructed at the industry level are unique rather than surface-level reviews that’s standard on other investment platforms. My deep-dive articles always include a set of alternative funds, and I am active in the comments section and ready to answer your questions about the ETFs you own or are considering.
My qualifications include a Certificate in Advanced Investment Advice from the Canadian Securities Institute, the completion of all educational requirements for the Chartered Investment Manager (CIM) designation, and a Bachelor of Commerce degree with a major in Accounting. In addition, I passed the CFA Level 1 Exam and am on track to become licensed to advise on options and derivatives in 2023. In November 2021, I became a contributor for the Hoya Capital Income Builder Marketplace Service and manage the "Active Equity ETF Model Portfolio", which as a total return objective. Sign up for a free trial today! Hoya Capital Income Builder.
Analyst’s Disclosure: I/we have a beneficial long position in the shares of SPY, SCHD, VIG, MSFT either through stock ownership, options, or other derivatives. I wrote this article myself, and it expresses my own opinions. I am not receiving compensation for it (other than from Seeking Alpha). I have no business relationship with any company whose stock is mentioned in this article.
Seeking Alpha's Disclosure: Past performance is no guarantee of future results. No recommendation or advice is being given as to whether any investment is suitable for a particular investor. Any views or opinions expressed above may not reflect those of Seeking Alpha as a whole. Seeking Alpha is not a licensed securities dealer, broker or US investment adviser or investment bank. Our analysts are third party authors that include both professional investors and individual investors who may not be licensed or certified by any institute or regulatory body.