9% Yield Could Reach 15%

Summary
- Big income here. As floating rates come online, we could see some significant dividend increases.
- If rates remain as high as they are today, the yield could hit 15%.
- I’m expecting short-term rates to dip, but this could still easily be offering a double-digit dividend yield.
- The REIT Forum members get exclusive access to our real-world portfolio. See all our investments here »
alexsl/iStock via Getty Images
Get ready for charts, images, and tables because they are better than words. The ratings and outlooks we highlight here come after Scott Kennedy's weekly updates in the REIT Forum. Your continued feedback is greatly appreciated, so please leave a comment with suggestions.
I have three things to share with readers today. One is our magnificent charts (which come after the analysis). The next is our gratitude for your support. The third is a look at the preferred shares from MFA Financial (MFA).
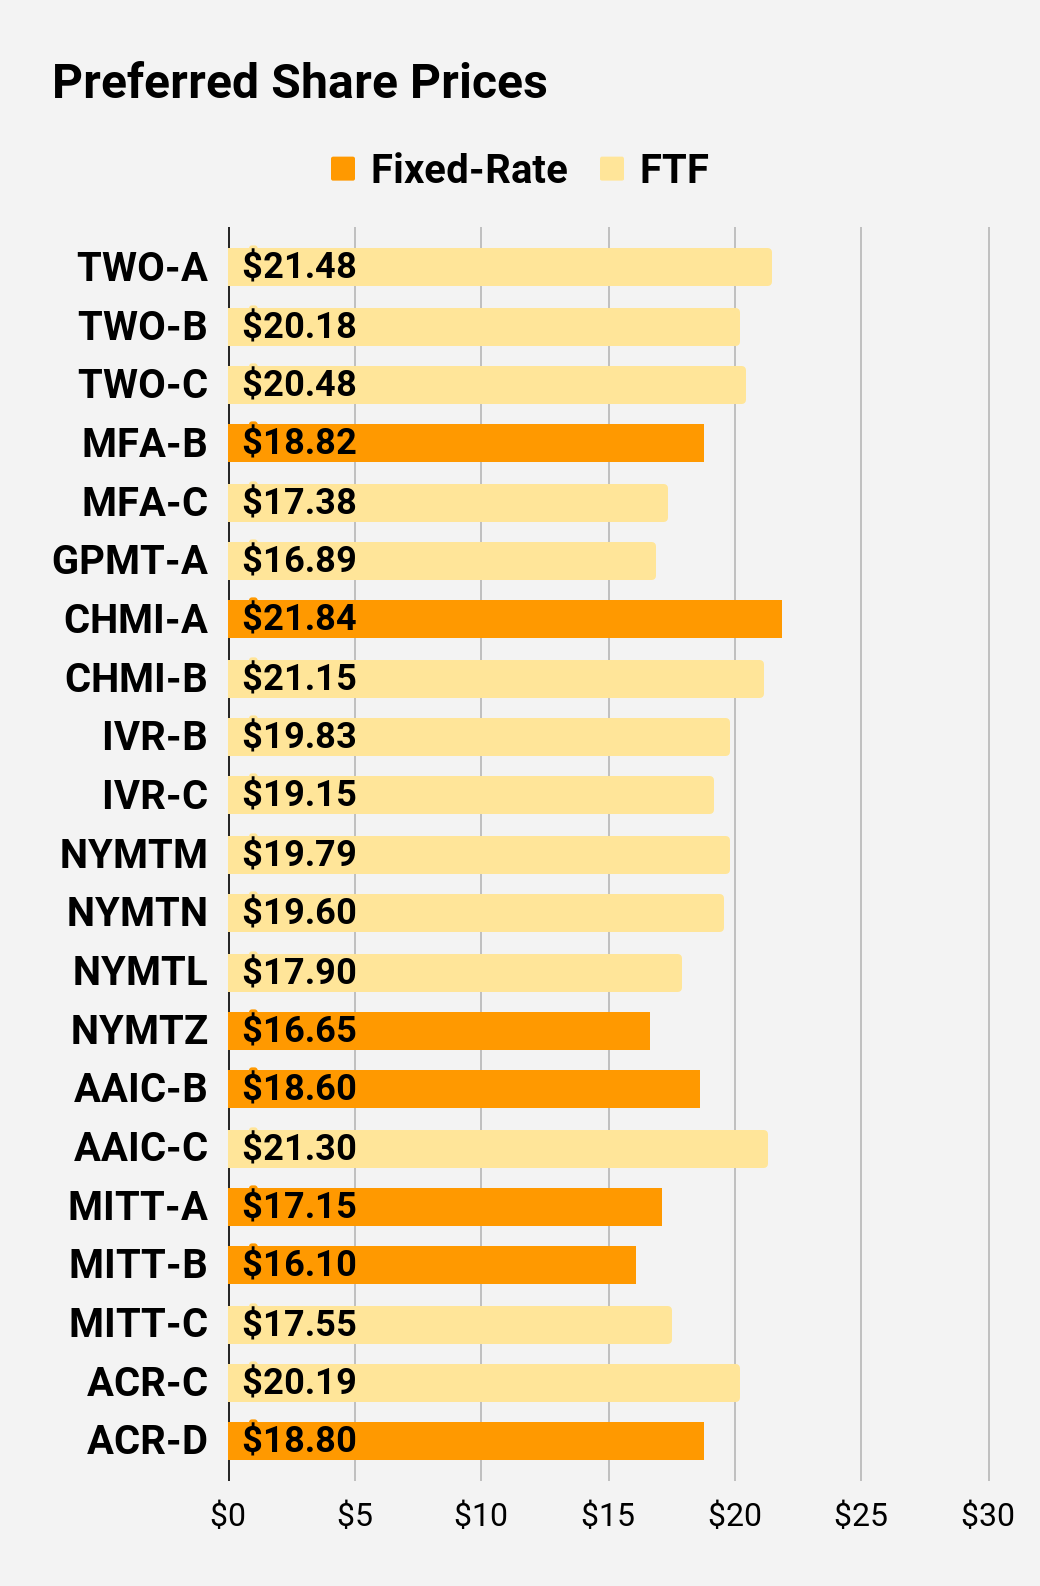
There are just two preferred shares: MFA-B (MFA.PB) and MFA-C (MFA.PC).
I've been arguing for a while that there is still too much fear about inflation. The market has been catching on to that idea lately and we've seen a material decline in Treasury yields longer than a few months.
However, I think MFA-C's eventual floating rate is a superior deal here. MFA-C starts floating on 3/31/2025. When it does float, the 6.5% fixed-rate coupon will be replaced by the market's three-month rate plus a spread of 5.345%. By contrast, MFA-B has a fixed-rate dividend at 7.5%.
So what makes MFA-C superior?
MFA-B costs $18.82 and MFA-C cost $17.38. The investor in MFA-C can buy 8.2854% more shares for the same investment. That is a material difference.
Future Scenarios
MFA-C will have the same dividend rate as MFA-B when MFA-C is floating if short-term rates are stuck at precisely 2.15%. That is because 2.15% + 5.35% = 7.5%. Short term rates probably won't land at exactly 2.15%. If short-term rates are above 2.15%, MFA-C would have a bigger dividend per share than MFA-B. If short-term rates are below 2.15%, MFA-C would have a lower dividend per share than MFA-B.
However, as we identified previously, an investor in MFA-C gets 8.2854% more shares for the same amount of dollars based on $18.82 for MFA-B and $17.38 for MFA-C.
Since MFA-B's dividend is $1.875 per share per year (paid quarterly), with 8.2854% more shares the investor in MFA-C only needs $1.731525 per share annually to have the same total income.
That only requires a short-term rate of 1.58%. If rates are above 1.58%, MFA-C is winning because of the extra shares.
When it comes to the upside, MFA-C wins by having a lower share price. I think a call is quite unlikely, but it would present a substantial upside.
Dividend Comparison
At the moment, MFA-C still has a fixed-rate dividend of 6.5% (on $25). That leads to a stripped yield of 9.44%, which is lower than MFA-B's stripped yield of 10.07%. However, that gap is only relevant for the next two years and pales in comparison to the value of having additional shares.
If MFA-C was floating today, the stripped yield would be around 15.27%. That's an absolutely massive yield. If investors believe the Federal Reserve will not cut rates for many years, then MFA-B (and other fixed-rate shares) simply don't make sense. Floating rates would be significantly better. Personally, I think we will see short-term rates reduced by late 2023 or in the first half of 2024. However, there's a significant chance that they would still be well above 1.58%.
Risks
The risks here pertain to MFA. MFA has a fairly unique portfolio:
MFA
They've dealt with credit risk on residential mortgages for quite a while. However, investors may be concerned by the "Business Purpose Loans." This is still residential lending. Further, MFA provides estimates on current LTV (loan-to-value) ratios. These kinds of metrics help investors evaluate the risk level in those loans. We can start by looking at these single-family rental loans:
MFA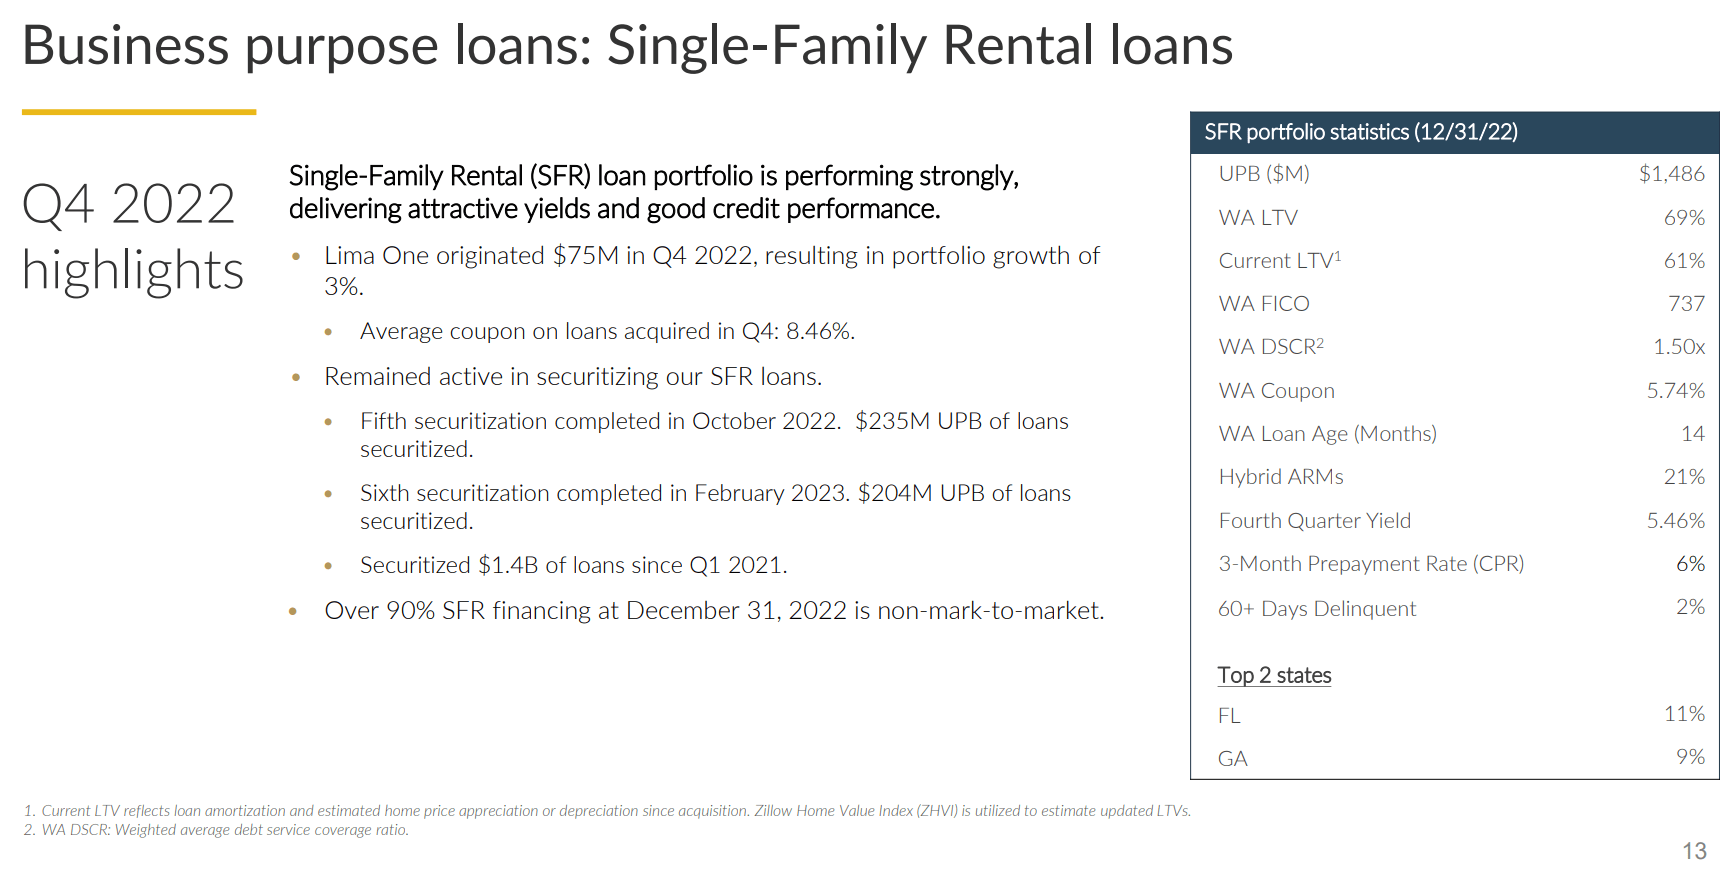
Even if you're bearish on single-family prices, you may feel fine with a current LTV at about 61%. These are estimates from management, but I haven't seen a reason to distrust their estimates. The credit scores aren't too bad either. Very few loans are delinquent. I've criticized some REITs dealing with credit risk for failing to securitize their loans. Shareholders should want that financing locked in. MFA has been actively working to securitize loans.
One of the benefits of securitizing is that it removes the "mark to market" aspect from the financing. During the pandemic, some banks would declare asset values were down, then dump the assets on minimal notice into a market with near zero liquidity. The results were proof that the "market value" was that low. As you might imagine, your car is probably worth more than I would get for it if I announce I'm selling it on Tuesday afternoon to whoever shows up. If you had a week, you'd probably get a much better deal. That's the benefit of having a little time and caring about the transaction price.
Why wouldn't the bank care about the price? Because they could go after the original owner for the difference. You don't want much of that exposure when there is any liquidity challenge with your assets. Some critics said the mortgage REITs got what they deserved for using short-term financing for longer-term assets.
Ironically, the banks are protected from a very similar scenario. Under the Bank Term Funding Program, banks are able to borrow on their Treasuries, agency debt, and mortgage-backed securities. The assets are valued at par, meaning the bank can pretend that $1,000 in face value of 10-year Treasuries with a 1.2% coupon rate is actually worth $1,000. In this case, the market has definitively stated that the asset is not worth $1,000. However, rather than the banks being forced to sell for a loss, they get to borrow based on the full face value.
Well, I appreciate that 67% of MFA's financing is non-mark-to-market. That's good for common shareholders and for the preferred shareholders since it gives management more flexibility.
Underpricing Before Floating
When we compare the future projected cash flows on different shares, we've found the market consistently overvalues shares that already floating relative to shares that won't float for a while. Based on this theory, MFA-C should outperform as the floating date approaches.
There are a few easy examples.
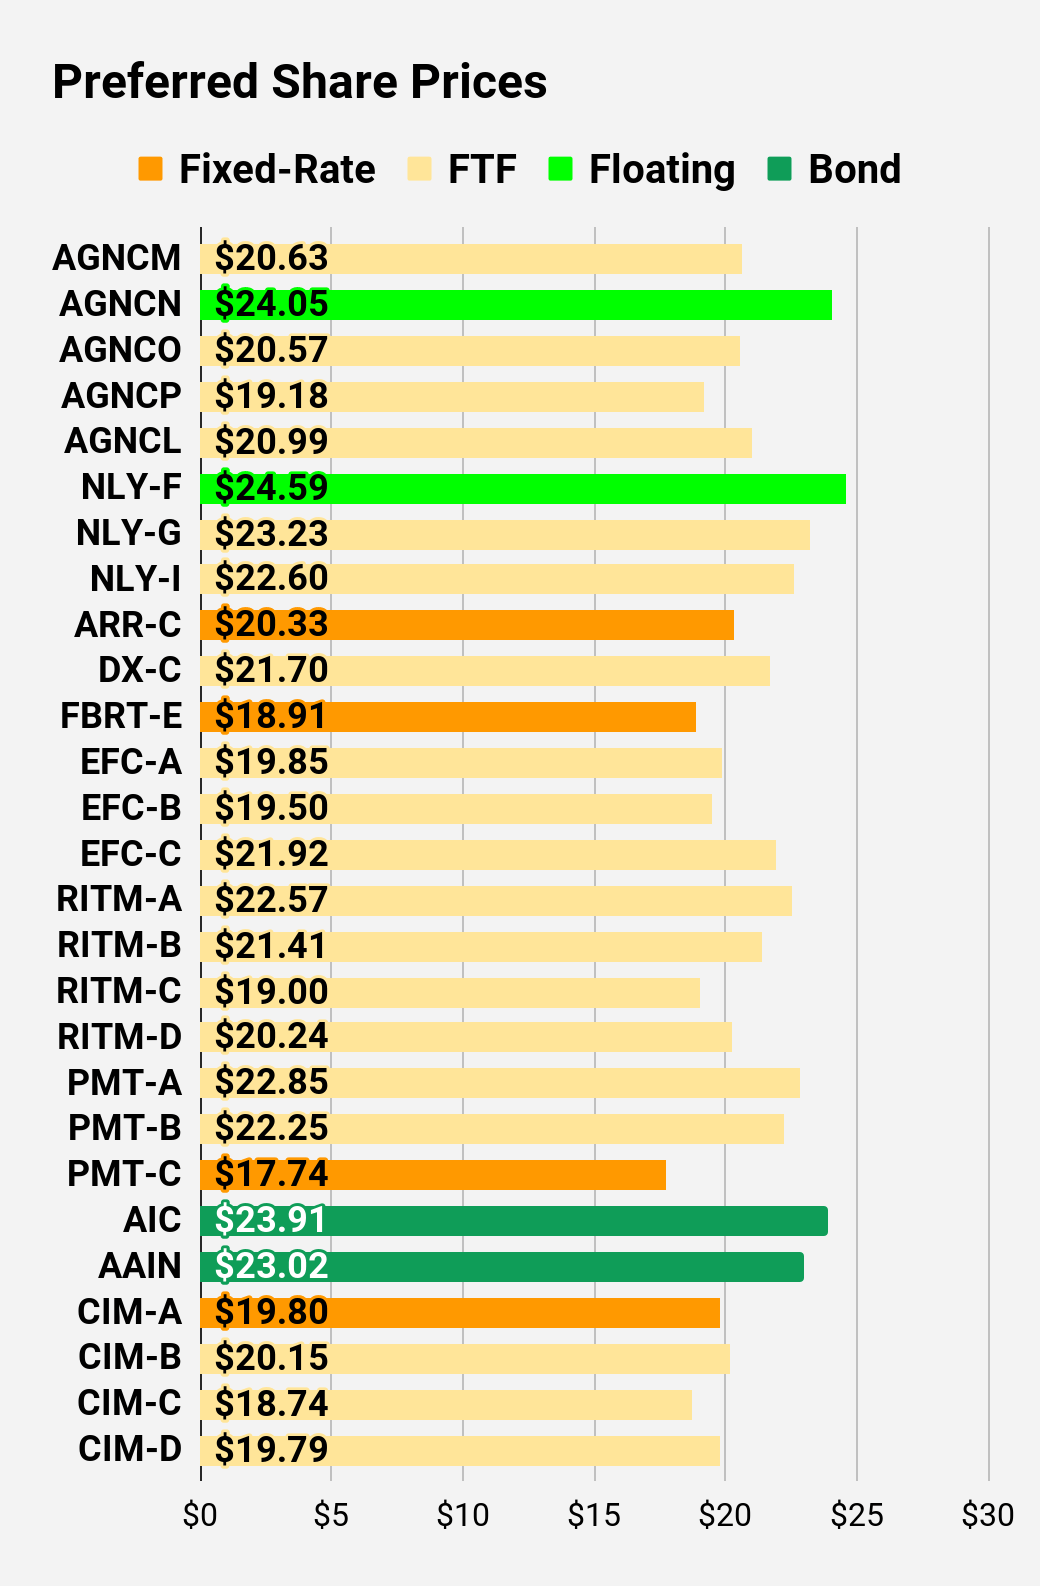
NLY-I (NLY.PI) is perpetually undervalued relative to NLY-F (NLY.PF) and NLY-G (NLY.PG). However, it's also worth noting that the market is overvaluing NLY-G relative to NLY-F.
NLY-G at $23.28 is not as good as NLY-F at $24.57 or NLY-I at $22.66.
We also see it with the AGNC preferred shares.
AGNCN (AGNCN) at $24.10 isn't as attractive as AGNCM (AGNCM) at $20.65, AGNCO (AGNCO) at $20.66, or AGNCP (AGNCP) at $19.17.
Which shares are floating already? NLY-F, NLY-G, and AGNCN.
The market simply isn't looking that far forward.
Stock Table
We will close out the rest of the article with the tables and charts we provide for readers to help them track the sector for both common shares and preferred shares.
We're including a quick table for the common shares that will be shown in our tables:
Type of REIT or BDC | ||||
Residential Agency | Residential Hybrid | Residential Originator and Servicer | Commercial | BDC |
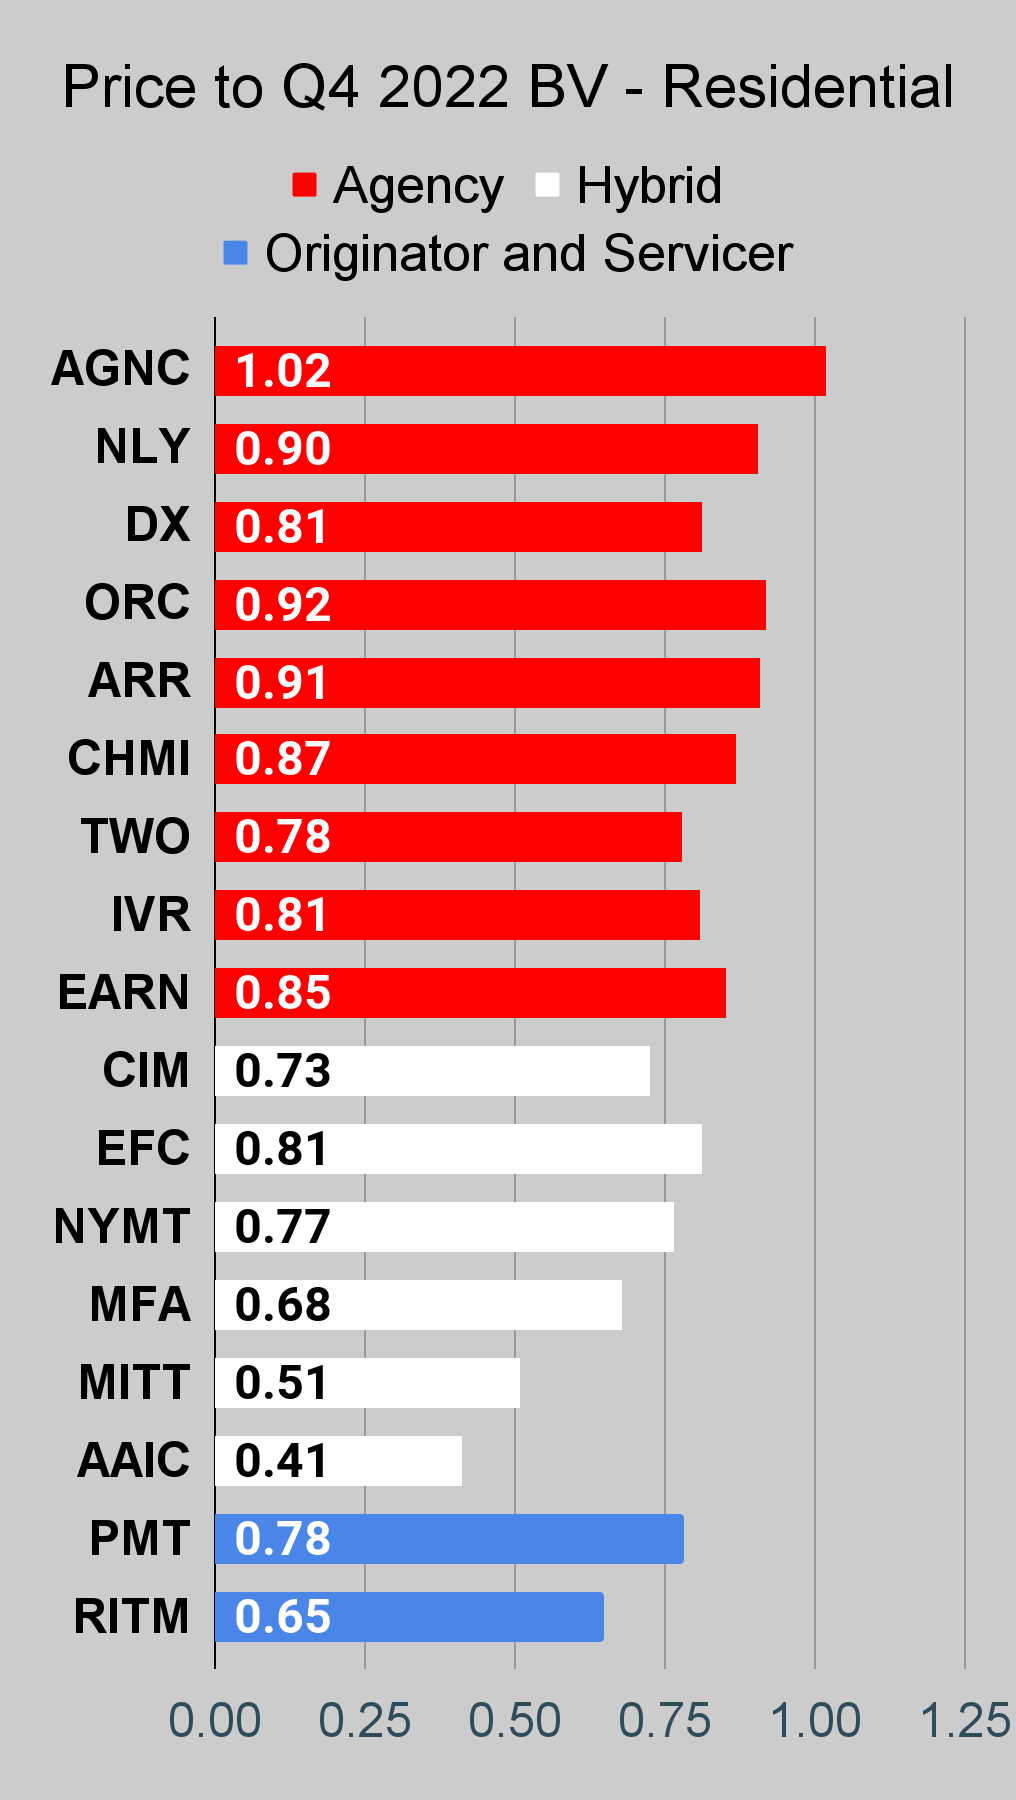
If you're looking for a stock and I haven't mentioned it yet, you'll still find it in the charts below. The charts contain comparisons based on price-to-book value, dividend yields, and earnings yield. You won't find these tables anywhere else.
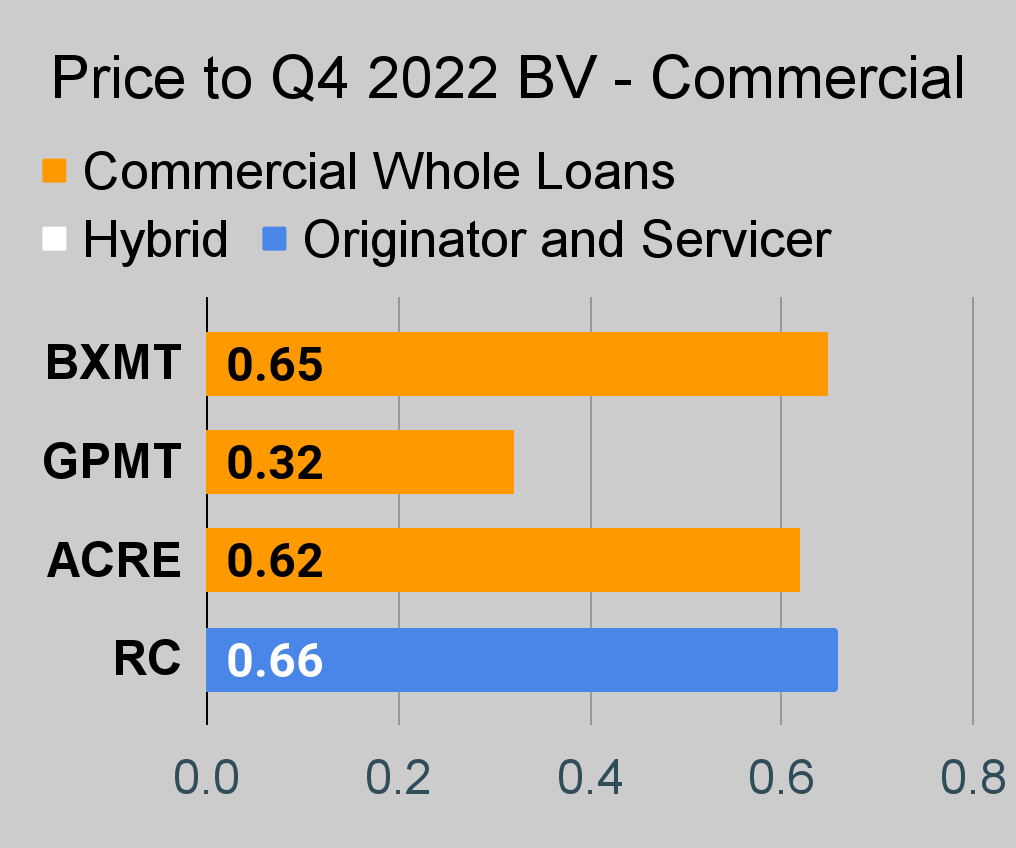
For mortgage REITs, please look at the charts for AGNC, NLY, DX, ORC, ARR, CHMI, TWO, IVR, EARN, CIM, EFC, NYMT, MFA, MITT, AAIC, PMT, RITM, BXMT, GPMT, WMC, and RC.
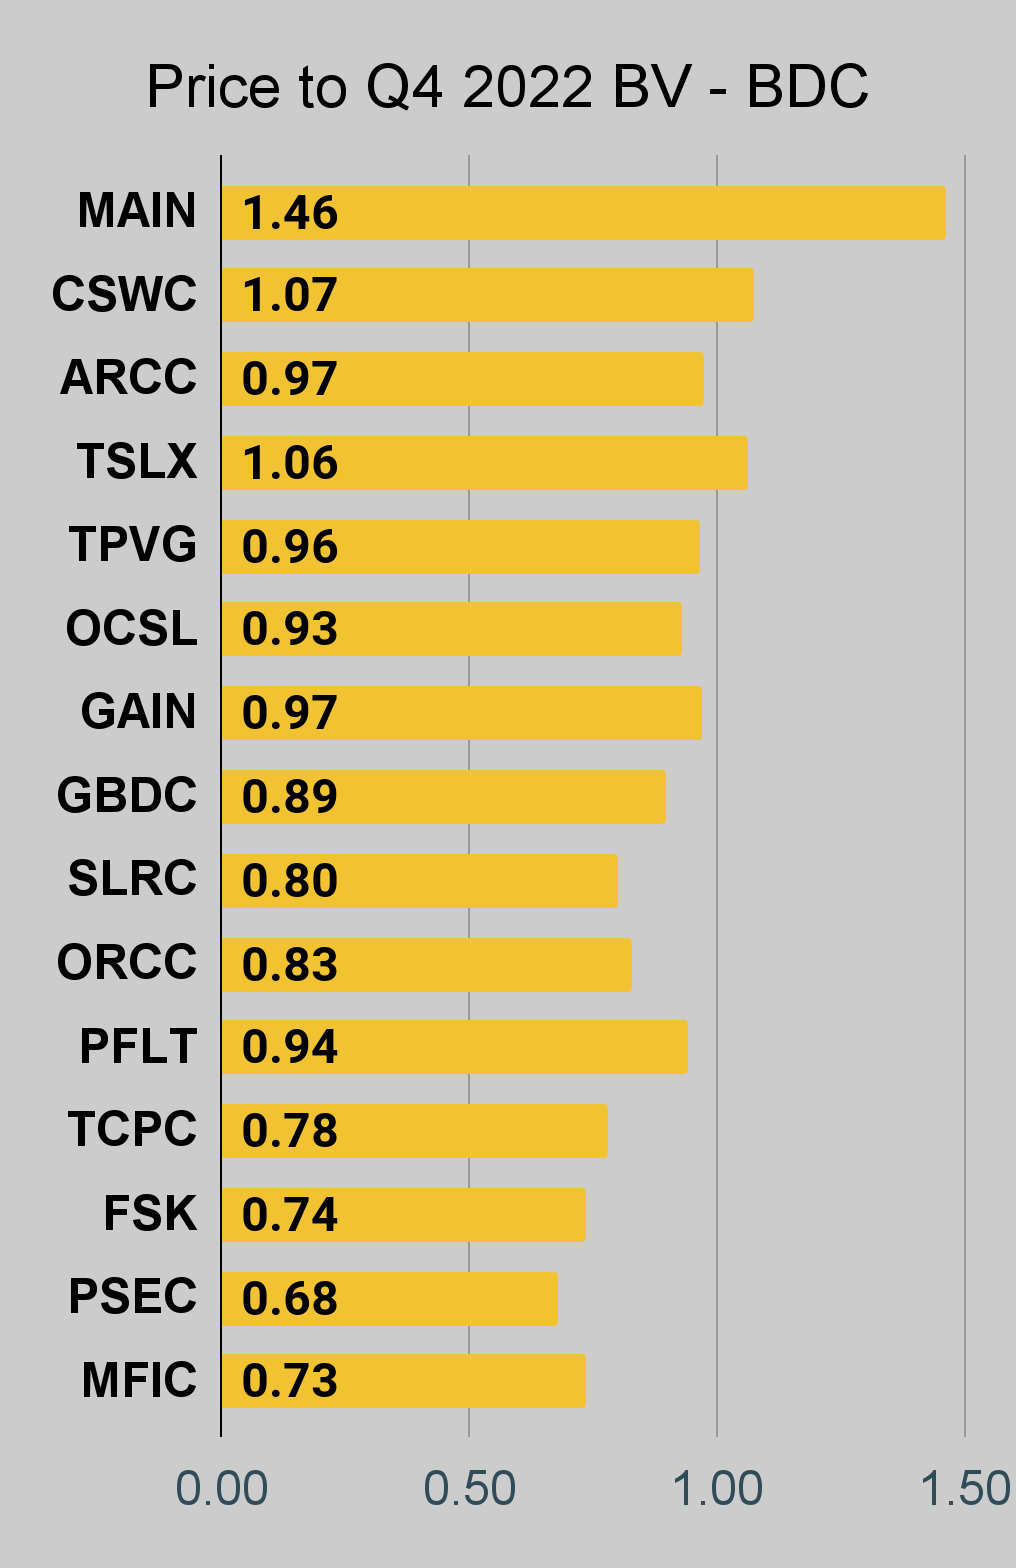
For BDCs, please look at the charts for MAIN, CSWC, ARCC, TSLX, TPVG, OCSL, GAIN, GBDC, SLRC, ORCC, PFLT, TCPC, FSK, PSEC, and MFIC.
This series is the easiest place to find charts providing up-to-date comparisons across the sector.
Residential Mortgage REIT Charts
Note: The chart for our public articles uses the book value per share from the latest earnings release. Current estimated book value per share is used in reaching our targets and trading decisions. It's available in our service, but those estimates are not included in the charts below. PMT and NYMT are not showing an earnings yield metric as neither REIT provides a quarterly "Core EPS" metric.
Second Note: Due to the way historical amortized cost and hedging is factored into the earnings metrics, it's possible for two mortgage REITs with similar portfolios to post materially different metrics for earnings. I would be very cautious about putting much emphasis on the consensus analyst estimate (which is used to determine the earnings yield). In particular, throughout late 2022 the earnings metric became less comparable for many REITs.
 The REIT Forum | 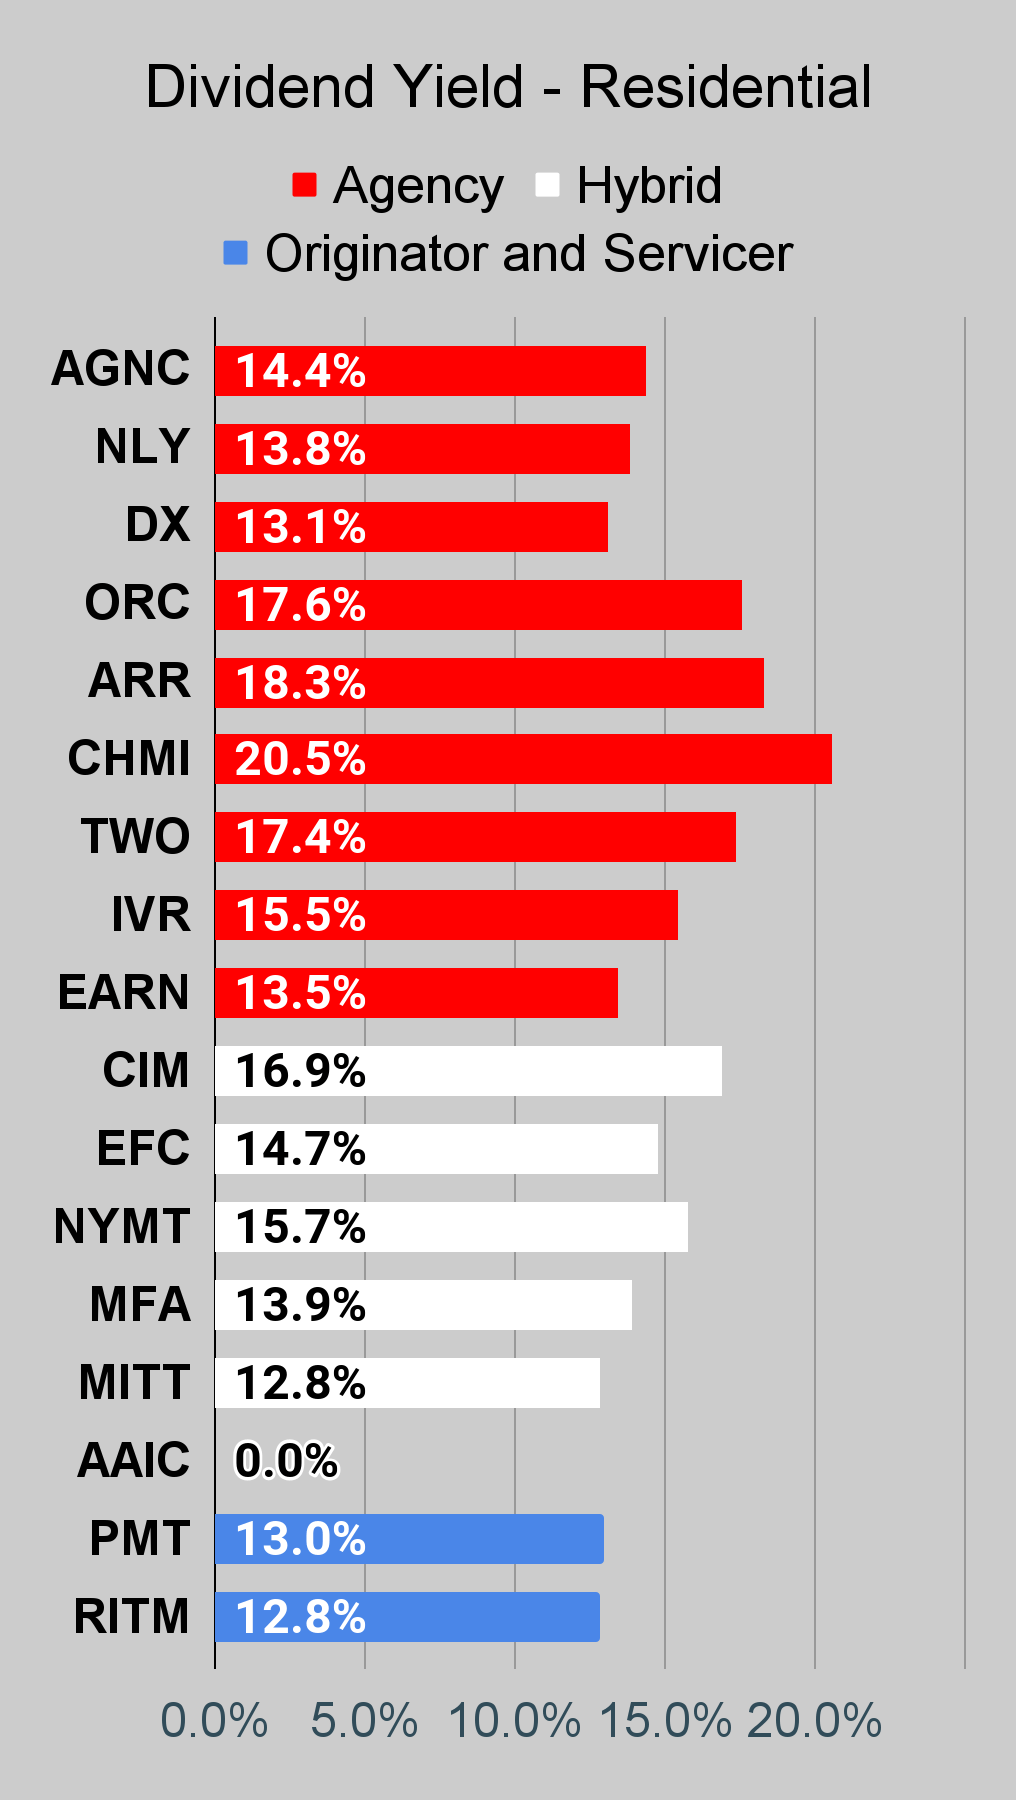 The REIT Forum | 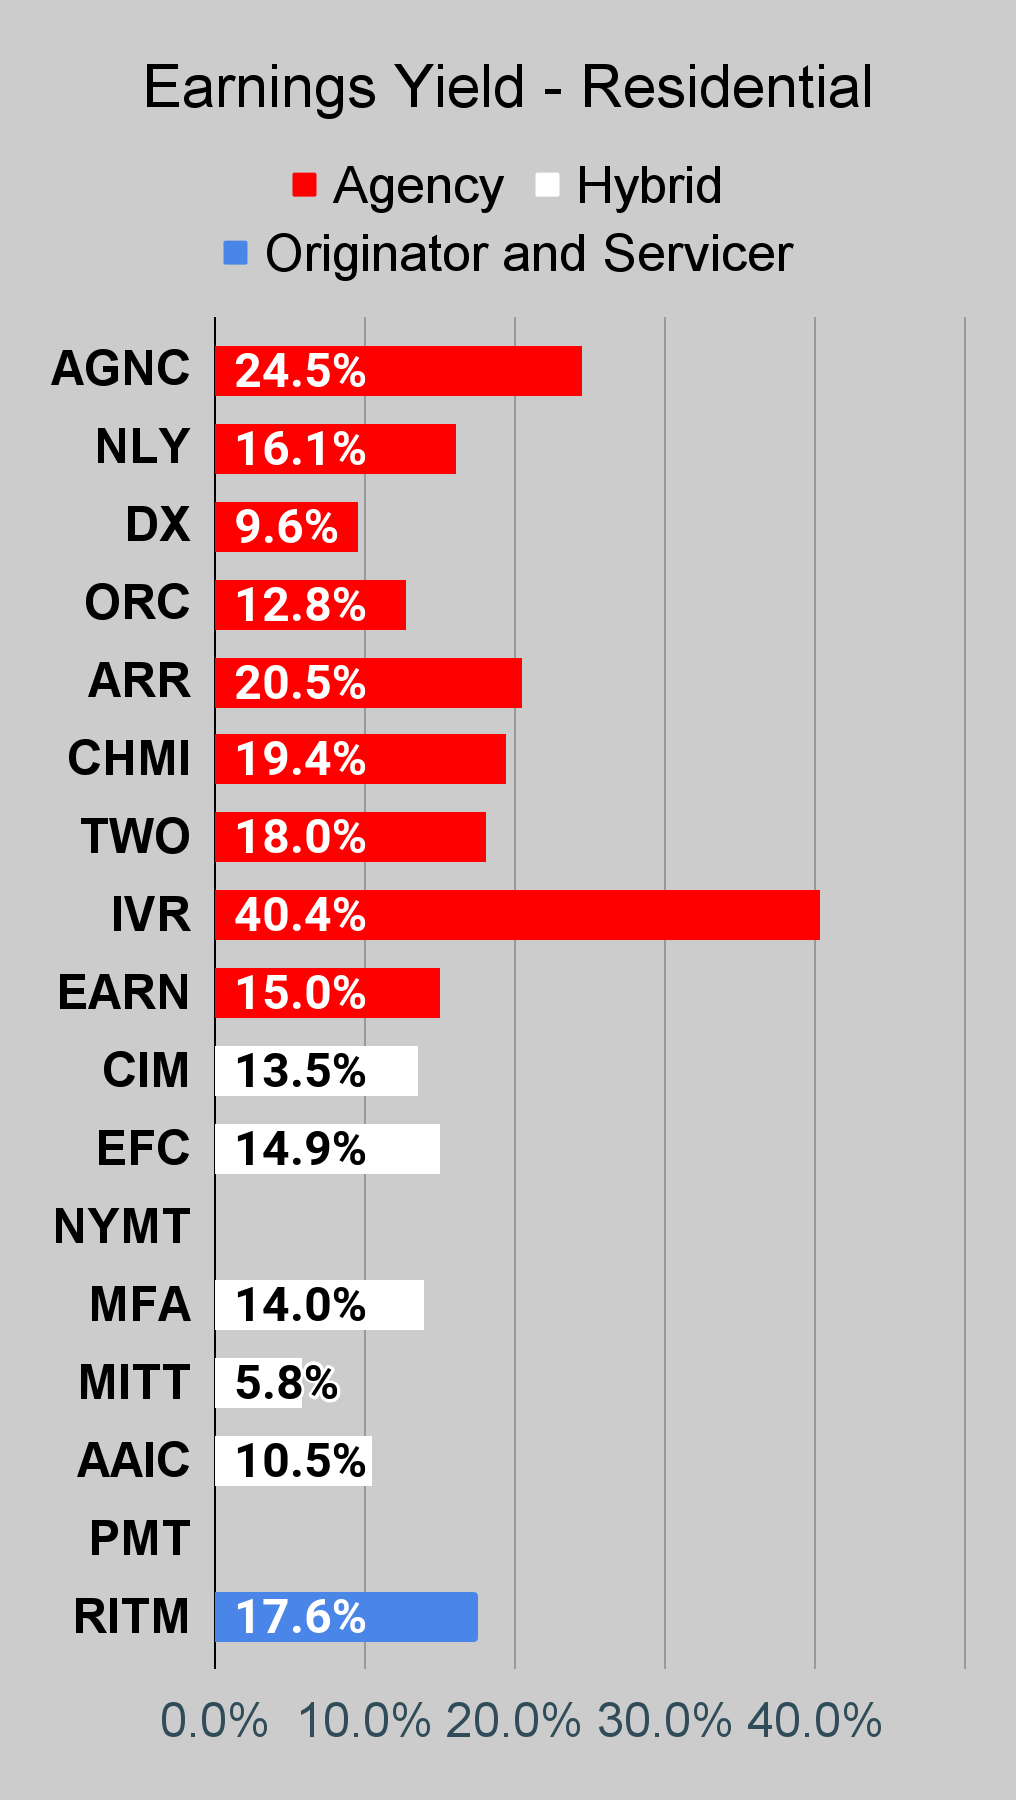 The REIT Forum |
Commercial Mortgage REIT Charts
 The REIT Forum | 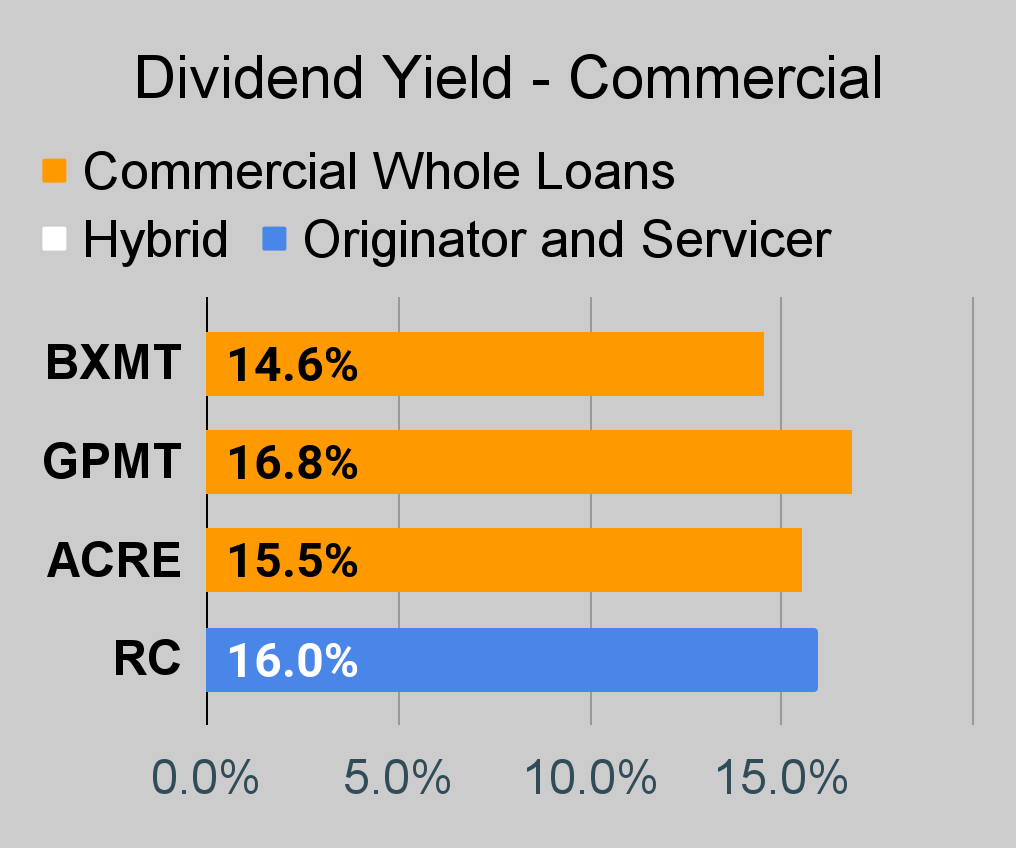 The REIT Forum | 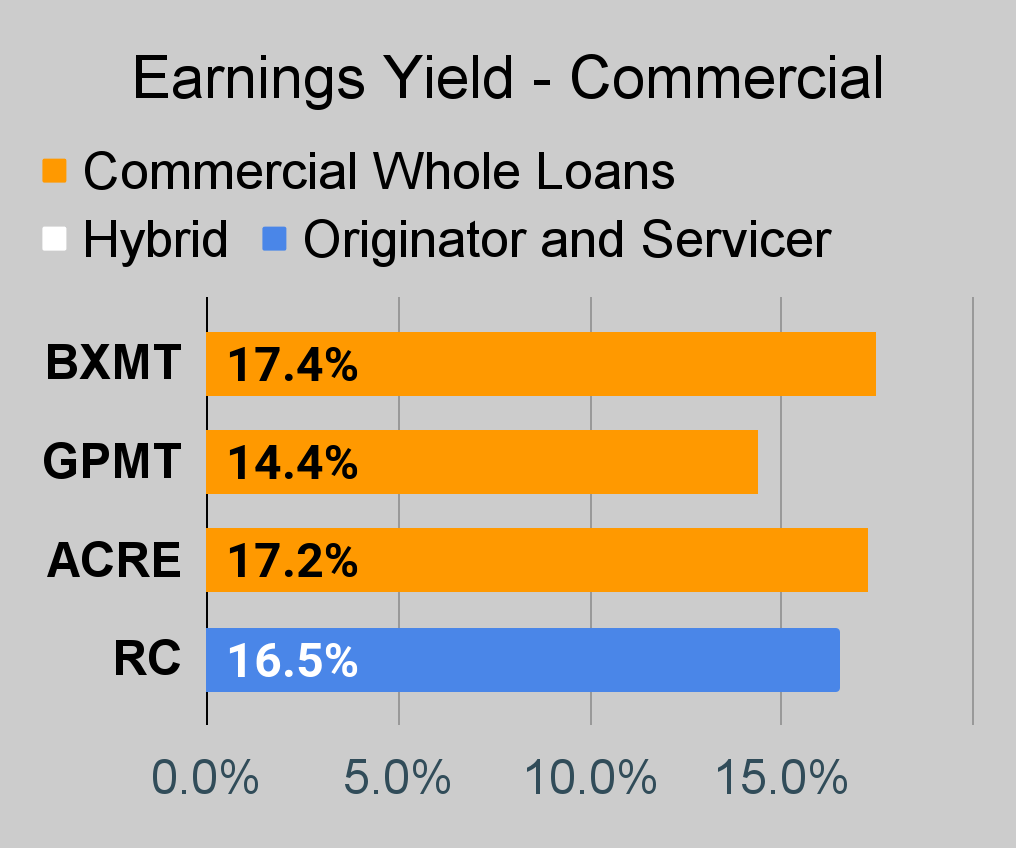 The REIT Forum |
BDC Charts
 The REIT Forum | 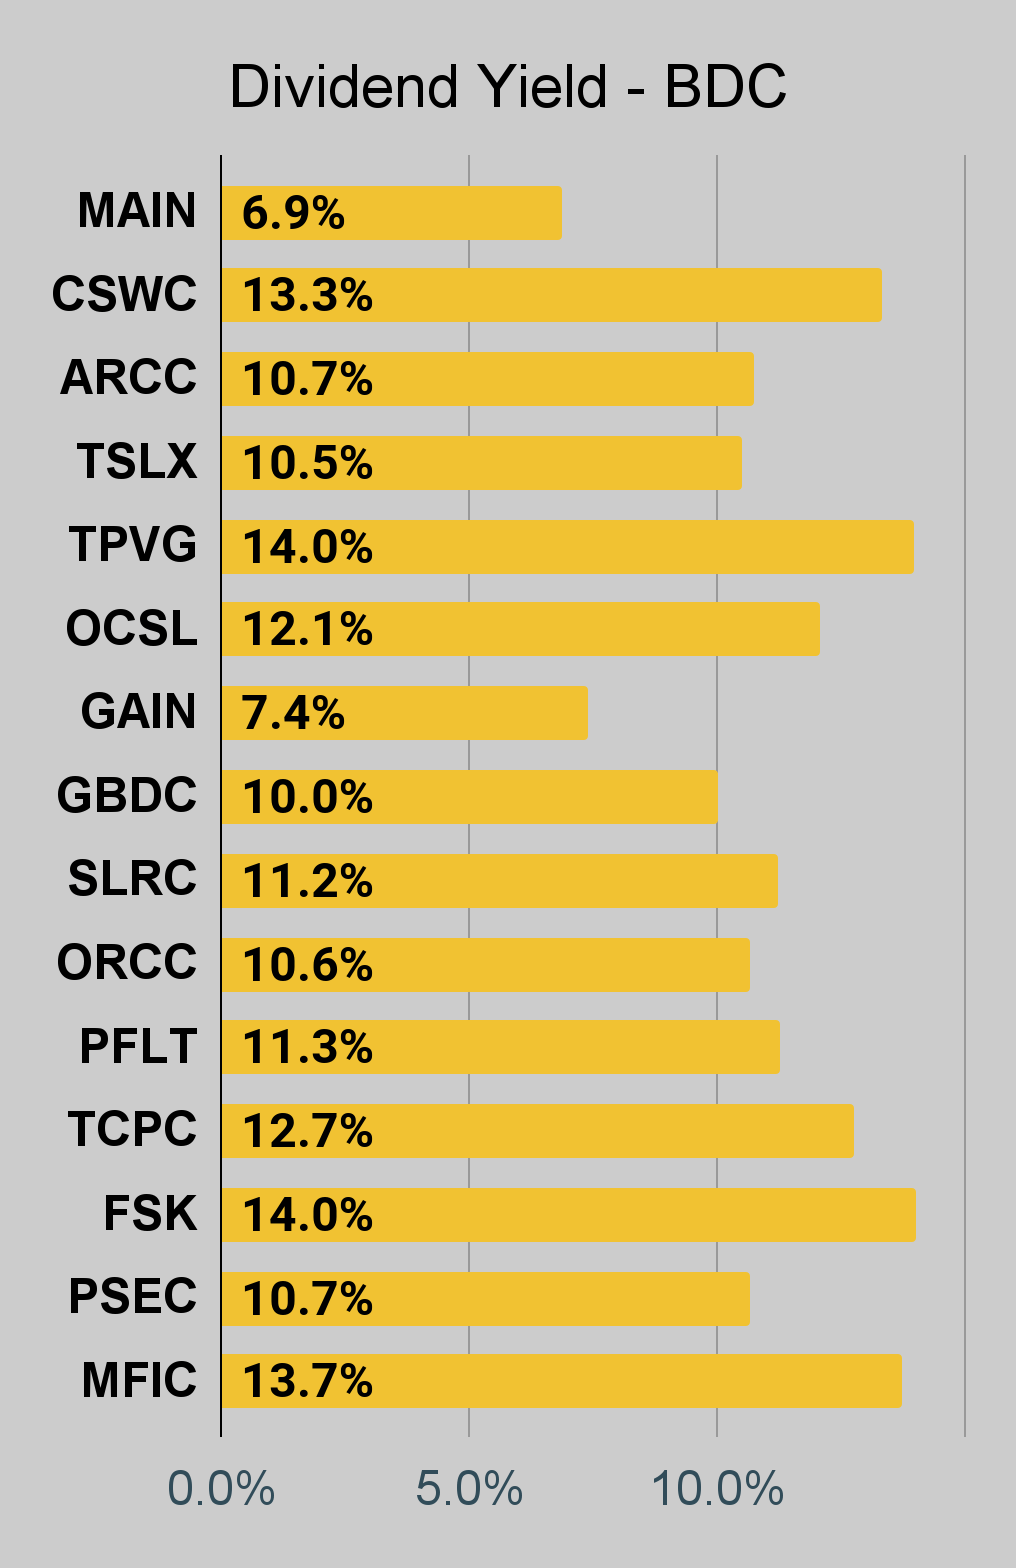 The REIT Forum | 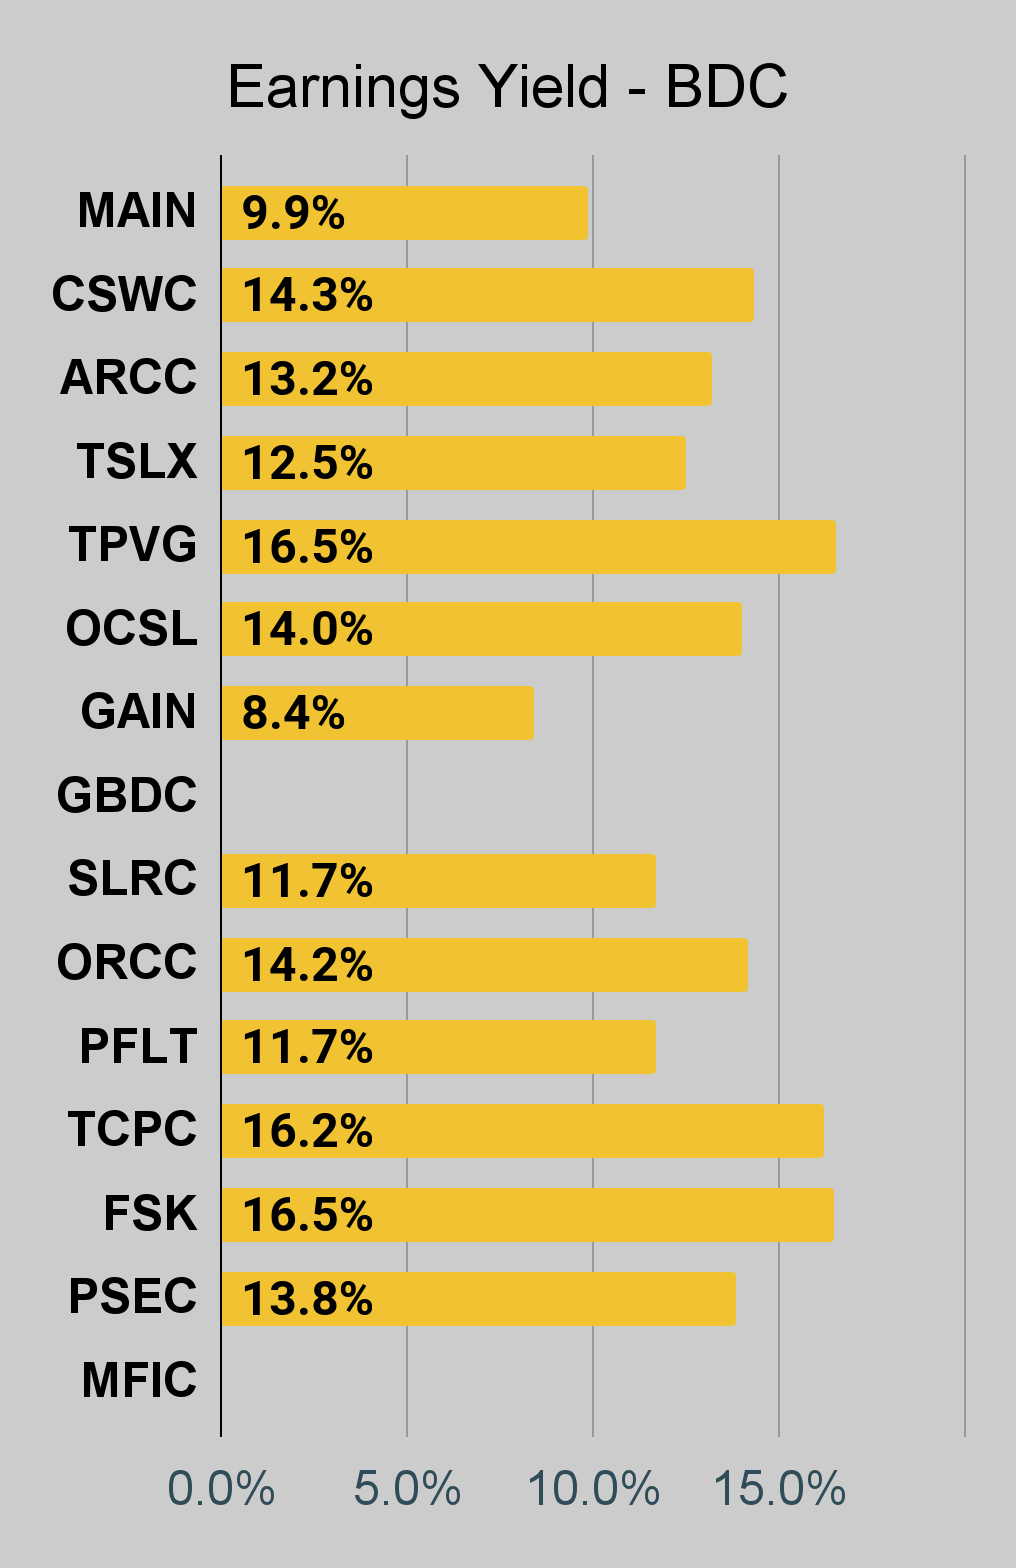 The REIT Forum |
Preferred Share Charts
I changed the coloring a bit. We needed to adjust to include that the first fixed-to-floating shares have transitioned over to floating rates. When a share is already floating, the stripped yield may be different from the "Floating Yield on Price" due to changes in interest rates. For instance, NLY-F already has a floating rate. However, the rate is only reset once per three months. The stripped yield is calculated using the upcoming projected dividend payment and the "Floating Yield on Price" is based on where the dividend would be if the rate reset today. In my opinion, for these shares the "Floating Yield on Price" is clearly the more important metric.
 The REIT Forum | 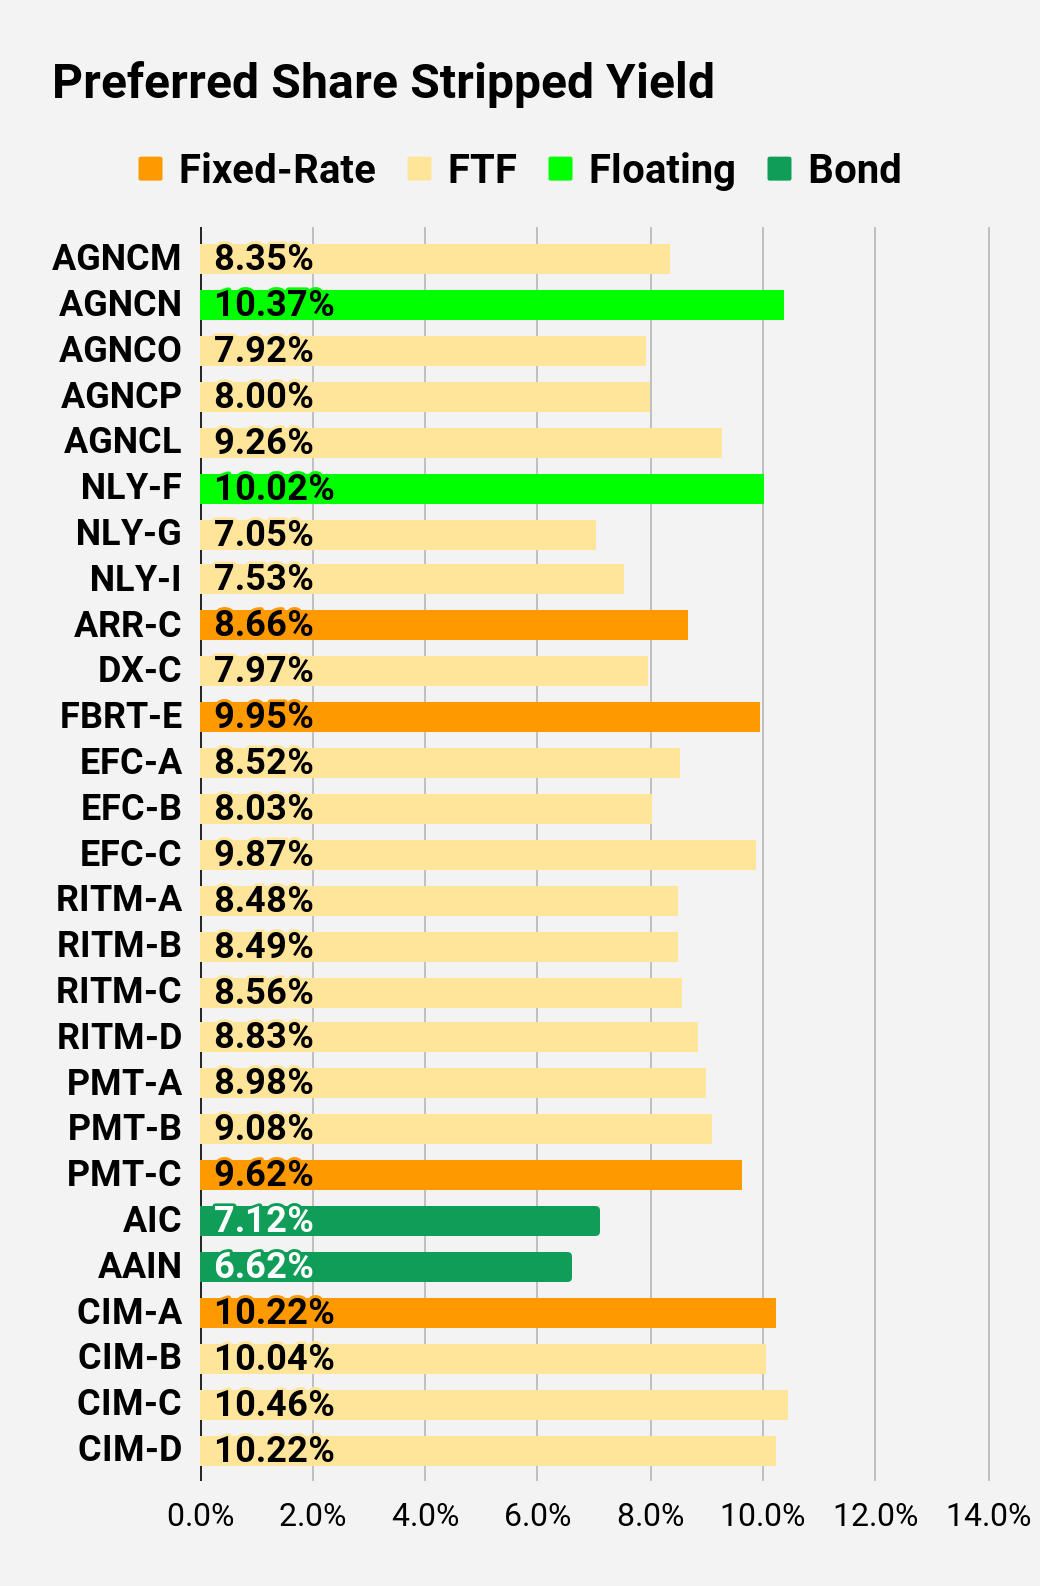 The REIT Forum | 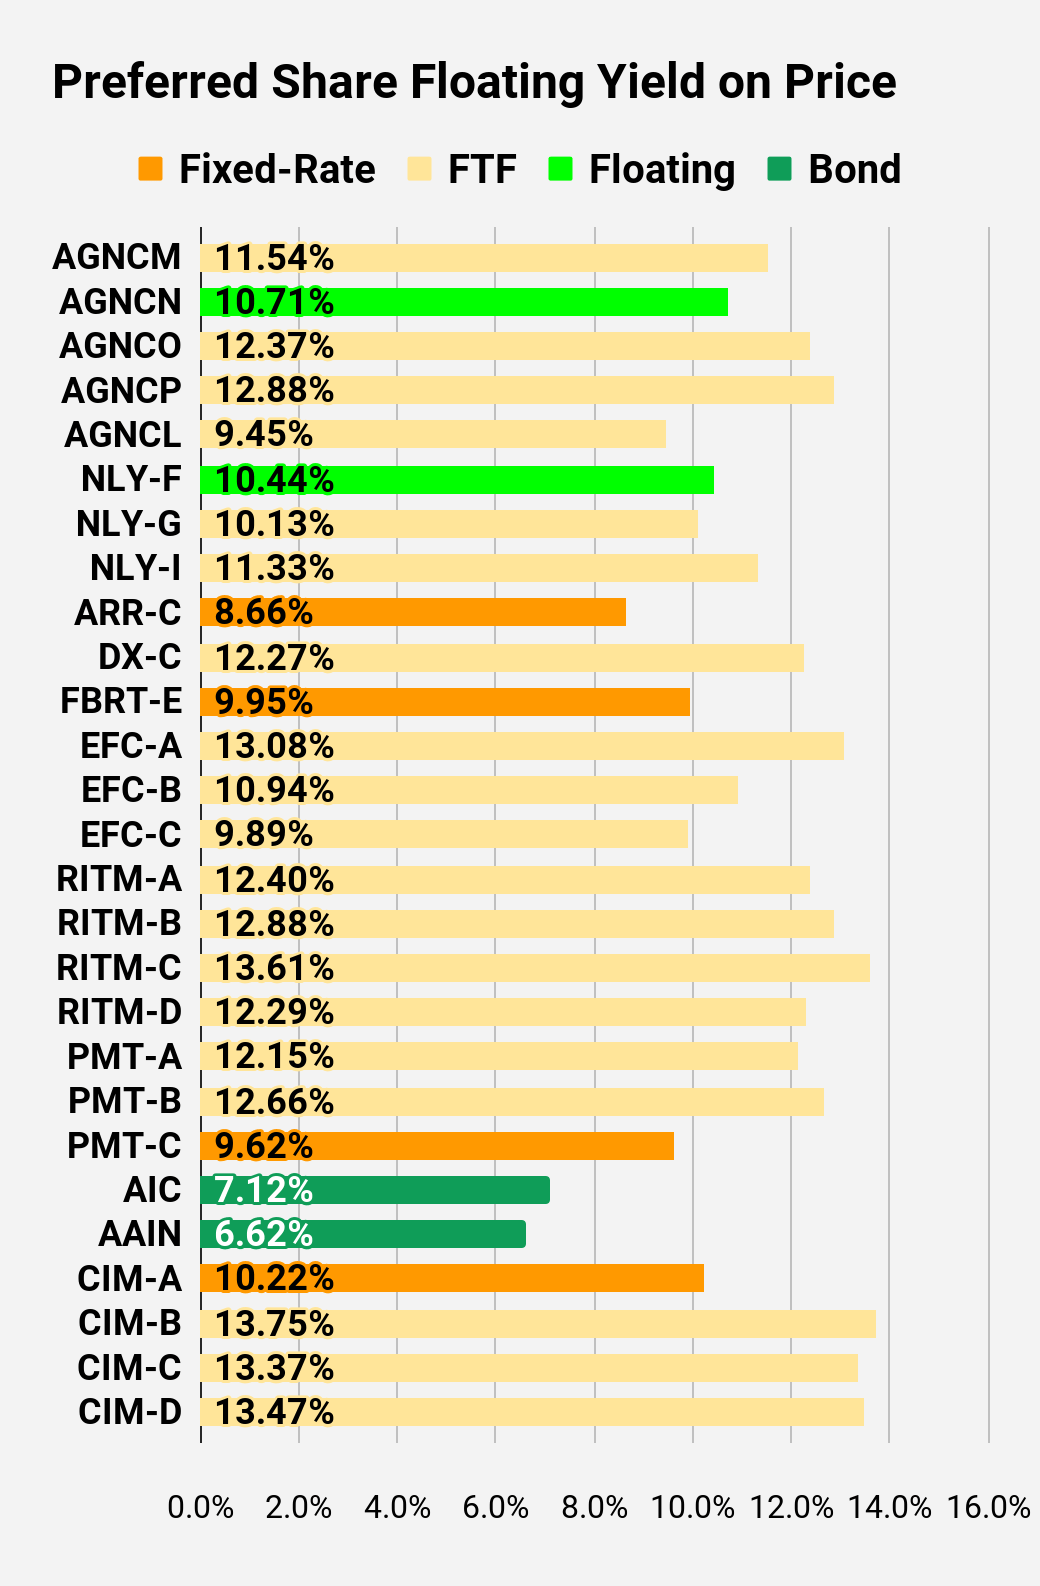 The REIT Forum |
 The REIT Forum | 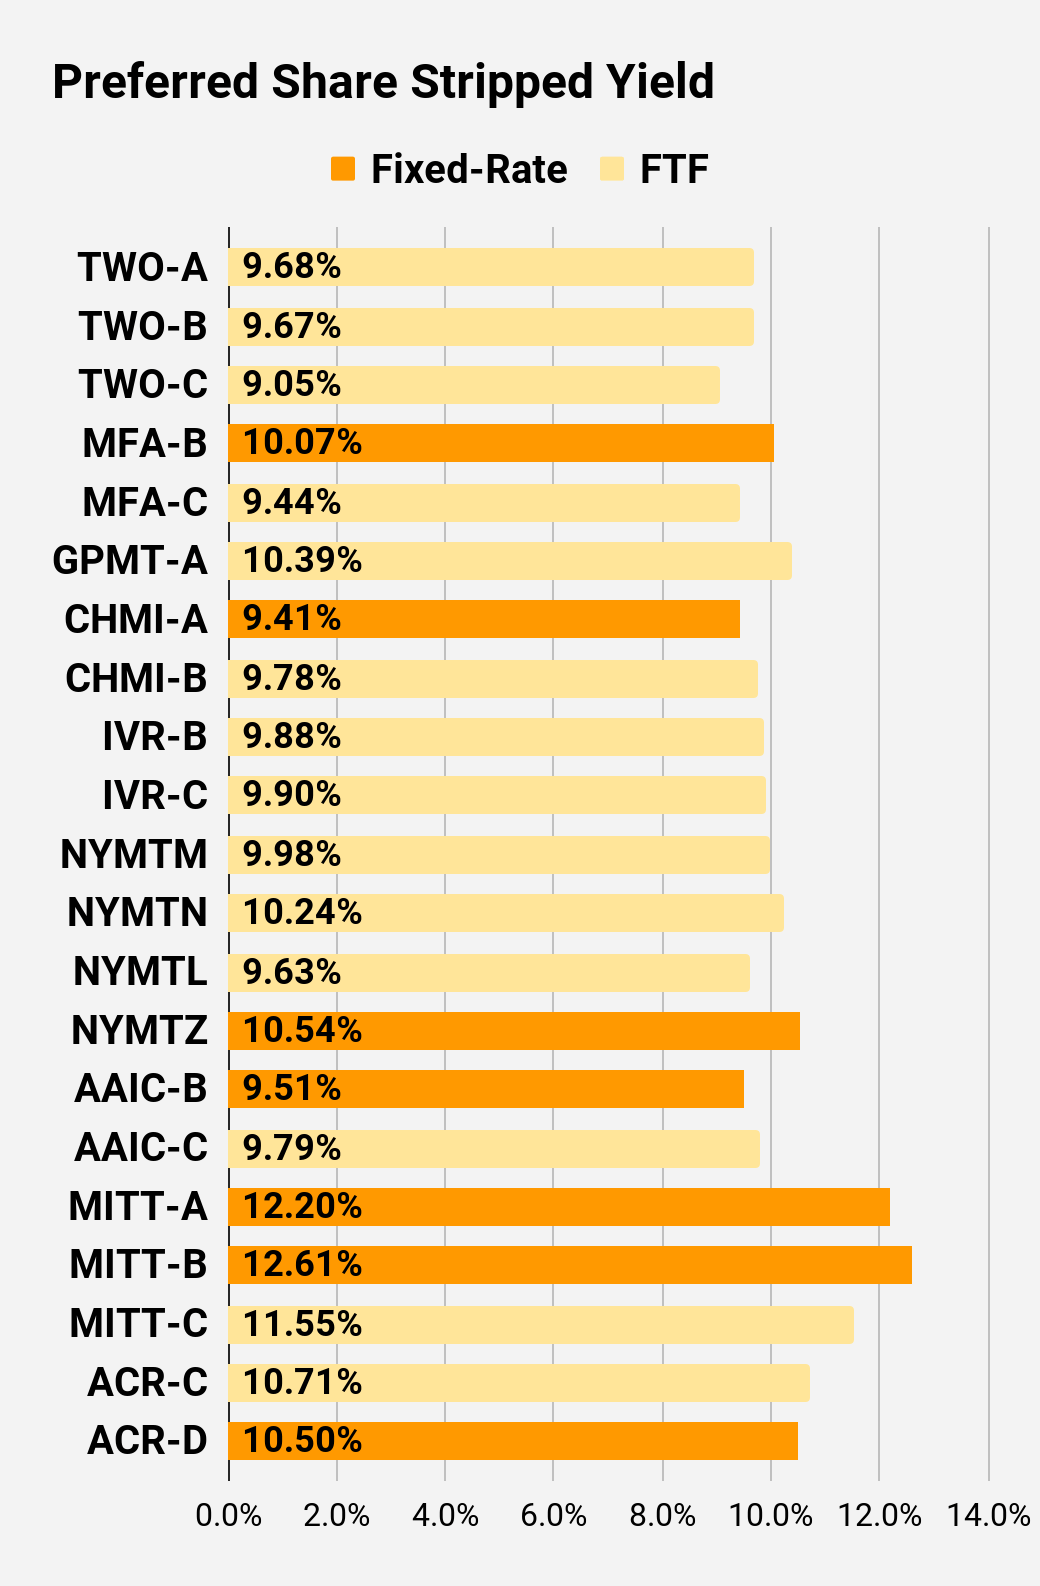 The REIT Forum | 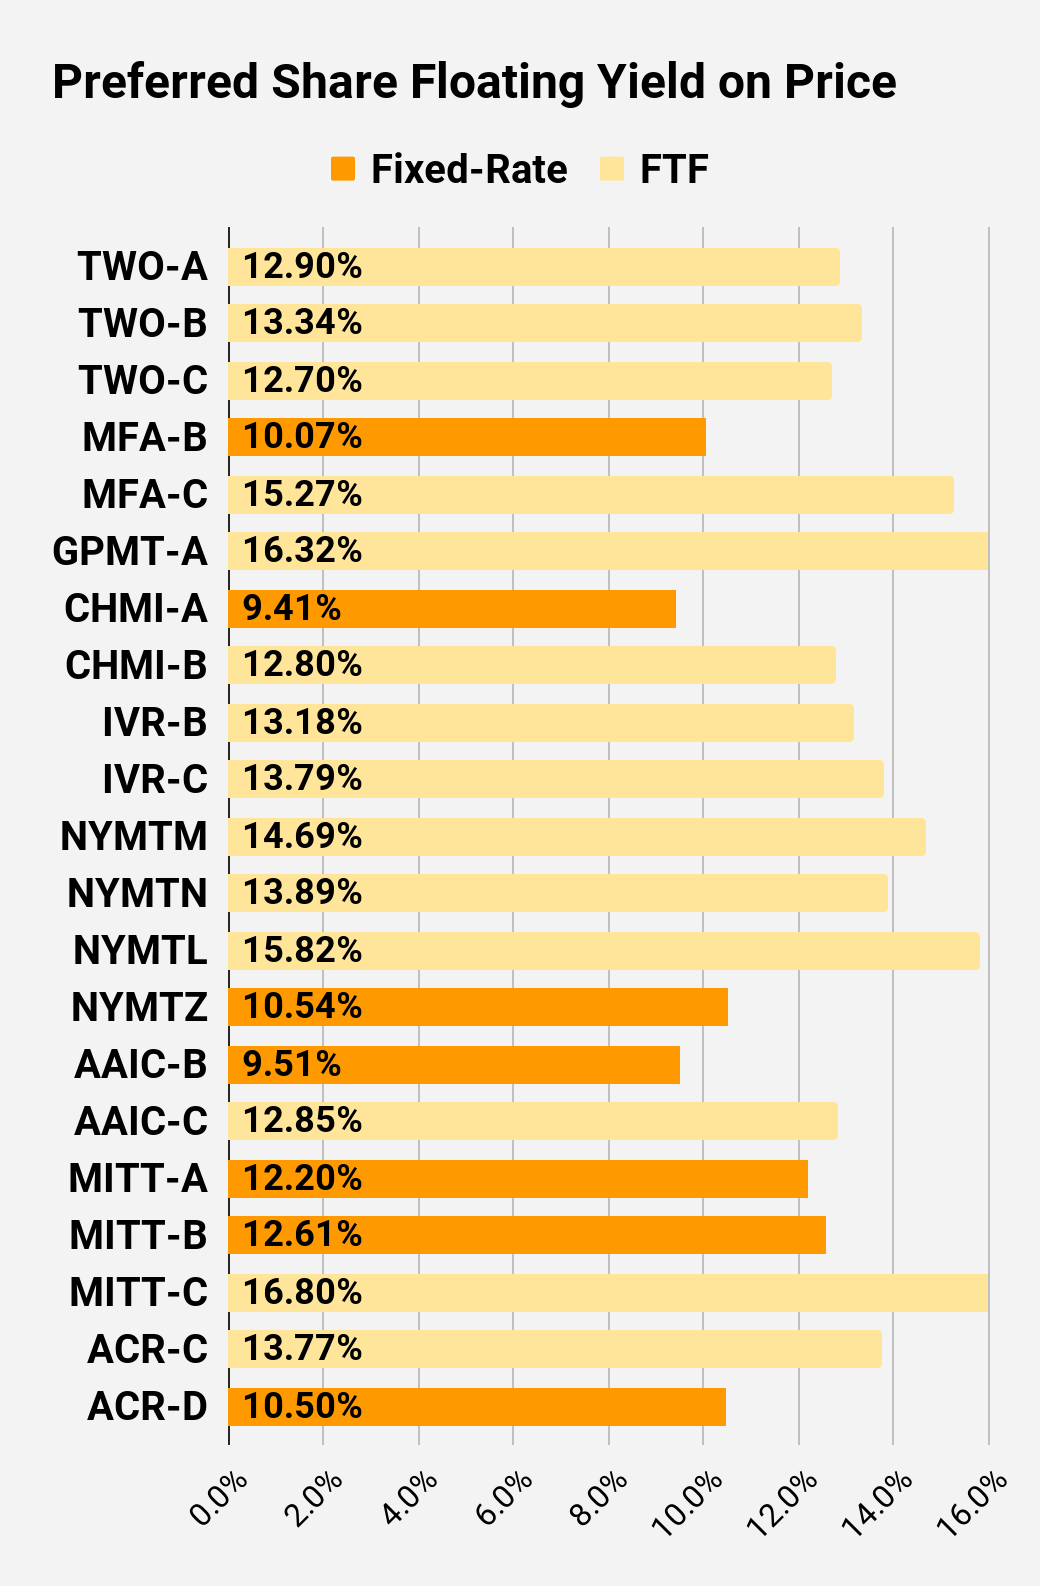 The REIT Forum |
Preferred Share Data
Beyond the charts, we're also providing our readers with access to several other metrics for the preferred shares.
After testing out a series on preferred shares, we decided to try merging it into the series on common shares. After all, we are still talking about positions in mortgage REITs. We don't have any desire to cover preferred shares without cumulative dividends, so any preferred shares you see in our column will have cumulative dividends. You can verify that by using Quantum Online. We've included the links in the table below.
To better organize the table, we needed to abbreviate column names as follows:
- Price = Recent Share Price - Shown in Charts
- BoF = Bond or FTF (Fixed-to-Floating)
- S-Yield = Stripped Yield - Shown in Charts
- Coupon = Initial Fixed-Rate Coupon
- FYoP = Floating Yield on Price - Shown in Charts
- NCD = Next Call Date (the soonest shares could be called)
- Note: For all FTF issues, the floating rate would start on NCD.
- WCC = Worst Cash to Call (lowest net cash return possible from a call)
- QO Link = Link to Quantum Online Page
Ticker | Price | BoF | S-Yield | Coupon | FYoP | NCD | WCC | QO Link | P-Link |
$20.63 | FTF | 8.35% | 6.88% | 11.54% | 4/15/2024 | $6.10 | |||
$24.05 | Floating | 10.37% | 9.94% | 10.71% | 5/10/2023 | $1.13 | |||
$20.57 | FTF | 7.92% | 6.50% | 12.37% | 10/15/2024 | $6.88 | |||
$19.18 | FTF | 8.00% | 6.13% | 12.88% | 4/15/2025 | $8.89 | |||
$20.99 | FTF | 9.26% | 7.75% | 9.45% | 10/15/2027 | $12.74 | |||
$24.59 | Floating | 10.02% | 9.75% | 10.44% | 5/10/2023 | $0.68 | |||
$23.23 | FTF | 7.05% | 6.50% | 10.13% | 5/10/2023 | $1.95 | |||
$22.60 | FTF | 7.53% | 6.75% | 11.33% | 6/30/2024 | $4.52 | |||
$20.33 | 8.66% | 7.00% | 8.66% | 1/28/2025 | $7.89 | ||||
$21.70 | FTF | 7.97% | 6.90% | 12.27% | 4/15/2025 | $6.75 | |||
$18.91 | 9.95% | 7.50% | 9.95% | 5/10/2023 | $6.21 | ||||
$19.85 | FTF | 8.52% | 6.75% | 13.08% | 10/30/2024 | $7.69 | |||
$19.50 | FTF | 8.03% | 6.25% | 10.94% | 1/30/2027 | $11.37 | |||
$21.92 | FTF | 9.87% | 8.63% | 9.89% | 4/30/2028 | $13.88 | |||
$22.57 | FTF | 8.48% | 7.50% | 12.40% | 8/15/2024 | $5.26 | |||
$21.41 | FTF | 8.49% | 7.13% | 12.88% | 8/15/2024 | $6.28 | |||
$19.00 | FTF | 8.56% | 6.38% | 13.61% | 2/15/2025 | $9.21 | |||
$20.24 | FTF | 8.83% | 7.00% | 12.29% | 11/15/2026 | $11.35 | |||
$22.85 | FTF | 8.98% | 8.13% | 12.15% | 3/15/2024 | $4.19 | |||
$22.25 | FTF | 9.08% | 8.00% | 12.66% | 6/15/2024 | $5.26 | |||
$17.74 | 9.62% | 6.75% | 9.62% | 8/24/2026 | $13.08 | ||||
$23.91 | Bond | 7.12% | 6.75% | 7.12% | 5/10/2023 | $1.34 | |||
$23.02 | Bond | 6.62% | 6.00% | 6.62% | 8/1/2023 | $2.73 | |||
$19.80 | 10.22% | 8.00% | 10.22% | 5/10/2023 | $5.51 | ||||
$20.15 | FTF | 10.04% | 8.00% | 13.75% | 3/30/2024 | $6.94 | |||
$18.74 | FTF | 10.46% | 7.75% | 13.37% | 9/30/2025 | $11.20 | |||
$19.79 | FTF | 10.22% | 8.00% | 13.47% | 03/30/2024 | $7.30 |
Second Batch:
Ticker | Price | BoF | S-Yield | Coupon | FYoP | NCD | WCC | QO Link | P-Link |
$21.48 | FTF | 9.68% | 8.13% | 12.90% | 04/27/2027 | $12.15 | |||
$20.18 | FTF | 9.67% | 7.63% | 13.34% | 07/27/2027 | $13.40 | |||
$20.48 | FTF | 9.05% | 7.25% | 12.70% | 1/27/2025 | $8.15 | |||
$18.82 | 10.07% | 7.50% | 10.07% | 5/10/2023 | $6.39 | ||||
$17.38 | FTF | 9.44% | 6.50% | 15.27% | 3/31/2025 | $10.88 | |||
$16.89 | FTF | 10.39% | 7.00% | 16.32% | 11/30/2026 | $14.44 | |||
$21.84 | 9.41% | 8.20% | 9.41% | 5/10/2023 | $3.22 | ||||
$21.15 | FTF | 9.78% | 8.25% | 12.80% | 4/15/2024 | $5.84 | |||
$19.83 | FTF | 9.88% | 7.75% | 13.18% | 12/27/2024 | $8.59 | |||
$19.15 | FTF | 9.90% | 7.50% | 13.79% | 9/27/2027 | $14.32 | |||
$19.79 | FTF | 9.98% | 7.88% | 14.69% | 1/15/2025 | $8.66 | |||
$19.60 | FTF | 10.24% | 8.00% | 13.89% | 10/15/2027 | $14.40 | |||
$17.90 | FTF | 9.63% | 6.88% | 15.82% | 10/15/2026 | $13.12 | |||
$16.65 | 10.54% | 7.00% | 10.54% | 1/15/2027 | $14.92 | ||||
$18.60 | 9.51% | 7.00% | 9.51% | 5/10/2023 | $6.60 | ||||
$21.30 | FTF | 9.79% | 8.25% | 12.85% | 3/30/2024 | $5.77 | |||
$17.15 | 12.20% | 8.25% | 12.20% | 5/10/2023 | $8.12 | ||||
$16.10 | 12.61% | 8.00% | 12.61% | 5/10/2023 | $9.16 | ||||
$17.55 | FTF | 11.55% | 8.00% | 16.80% | 9/17/2024 | $10.43 | |||
$20.19 | FTF | 10.71% | 8.63% | 13.77% | 7/30/2024 | $7.51 | |||
$18.80 | 10.50% | 7.88% | 10.50% | 5/21/2026 | $12.22 |
Strategy
Our goal is to maximize total returns. We achieve those most effectively by including "trading" strategies. We regularly trade positions in the mortgage REIT common shares and BDCs because:
- Prices are inefficient.
- Long term, share prices generally revolve around book value.
- Short term, price-to-book ratios can deviate materially.
- Book value isn't the only step in analysis, but it's the cornerstone.
We also allocate to preferred shares and equity REITs. We encourage buy-and-hold investors to consider using more preferred shares and equity REITs.
Performance
We compare our performance against four ETFs that investors might use for exposure to our sectors:
The REIT Forum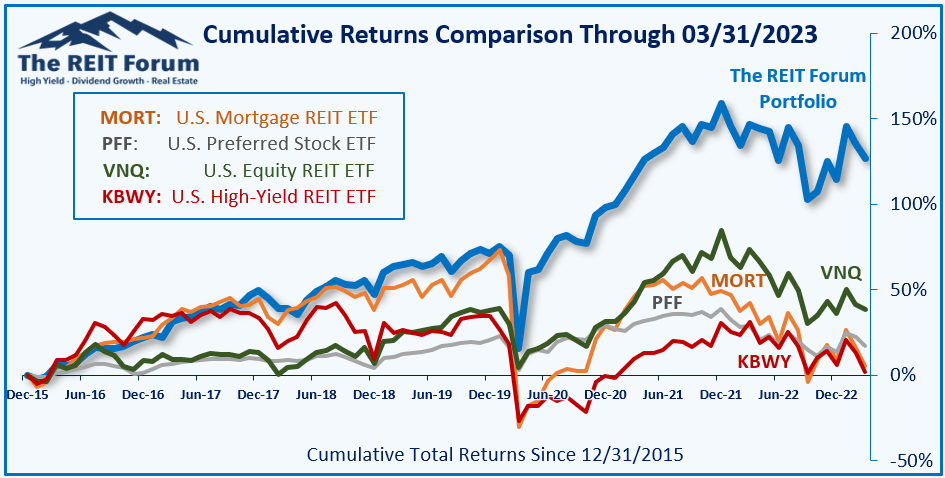
The four ETFs we use for comparison are:
Ticker | Exposure |
One of the largest mortgage REIT ETFs | |
One of the largest preferred share ETFs | |
Largest equity REIT ETF | |
The high-yield equity REIT ETF. Yes, it has been dreadful. |
When investors think it isn't possible to earn solid returns in preferred shares or mortgage REITs, we politely disagree. The sector has plenty of opportunities, but investors still need to be wary of the risks. We can't simply reach for yield and hope for the best. When it comes to common shares, we need to be even more vigilant to protect our principal by regularly watching prices and updating estimates for book value and price targets.
Ratings: MFA-C at $17.38 is a better deal than MFA-B at $18.82.

This article was written by

Analyst’s Disclosure: I/we have a beneficial long position in the shares of AGNCO, RITM-D, AGNCP, FBRT-E, GPMT-A, RC-E, MFA-C, RITM, SLRC, AAIC, MFA, GPMT, RC, DX either through stock ownership, options, or other derivatives. I wrote this article myself, and it expresses my own opinions. I am not receiving compensation for it (other than from Seeking Alpha). I have no business relationship with any company whose stock is mentioned in this article.
Colorado Wealth Management Fund and Scott Kennedy are supporting contributors for The REIT Forum. Our ratings and outlooks will often overlap. Any recommendation posted in this article is not indefinite. We closely monitor all of our positions. We issue Buy and Sell alerts on our recommendations, which are exclusive to our members. I have an indirect conflict of interest with ABR and STWD. Neither I, nor any contributor for The REIT Forum, will provide investment advice, reply to questions, or engage in discussions regarding these two mREIT stocks.
Seeking Alpha's Disclosure: Past performance is no guarantee of future results. No recommendation or advice is being given as to whether any investment is suitable for a particular investor. Any views or opinions expressed above may not reflect those of Seeking Alpha as a whole. Seeking Alpha is not a licensed securities dealer, broker or US investment adviser or investment bank. Our analysts are third party authors that include both professional investors and individual investors who may not be licensed or certified by any institute or regulatory body.