National Retail Properties: Almost Perfect

Summary
- National Retail Properties is one of the most secure and robust REITs.
- Their business model will let them continue to grow cash earnings modestly and to generate high-single-digit economic returns.
- But they are not perfect and should in my view make a few changes to better achieve their goals.
- I do much more than just articles at High Yield Landlord: Members get access to model portfolios, regular updates, a chat room, and more. Learn More »
Kwarkot
My hope is to buy stock in National Retail Properties (NYSE:NNN) when market movements let me do that without loss of current dividend income. They focus on single-tenant, retail properties, with triple-net leases under which the tenants are responsible for all maintenance, insurance, and taxes.
National Retail has been the topic of many favorable articles on SA, including recently. Going back several years, there are no bearish articles and only a few neutral ones. And indeed, my article today is not bearish.
Those articles highlight a lot of positive aspects of National Retail. These are effectively portrayed in their investor presentation. Here is only a partial list of the things to like:
- Investment-grade BBB+ credit rating
- Substantially no secured debt
- Negligible debt maturities before 2024, a year ahead
- 13.7 year weighted-average debt maturity
- 10.4 year weighted-average lease term
- Ample liquidity
- 33 years of increased dividends
- Sustained very high occupancy (now 99.4%)
- Middle-market focus (on firms that cannot sell bonds)
- Dominantly (71% since 2006) relationship-based acquisitions
- Outstanding diversification by geography and line of trade
Note that the debt maturities exceed the lease terms. National Retail may be the only Net Lease REIT that has managed to borrow long and lease short. This is truly stellar.
In addition, they kept a gap of two years to the nearest debt maturity until last year. My expectation as that they will restore that when feasible.
On top of all that, National Retail has been so successful with their selection of middle-market tenants that 18% of them have become investment-grade later.
There is, obviously, a lot to like here. That said, I set out to examine and model National Retail in detail, as I’ve done this year with Simon Property Group (SPG), AvalonBay Communities (AVB), and EPR Properties (EPR).
As is often true of REIT stocks about which I write, I see NNN as more compelling for some investors than for others. NNN is part of the Buy Hold and Go Fishing Portfolio I published a couple months ago, aimed at retirees who want an income REIT portfolio that needs little monitoring.
After my research, discussed below, my view is that there are some improvements that National Retail should implement. To save needless suspense these are the improvements:
- Stop issuing stock until if and when it becomes significantly accretive to shareholders. It is not now.
- Increase their rate of dispositions as needed to sustain their acquisitions.
- Sell their Investment-Grade properties.
Now let’s dig into what makes National Retail tick.
Some History from Cash Flows
I like to look at history to see how a REIT has handled past challenges and opportunities. This speaks to their versatility, can show enduring trends, and can test my modeling of their growth.
Here is a 20-year history of Cash from Operations, or CfO, shown as green bars, and dividends paid (on both common and preferred stock), shown as yellow bars. You can see that the dividends have been well covered by CfO for the past16 years.

You can also see that the retained cash earnings (the difference) have grown. Those earnings can be paired with leverage-neutral new debt and used to acquire new properties without issuing any stock.
National Retail has been bragging for some time that they have been pushing their dividend up and their payout ratio down. This enables a larger volume of internally funded acquisitions. For a 40% Debt Ratio (ratio of debt to total assets), here is the volume of acquisitions that those retained earnings supported.
RP Drake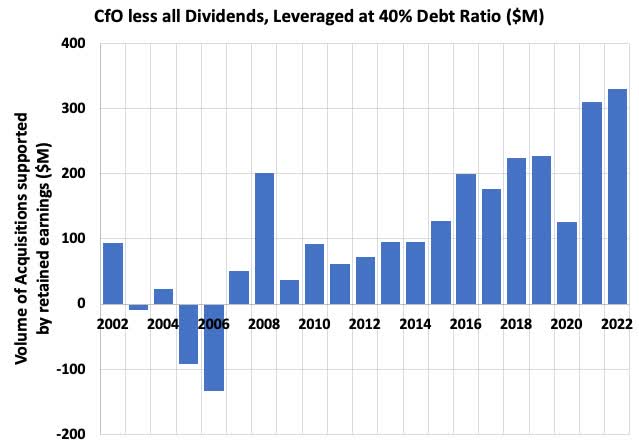
This volume has grown to about 40% of their total acquisitions over the past two years. We will see below that this is very significant.
We can take the cash-flow story a bit further by looking at the total internal sources of capital, from retained earnings, leverage-neutral debt on those, and dispositions. (There can be additional debt leveraging gains on dispositions, but this is small and also unclear from the Statements of Cash Flows, so we leave it out.) We compare these internal sources of capital to acquisitions here:
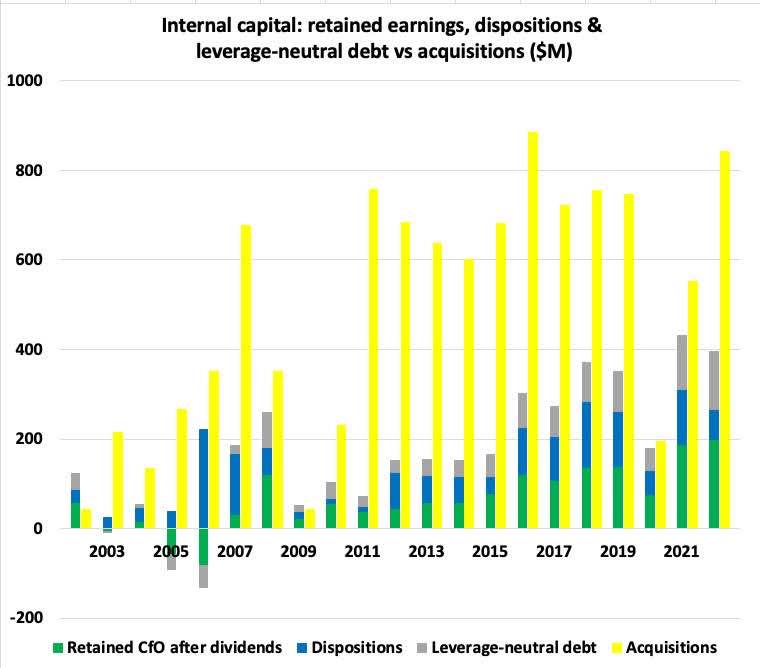
Here the net retained earnings discussed above are shown by the green bars. You can see them growing larger with time.
The dispositions are shown by blue bars, the specified debt by gray bars, and the acquisitions by yellow bars. We can see that a decade ago, the internal sources of capital were about a quarter of the acquisitions. But by 2018 and since, the internal sources were half or more of the acquisitions.
Paying for the remainder of the acquisitions was accomplished by issuing stock and additional debt, still leverage-neutral overall (and over time). We add those in the next graphic with the new stock shown by red bars. We leave out small stuff, specifically the net of other financing and other investing cash flow.
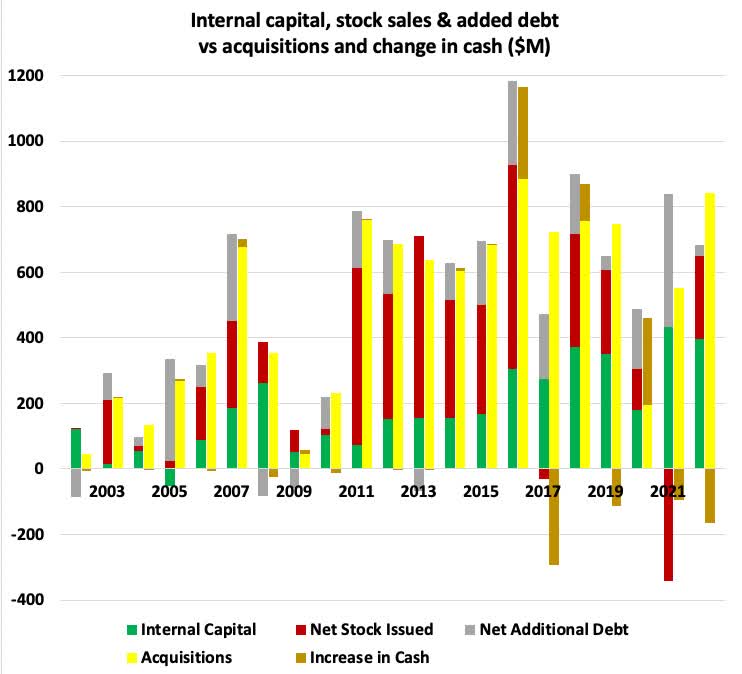
The green bars now show the total internal capital from the previous plot, including the associated, leverage-neutral debt. The yellow bars are again the acquisitions. These were paid for primarily by issuing stock (red bars) in most years from 2011 through 2019. New debt (gray bars), and the internal capital also contributed.
The first decade in this century was a turbulent time. I chose not to unpack that but included that period on some of the plots here as a reminder that what works in one decade may not work in the next.
Much of the past decade has been a good time for National Retail to add per share value by issuing stock to raise capital. It seems in the graphic above that a lot of shares were issued. But on a percentage basis it was not so much, as you can see here:
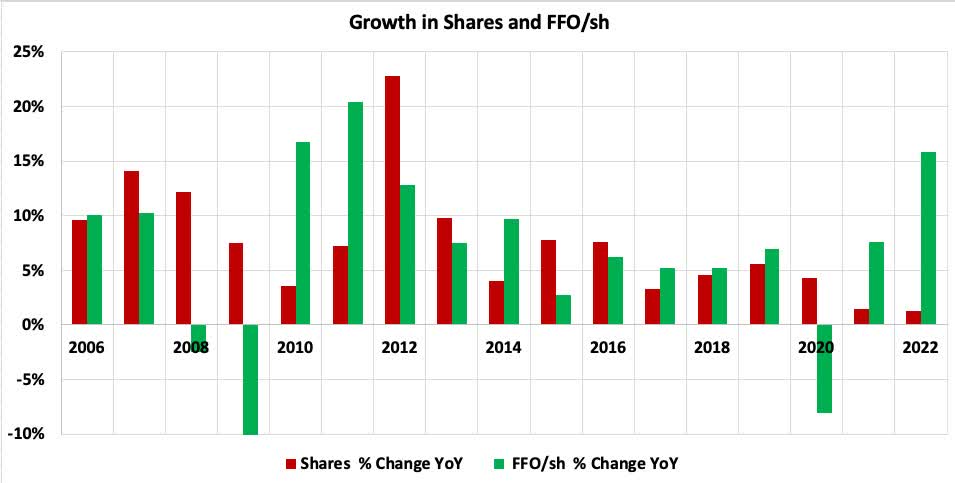
After the turmoil surrounding the Great Recession, the fraction of shares issued each year has not exceeded 10%. And since 2016, it has not exceeded 5%. (The plot shows diluted average shares, which lag the instantaneous share issuance.)
In addition, you can see that the increase in FFO/sh, or Funds From Operations per share, has nearly always been above 5% per year, except during recessions. This increase will be quite small in 2023, as they roll off of post-pandemic tailwinds, but the average of 2022 and 2023 will remain above the average from the teens.
You can also see in the cash-flow graphic above that the acquisitions did not change a lot over the past decade (save for 2020). They ran near $700M per year on average. But the shares issued dropped as the retained earnings increased, even before the pandemic.
The above is where the cash came from and went to. What we care about as potential shareholders is rates of growth per share. Let’s look at that.
Growth of Cash Earnings
We seek to understand how much National Retail can grow earnings going forward and what choices they may have. We will model the year 2014 and the present. The year 2014 was in the middle of those years when the cash flows shown above say that they were doing a lot of external growth, issuing shares to fund expansion.
The main difference between 2014 and 2023 is the difference in retained earnings. As retained earnings go up, the dividend yield above which issuing shares is no longer accretive increases, as I explored in this article.
Here is what happened over the decade from 2012 through 2022:
RP Drake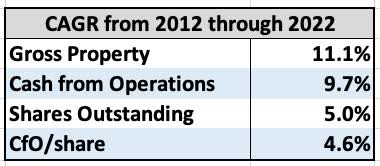
Cash from Operations grew more slowly than Gross Property. I believe this reflects primarily the gradual decline in cap rates.
The shares outstanding grew amply, although some Net Lease REITs issued a lot more shares. This is another way to see that this was a period of external growth.
The overall growth of CfO/share was 4.6%. In a long-term context, that is a very good result for a REIT, though not spectacular. It would have been, though, without the pandemic.
The year-to-year results do vary, of course.
Return on New Equity
We can understand the growth seen above as follows. The underlying fundamental parameter is the return on new equity (or Investment Yield), by which I mean the cash earnings produced when new capital is invested while sustaining the target Debt Ratio.
This return and all the growth rates shown below have a tight mathematical relation to a few key parameters. I discussed these relationships here. See that article for explanations; the Appendix below contains the formulae.
This table shows the pieces and fits them together for the Investment Yield in our two years of interest:
RP Drake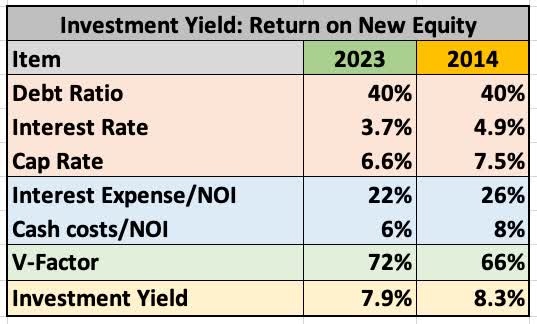
The Debt Ratio, Interest Rate, and Cap Rate, shown in rows shaded orange, combine to produce the interest expenses as a fraction of NOI. (The 2023 Cap Rate is that disclosed for Q4 2022.) The first row shaded blue shows that quantity, while the second shows the Cash costs as a fraction of NOI.
These combine to give Chris Volk’s V-factor, the ratio of cash earnings to NOI. This, with Cap Rate and Debt Ratio, gives the Investment Yield.
We see that the larger cap rate in 2014 more than compensated for the larger interest rate, so that the Investment Yield was 8.3% then vs 7.9% now.
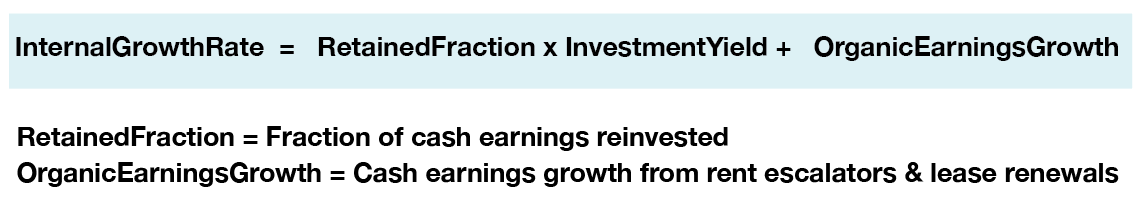
Internal Growth: Rent Bumps, Capital Recycling, and Retained Earnings
To my mind, it makes sense to describe growth funded by retained earnings, capital recycling, and reflecting rent increases as internal growth. For National Retail, their 1.8% rent escalators work through to a 1.6% growth of CfO, for reasons described in this article.
Turning to capital recycling, National Retail brags about two aspects. First, they manage to buy at low cost, giving the tenant low rent. Second, they have a very effective disposition process.
Disposing property means that you lose the NOI it produces. The idea is to get larger NOI when the proceeds are reinvested. But we care about CfO.
What we need to know is the spread in the CfO per unit property value between the new acquisitions and the dispositions. In the Q4 2022 earnings call, we learn that the cap rate for dispositions has run about 50 basis points smaller than that for acquisitions. We will assume that in the following for both years of interest.
That 50 bps gives us the spread in NOI but we need to know the spread in CfO. The reality is that the (unsecured) debt and the G&A costs associated with the dispositions will not drop and then reappear when the proceeds are used for acquisitions. But treating them that way avoids substantial complications in the calculation.
So what we can do is to evaluate a ratio of lost CfO to lost NOI by assuming that G&A and Debt are reduced in proportion to the lost NOI, and then find a Disposition Yield based on the disposition cap rate. Then we assign the Investment Yield discussed above to the following acquisitions, effectively assuming that the G&A and Debt come back.
That way, the spread from Investment Yield to Disposition Yield determines the gain in CfO produced by the recycling process. Here are how things add up for internal growth, for the years of interest:
RP Drake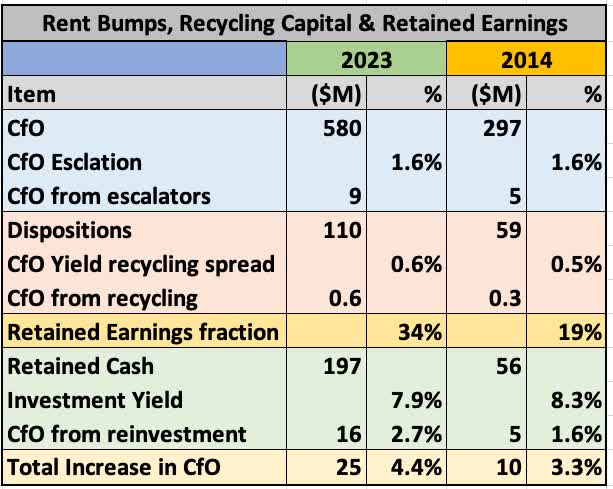
The rows shaded blue evaluate the increase in CfO produced by the rent bumps. Those in orange evaluate the increase in CfO from capital recycling, using the calculation described above. The dispositions were about 20% of CfO in both years.
The following row, shaded gold, shows the most important difference between the two years. The retained earnings were 19% in 2014 but increased to 34% in 2022 and will be comparably high in 2023. This proves to be a big difference, somewhat here and more for external growth, discussed below.
That fraction of retained earnings generates the retained cash, shown in the first row in green. Multiplying that by the Investment Yield gets you the new CfO from reinvestment, shown on the third row in green.
Combining all sources of internal growth one finds that the rate of increase in CfO (and in CfO/sh if there is no share issuance) grew from 3.3% to 4.4% from 2014 to 2023. The impact of an increased fraction of retained earnings was stronger than the impact of a smaller Investment Yield.
It is worth emphasizing what National Retail can do now. They can invest their nearly $200M of retained cash earnings at that 7.9% yield to generate an additional $16M of CfO, an increase of 2.7%.
(National Retail comes up with $188M of retained earnings, not the $197M that is straight from the Statements of Cash Flows. The origin of the difference is not clear to me, but also small enough not to matter.)
That increase requires only proportional debt. More importantly, it requires no issuance of stock. All the typical discussions of spreads and of WACC have zero application here (including the one on p. 33 of their Institutional Investor Presentation).
Just make your money, reinvest it, and compound from there.
In combination, rent growth, capital recycling, and reinvested earnings can now grow CfO at a rate above 4%.
Here is how it looks to me: National Retail can grow cash earnings per share today, without issuing any stock, at nearly the rate they managed during the past decade.
Let’s look at the impact of issuing stock.
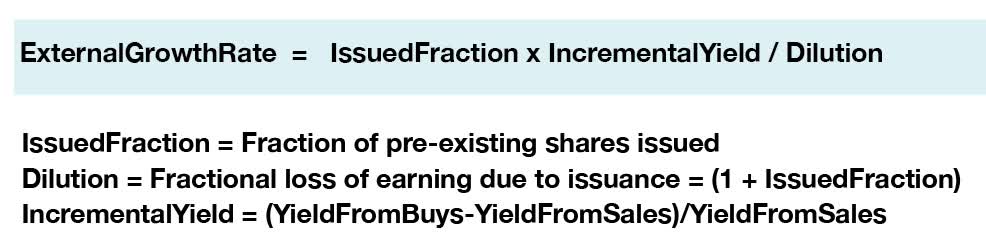
External Growth: Not So Hot Any More
Growing by issuing shares (diluting existing shareholders), raising leverage-neutral debt, and buying more properties is more complex. The market controls the price you can get for your shares; you do not.
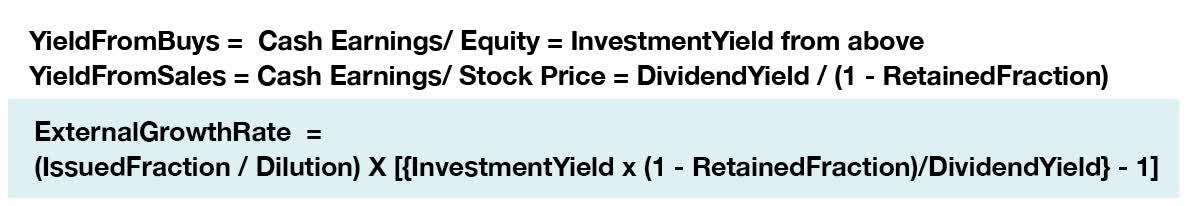
As you sell shares, there is an earnings yield found by dividing your cash earnings by the price. This has two parts, a dividend yield and a yield on the retained earnings.
You control the fraction of earnings that are retained. You also control how much stock to issue. That stock provides capital but also dilutes all earnings. The question becomes how much total growth you generate as you issue more stock, depending on the dividend yield and on the retained earnings.
First we will look at the year 2014, from the period when share issuance (plus leverage) was providing about 3/4 of the funds for acquisitions. Importantly, the retained earnings were 19% and dispositions were 20% of CfO. We can display how this worked out, based on the math in the appendix, in a contour plot:
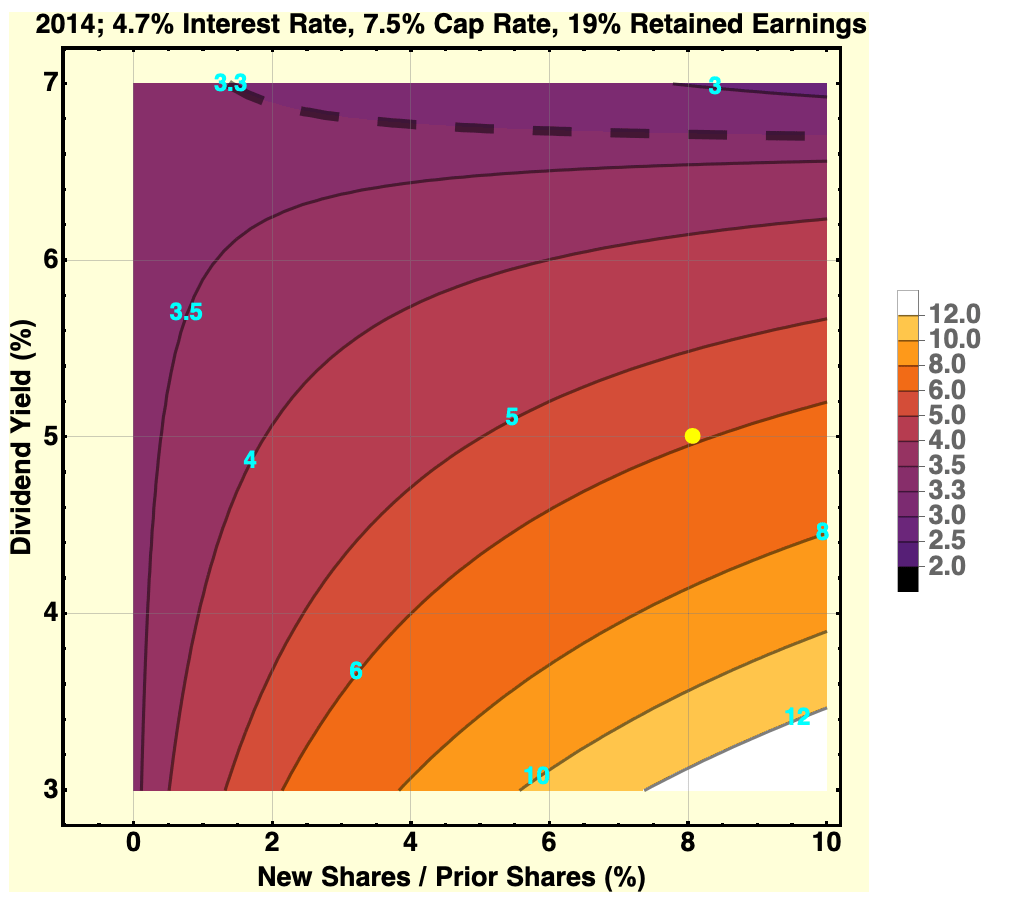
This shows by contours and color the total growth rate of cash earnings per share. The contours are labeled by the growth rate. The heavy, dashed contour shows the contour for the internal growth rate of 3.3% they could get in 2014 without issuing new shares.
In 2014, National raised $360M at a 5% dividend yield. At the time the Market Cap was about $4400M, so they diluted the shareholders by about 8.1%. The yellow dot shows that location on the contour plot.
The calculation says that cash earnings per share should have increased about 6%. When these show up is delayed, as most acquisitions occur late in the year. CfO/sh growth in 2015 was 6.6%. During that period, the share issuance roughly doubled the earnings growth rate.
From this it appears that we have a reasonable model of how National Retail grows earnings. Now let’s look at the present era when the retained earnings have moved to 34%, dispositions are still 20%, and the cap rate has dropped to 6.6%.
RP Drake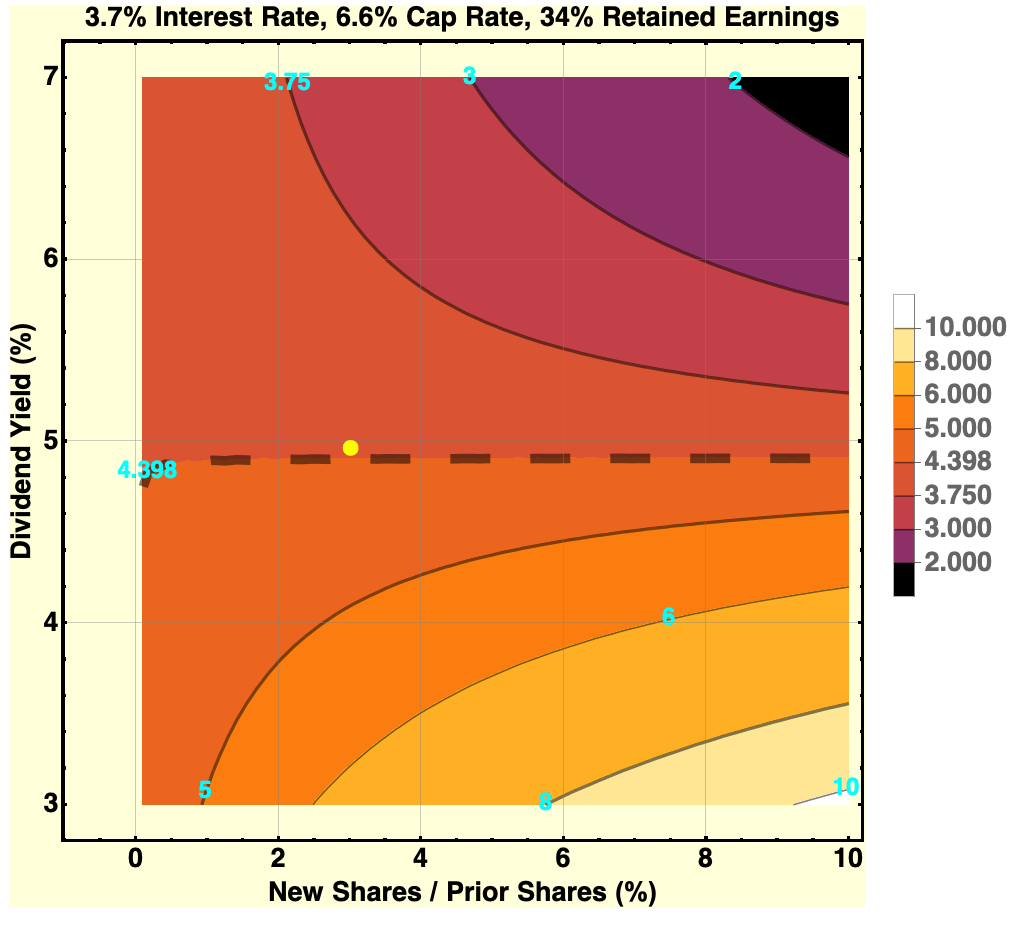
Here the heavy, dashed contour corresponds to the growth rate for which share issuance produces no increase in cash earnings per share, just below 4.4%. The combination of lower cap rate and higher retained earnings has pushed down the threshold dividend yield above which share issuance is not accretive to per share earnings.
Also, the yellow dot shows what they did in 2022. They diluted shareholders by 3.1% at a dividend yield of 4.9%.
From the point of view of increasing per share earnings, this dilution was pointless. The earnings growth produced by the 2022 acquisitions (most showing up in 2023) would have been the same if they had issued no equity.
In the earnings call, National Retail emphasized that they got an opportunity in the brokered market to purchase a portfolio of drug stores for what they considered a compelling price. But if they just operate those drug stores, they will have done nothing significant for shareholders.
On the other hand, if the plan is to sell that portfolio once the property market rebounds, that could be beneficial. But if that is the plan then so far, we have seen no hint of it in their disclosures.
One can see in the plot that issuing shares when the dividend yield is above about 5% is dilutive to per share cash earnings under present conditions. That is for the indicated cap rate and interest rate. Modest changes in the interest rate move the contours around in intuitive ways, but do not create big changes.
Increases in cap rate do have a positive effect. They are likely to come with increases in interest rates, too. Suppose cap rates go to 7.5% and interest rates increase to 4.5%. In this case the internal growth rate would increase to 4.8%. Here is what one would then have for external growth:
RP Drake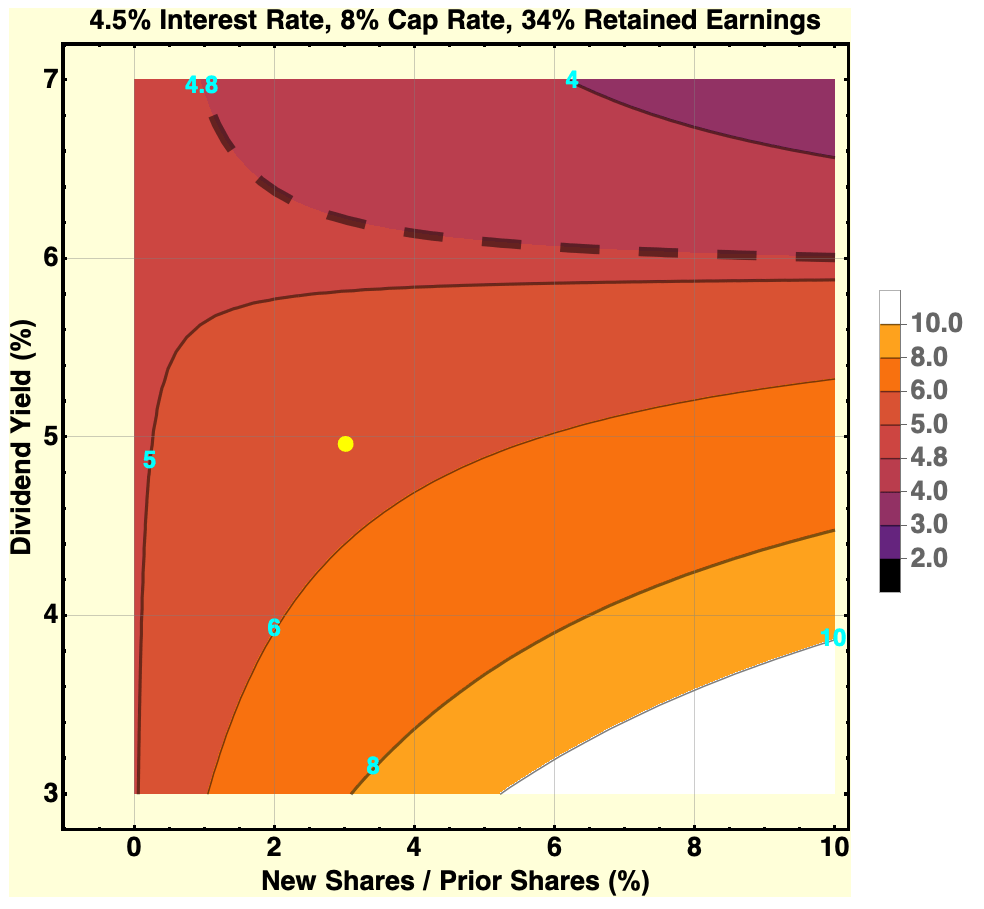
Now the heavy, dashed curve corresponds to the growth rate of 4.8% for no equity issuance. The yellow dot still shows the 2022 share issuance.
Now there would be a benefit from issuing shares. But it is pretty small, being near a one percent increase in earnings growth rate for reasonable share quantities. It seems to me National Retail would still be at the point of diminishing returns for share issuance even with increased cap rates.
Putting this together generates this picture. National Retail took advantage of the low earnings yields of the past decade to grow earnings per share and to push up their retained earnings while also increasing their dividend. This has pushed them into a new regime vis a vis issuing shares.
At today’s dividend yield of 4.9%, they cannot increase CfO/sh by issuing stock. But even if the yield comes back down near 4%, the returns for doing so are limited and may represent diminishing returns.
The historical dividend yield on NNN gives some perspective in thinking about likely future circumstances.
YCHARTS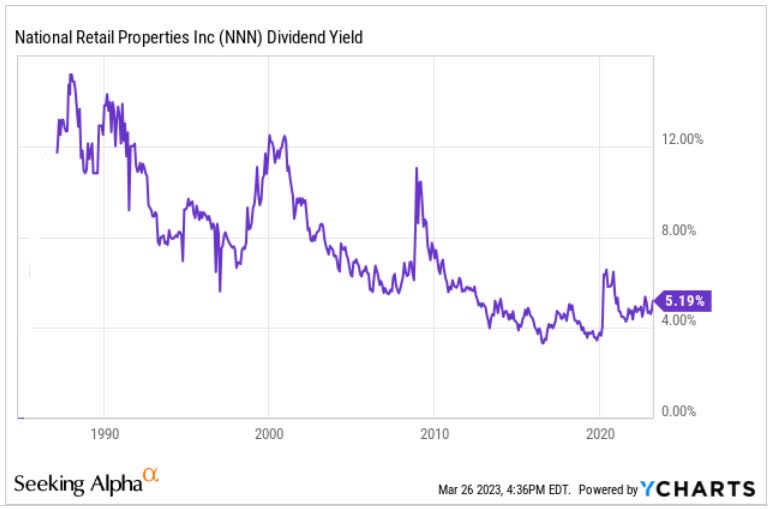
The historical yield spent the teens above 4% on average, but mostly below 5%. Earlier than that dividend yields were higher, as were cap rates. For example, cap rates were above 8% in 2011 and 2012 when dividend yields were near 6%.
Now yields might plummet below 4% soon, restoring the power of equity from share issuance to significantly increase earnings growth. But yields also might continue a bumpy climb upward as the economy overall proceeds into its next phase.
It seems to me far from certain and even unlikely that issuing shares will be an effective way to add shareholder value anytime soon.
Volumes
A substantial part of activity for such a REIT involves developing a pipeline of future acquisitions and then closing deals that add to the property portfolio. In their recent institutional investor presentation, National Retail reported ownership of 3,411 properties.
We saw above that acquisitions have run near $700M per year over the past decade. The reported acquisition cost averages a bit below $3M per property, so to sustain that pace they need to close over 200 deals per year. That’s an average of a few a week.
National Retail has ongoing relationships with management of about 25 growing retail concepts. Their “relationship based acquisitions” over the past 5 years have averaged $460M per year. To sustain the ability to grow from those sources, they need to continue to support the needs of those corporations.
There may be some tension between the need to do this and the need to deploy capital only in ways that are accretive to shareholders. As we saw above, this tension is a new thing arising from high retained earnings and low stock prices.
In this context, I hope National Retail pays attention to balancing the long-term needs of the business with shareholder value. Assuring ever-higher volumes and going after “good deals” is not necessarily the best course. And as discussed above, it is far from clear that their recent purchase of drug stores was the best course.
National Retail has guided for lower acquisitions during 2023, as have many other REITs. From their Q4 2022 earnings call:
We have the option keeping leverage neutral to use a reasonable amount of availability of the credit facility to roughly $180 million of free cash flow plus $110 million of dispositions to execute our 2023 strategy. Using those three sources, as I mentioned, leaves NNN with a manageable equity requirement for the year.”
This is slightly disturbing, as follows. Why issue any equity at all when it is not accretive? Just so you can follow some plan? There are other ways to do that.
Looking beyond the current disruptions, suppose you want $700M of acquisitions going forward, on average. The 40% debt will be about $300M, so you need $400M of new capital.
The retained earnings will be about $200M of that. So they will need another $200M.
Historic dispositions have run about $100M and stock issuance over the prior 3 years has averaged $130M. My preference is that they not go back to issuing stock when it produces very little benefit to shareholders. It would make more sense to issue no stock and to up the dispositions to near $200M.
The current $100M of dispositions is only 1% of Gross Property. A higher rate would enable improvement of the portfolio. It also would provide more security related to debt, which matures at a rate somewhat above $350M per year.
Beyond that, it is hard to see the value of holding onto their properties that have moved to investment grade after purchase. Those are now more valuable because the markets overvalue their apparent security.
But they can’t produce any additional income. So sell them unless there are compelling reasons not to do so.
With the disruption of the capital markets this year, some Net Lease REITs are finding compelling opportunities. The point worth making is that for the circumstances of National Retail specifically it takes a really big increase of cap rate to generate significant shareholder accretion.
Deals that would require doubling the acquisition volume and only increase shareholder returns from 4% to 5% are not obviously worth doing. Adding volume comes with costs and risks, too. Beyond that, the longer it takes for National Retail to grow to the point that shareholder returns are harder to come by, as Realty Income (O) already has, the better for shareholders.
Valuation
It is sensible to look at P/FFO for NNN, since FFO, AFFO, and CfO don’t differ much. CfO averages about 10% more than FFO, so perhaps prices should be 10% higher than one might think. But that is in the noise.
Here is the history of P/FFO, from TIKR:
TIKR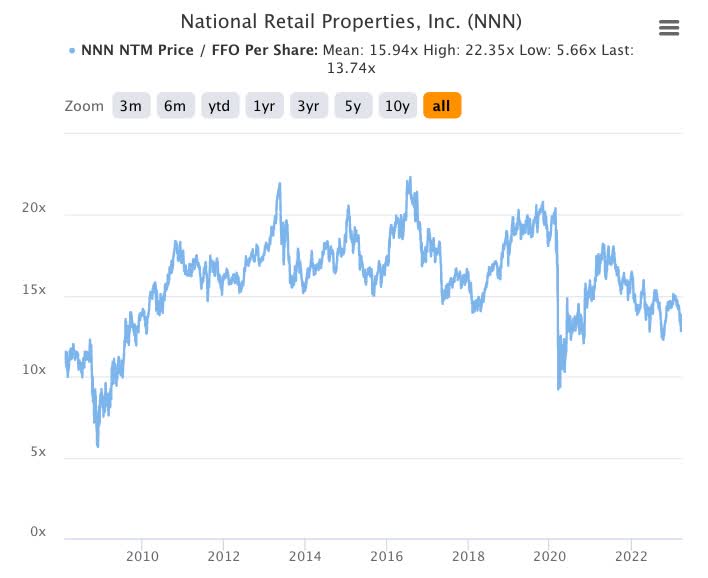
On the one hand, NNN was priced at a P/FFO averaging 17x through the teens. On the other hand, forward growth may be a bit slower and discount rates may be a bit higher. That said, they can grow for a very, very long time on their business model.
If we use a 10% discount rate and 4% growth rate, indefinitely, then we get a ratio of about 17x. If we increase the discount rate to 12%, this drops to 13x, a bit below today’s pricing.
So NNN is certainly undervalued compared to recent history. And there is a good chance the stock price will increase going forward. But a return to 17x, let alone 20x, is far from assured.
Takeaways
My take is that it makes a lot of sense to buy NNN stock for modestly growing, very safe dividends. They will grow earnings and dividends at about 4% per year. With their dividend yield near 5%, the total returns will be in the high single digits.
But substantial upside is more of a crapshoot on where the broad markets go. So whether or not NNN is for you depends on who you are as an investor.
That said, let me repeat the actions it makes sense to me for National Retail to take.
- Stop issuing stock until if and when it becomes significantly accretive to shareholders. It is not now.
- Increase their rate of dispositions as needed to sustain their acquisitions.
- Sell their Investment-Grade Properties
We will see in about a year what National Retail has done in 2023 and plans for 2024.
Appendix: Just the Math
One can reproduce all the theoretical results in this article using the following bits of math. The central ideas that the math implements are those of Chris Volk.
RP Drake RP Drake RP Drake RP Drake RP Drake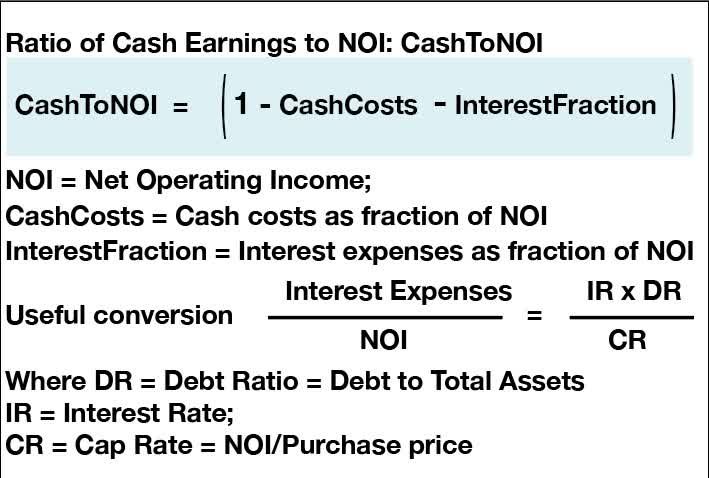

RP Drake
If you want access to our entire Portfolio and all our current Top Picks, feel free to join us for a 2-week free trial at High Yield Landlord.
We are the largest real estate investment community on Seeking Alpha with over 2,000 members on board and a perfect 5/5 rating from 400+ reviews:
![]()
For a Limited Time - You can join us at a deeply reduced rate!
Start Your 2-Week Free Trial Today!

This article was written by

Paul brings substantial experience in research, and in understanding and developing models of uncertain systems, from his decades working as a physicist. He wrote his first Monte Carlo model aimed at investments in 2006. He has intensively researched and modeled a wide variety of portfolio options. Among other degrees, he holds a doctorate in physics and a bachelors in philosophy. His career began with running large projects for a major research laboratory, and continued with a long, and award-winning run as a professor at the University of Michigan. He has authored nearly 300 articles published in formal academic journals, and two editions of a textbook.
Analyst’s Disclosure: I/we have a beneficial long position in the shares of SPG, EPR either through stock ownership, options, or other derivatives. I wrote this article myself, and it expresses my own opinions. I am not receiving compensation for it (other than from Seeking Alpha). I have no business relationship with any company whose stock is mentioned in this article.
Seeking Alpha's Disclosure: Past performance is no guarantee of future results. No recommendation or advice is being given as to whether any investment is suitable for a particular investor. Any views or opinions expressed above may not reflect those of Seeking Alpha as a whole. Seeking Alpha is not a licensed securities dealer, broker or US investment adviser or investment bank. Our analysts are third party authors that include both professional investors and individual investors who may not be licensed or certified by any institute or regulatory body.