49 Ideal April Value Buys From Ben Graham

Summary
- “Value ranking looks at the price of a stock relative to intrinsic firm value. Graham Value Stocks match the criteria. Benjamin Graham followed.“ - YCharts Value Screener.
- 68 April Value Rank and Graham Formula results reflect established value-stock detection criteria. Of those, 49 met the dogcatcher ideal of dividends from $1K invested exceeding single share stock prices.
- Representing nine-of-eleven Morningstar Sectors, all 49 pay regular dividends. Broker-target-top-ten All-Star-Value dividend-paying net gains ranged 36.96%-124.45%, topped by FFWM & PACW, as of 4/6/23.
- By yield, TRMD leads the top-ten All-Star-Value field of BSMX, ZIM, ET, PACW, ORCC, PXD, ICL, HIMX, LPG, & TRMD. The ten averaged 15.79% yield. All-Star-Value top-ten by broker-target-price upsides were ING, CG, TFC, HT, NTB, CMA, SBSW, BSET, PACW, and FFWM, averaging 63.82%.
- $5k invested April 6 in the five top-yield, lowest-priced, All-Star Value stocks projected 9.61% more net gain than from $5k invested in all top ten. Little (lower-priced) equities returned to lead the top-ten April All-Star Value-derived dividend dogs by near one length, per analyst estimates.
- Looking for a portfolio of ideas like this one? Members of The Dividend Dog Catcher get exclusive access to our subscriber-only portfolios. Learn More »
damedeeso
Foreword
About Large-Cap Value
A Value ranking for large-cap stocks from YCharts puts together complementary strategies found during their stock research. As a value ranking, it looks at the price of a stock relative to a number of measurements that determine intrinsic firm value. Only the largest 10% of companies based on market cap are allowed in this portfolio.
What it is: The Value Score is a composite score. It tells you how much you are getting in terms of profits, cash flows, assets, sales, etc. for the stock price that you pay. It is a relative measurement, so it says nothing about the overall level of the market. Rather, it answers the question: “Given the current market level, which stocks give you the most current value for your dollar of investment?” Tens are the most value, and 1s are the least.
How to use it: Use it to find companies that are selling at a low price relative to their assets and profits.
Limitations of the Value Score: Watch out for companies with a lot of uncertainty or bad prospects for the future (e.g., Pharma companies with expiring patents, industries on the decline, etc.).
About the Ben Graham Formula
The Ben Graham Formula strategy contains ultra-stable stocks that will infrequently lose money if held over a long period of time. It was developed based on a screen in Graham's book, “The Intelligent Investor.” For those who have the book, it is the "Defensive Investor" screen. It selects stocks that are large in terms of sales and total assets, have a strong track record of earnings and dividend payments, have a reasonable current ratio and level of long-term debt, and have a low valuation given by PE Ratios and Price to Book Value ratios.
—YCharts
While 19 out of this collection of 68 All-Star-Value Dividend stocks are too pricey to justify their skinny dividends, the remaining 49 of the 68, by yield, live up to the ideal of offering annual dividends (from a $1K investment) exceeding their price per share.
This list of April All-Star-Value stocks did NOT discard two stocks showing outlandish yield numbers, namely TRMD and LPG. Their yields were not scaled back by the author.
49 Ideal Value Dogs for April
Source: YCharts.com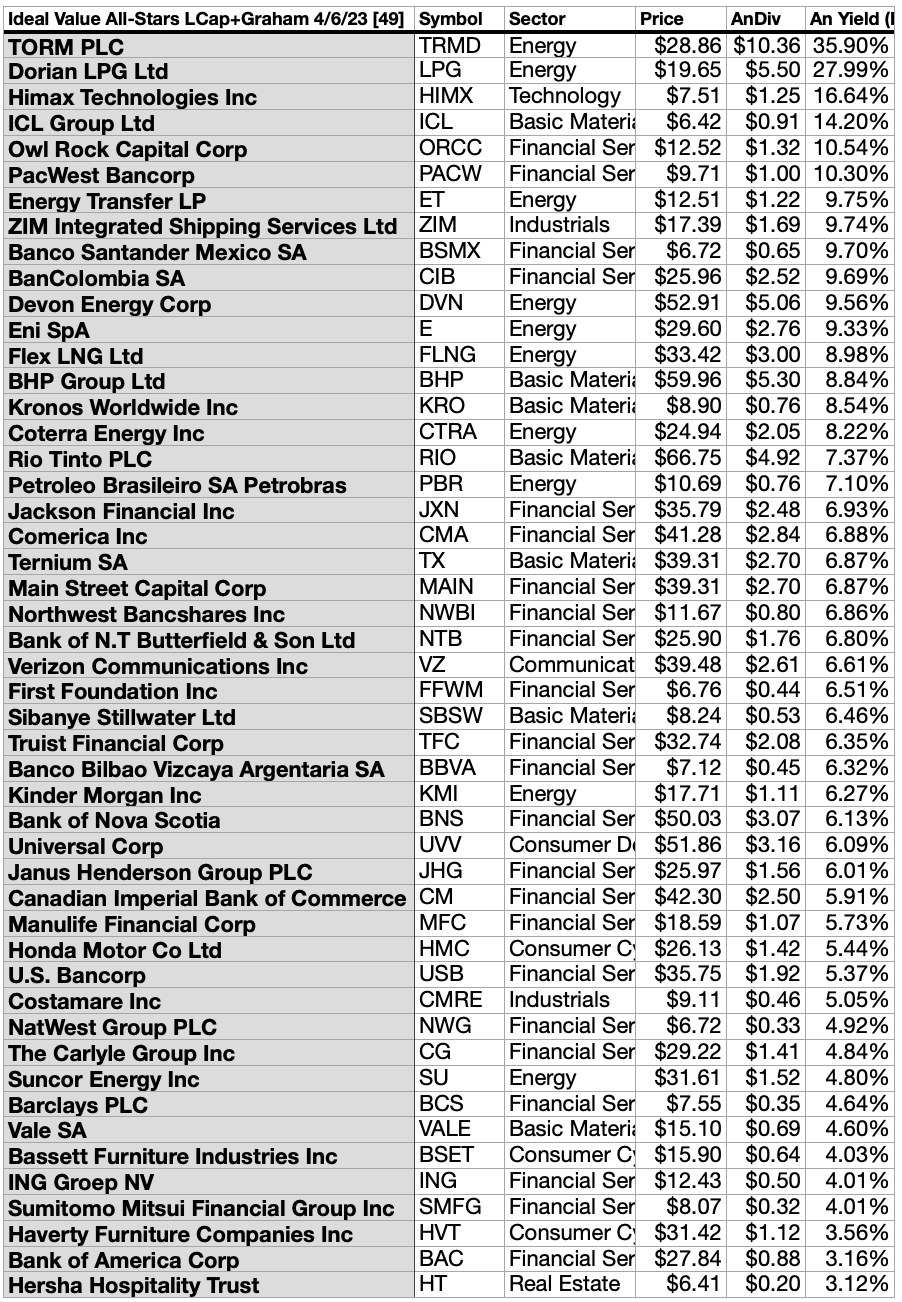
In the current market swing, the dividends from $1k investments in 49 of the 68 stocks listed above, met or exceeded their single share prices as of 4/6/23.
As we are now past the third anniversary of the 2020 Ides of March dip, the time to snap up some of the 49 top-yield All-Star-Value dogs is now... unless another big bearish drop in price looms ahead. (At which time, your strategy would be to add to your position in any of these you then hold.)
Actionable Conclusions (1-10): Analysts Estimate 36.96% To 124.45% Top Ten All-Star-Value Net Gains To April 2024
Three of the ten top picks by yield were verified as also being among the top ten gainers for the coming year based on analyst 1-year target prices. (They are tinted gray in the chart below). Thus, this yield-based forecast for All-Star-Value derived dividend dogs (as graded by Brokers) was 30% accurate.
Estimated dividend returns from $1000 invested in each of the highest-yielding stocks and their aggregate one-year analyst median target prices, as reported by YCharts, created these 2023-24 data points. (Note: target prices by lone analysts were not used.) Ten probable profit-generating trades projected to April 6, 2024 were:
Source: YCharts.com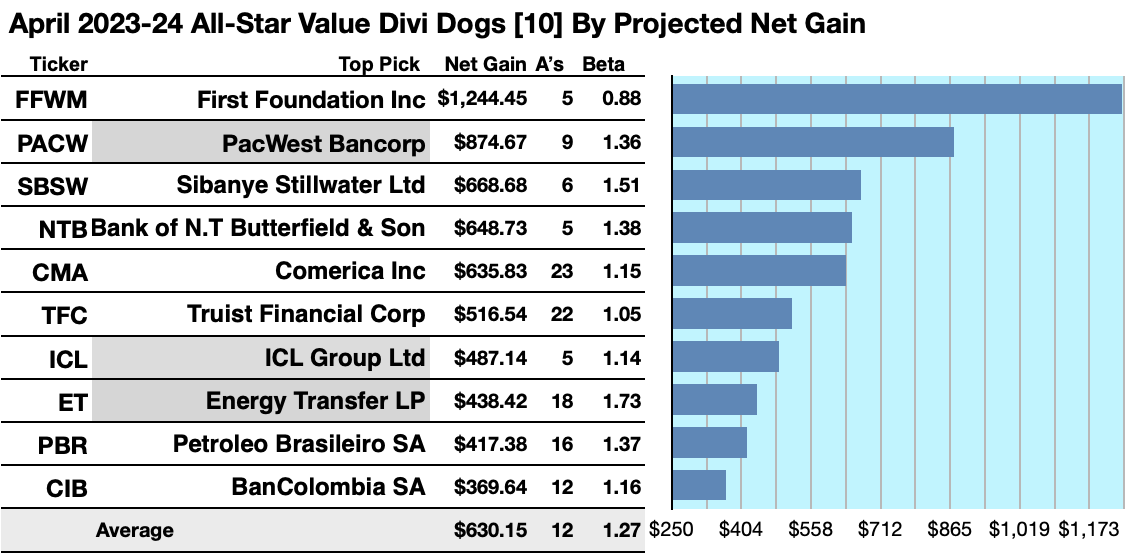
First Foundation Inc. (FFWM) was projected to net $1.244.45, based on the median of target price estimates from 5 analysts, plus dividends, less broker fees. The Beta number showed this estimate subject to risk/volatility 12% less than the market as a whole.
PacWest Bancorp (PACW) was projected to net $874.67, based on a median of target estimates from 9 analysts, plus dividends, less broker fees. The Beta number showed this estimate subject to risk/volatility 36% greater than the market as a whole.
Sibanye Stillwater Ltd (SBSW) was projected to net $668.68, based on the median of target price estimates from 6 analysts, plus the estimated annual dividend, less broker fees. The Beta number showed this estimate subject to risk/volatility 51% greater than the market as a whole.
Bank of N.T. Butterfield & Son Ltd (NTB) netted $648.73 based on a median target price estimate from 5 analysts, plus dividends, less broker fees. The Beta number showed this estimate subject to risk/volatility 38% greater than the market as a whole.
Comerica Inc (CMA) was projected to net $635.83, based on dividends, plus the median of target price estimates from 23 analysts, less broker fees. The Beta number showed this estimate subject to risk/volatility 15% greater than the market as a whole.
Truist Financial Corp (TFC) was projected to net $516.54, based on dividends, plus the median of target price estimates from 22 analysts, less broker fees. The Beta number showed this estimate subject to risk/volatility 5% greater than the market as a whole.
ICL Group Ltd (ICL) was projected to net $487.14, based on dividends, plus the median of target price estimates from 5 analysts, less broker fees. The Beta number showed this estimate subject to risk/volatility 14% greater than the market as a whole.
Energy Transfer LP (ET) was projected to net 438.42, based on a median target price estimates from 18 analysts, plus dividends, less broker fees. The Beta number showed this estimate subject to risk/volatility 73% over the market as a whole.
Petróleo Brasileiro S.A. - Petrobras (PBR) was projected to net $417.38, based on dividends, plus the median of target price estimates from 16 analysts, less broker fees. The Beta number showed this estimate subject to risk/volatility 37% over the market as a whole.
Bancolombia SA (CIB) was projected to net $369.64 based on dividends, plus the median of target price estimates from 12 analysts, less broker fees. The Beta number showed this estimate subject to risk/volatility 16% more than the market as a whole.
The average net gain in dividend and price was estimated to be 63.02% on $10k invested as $1k in each of these ten stocks. The average Beta showed these estimates subject to risk/volatility 27% greater than the market as a whole.
Source: Open source dog art from dividenddogcatcher.com
The Dividend Dogs Rule
Stocks earned the "dog" moniker by exhibiting three traits: (1) paying reliable, repeating dividends, (2) their prices fell to where (3) yield (dividend/price) grew higher than their peers. Thus, the highest-yielding stocks in any collection became known as "dogs." More precisely, these are, in fact, best called, "underdogs".
Top 50 All-Star-Value Picks By Broker 1Yr Price Targets
Source: YCharts.com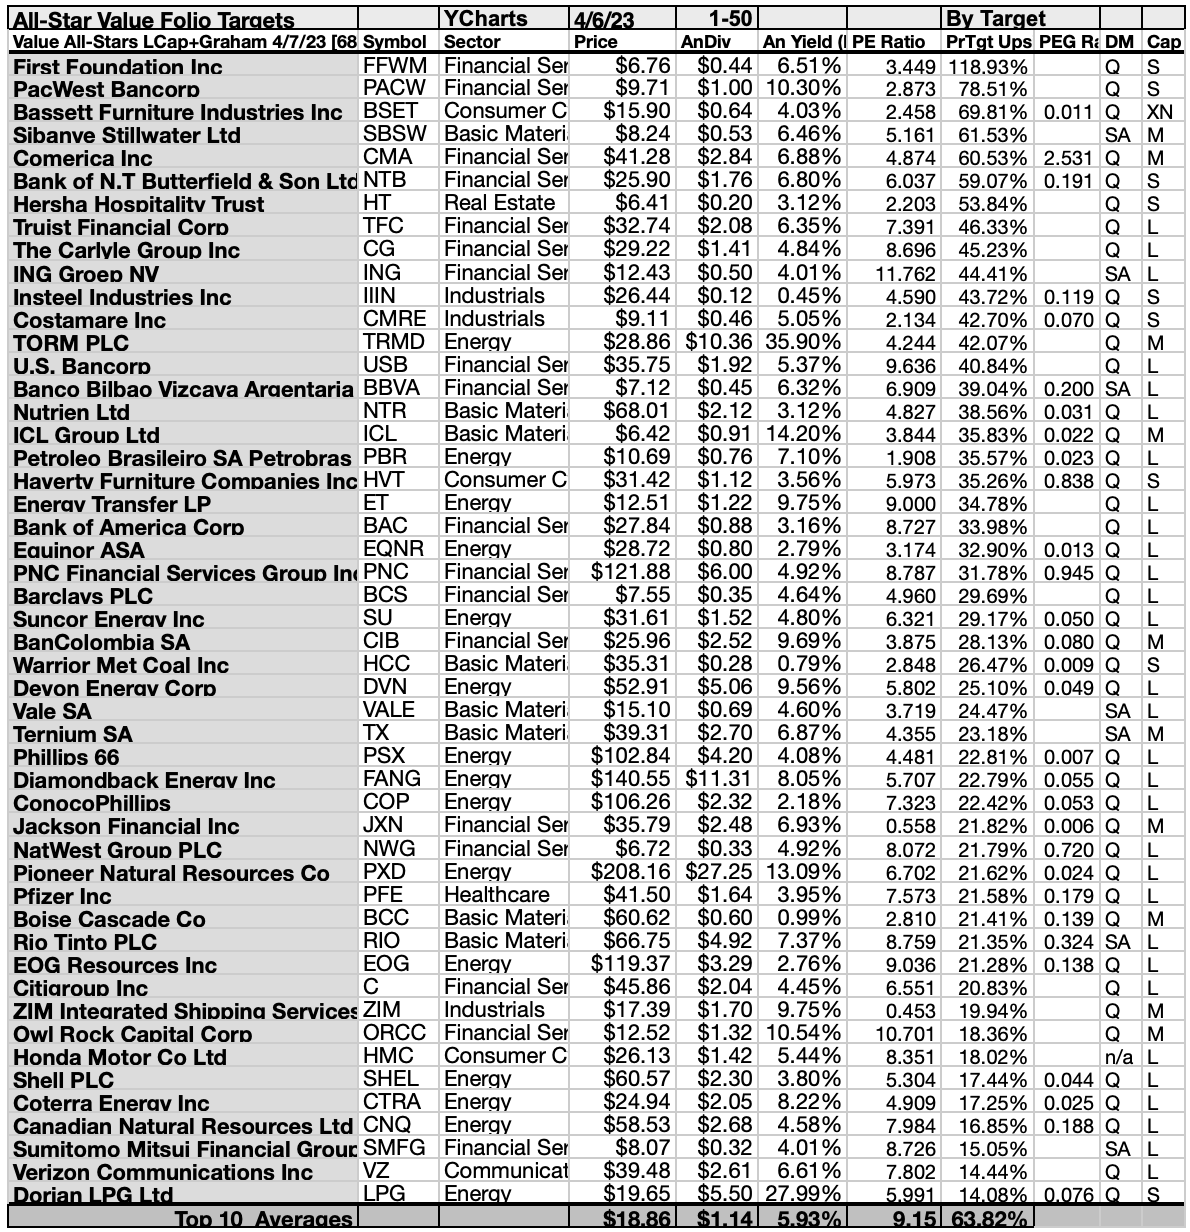
This scale of broker-estimated upside (or downside) for stock prices provides a scale of market popularity. Note: no broker coverage or 1 broker coverage produced a zero score on the above scale. This scale can be taken as an emotional component as opposed to the strictly monetary and objective dividend/price yield-driven report below. As noted above, these scores may also be taken as contrarian.
Top 50 All-Star-Value Picks By Annual Dividend Yield
Source: YCharts.com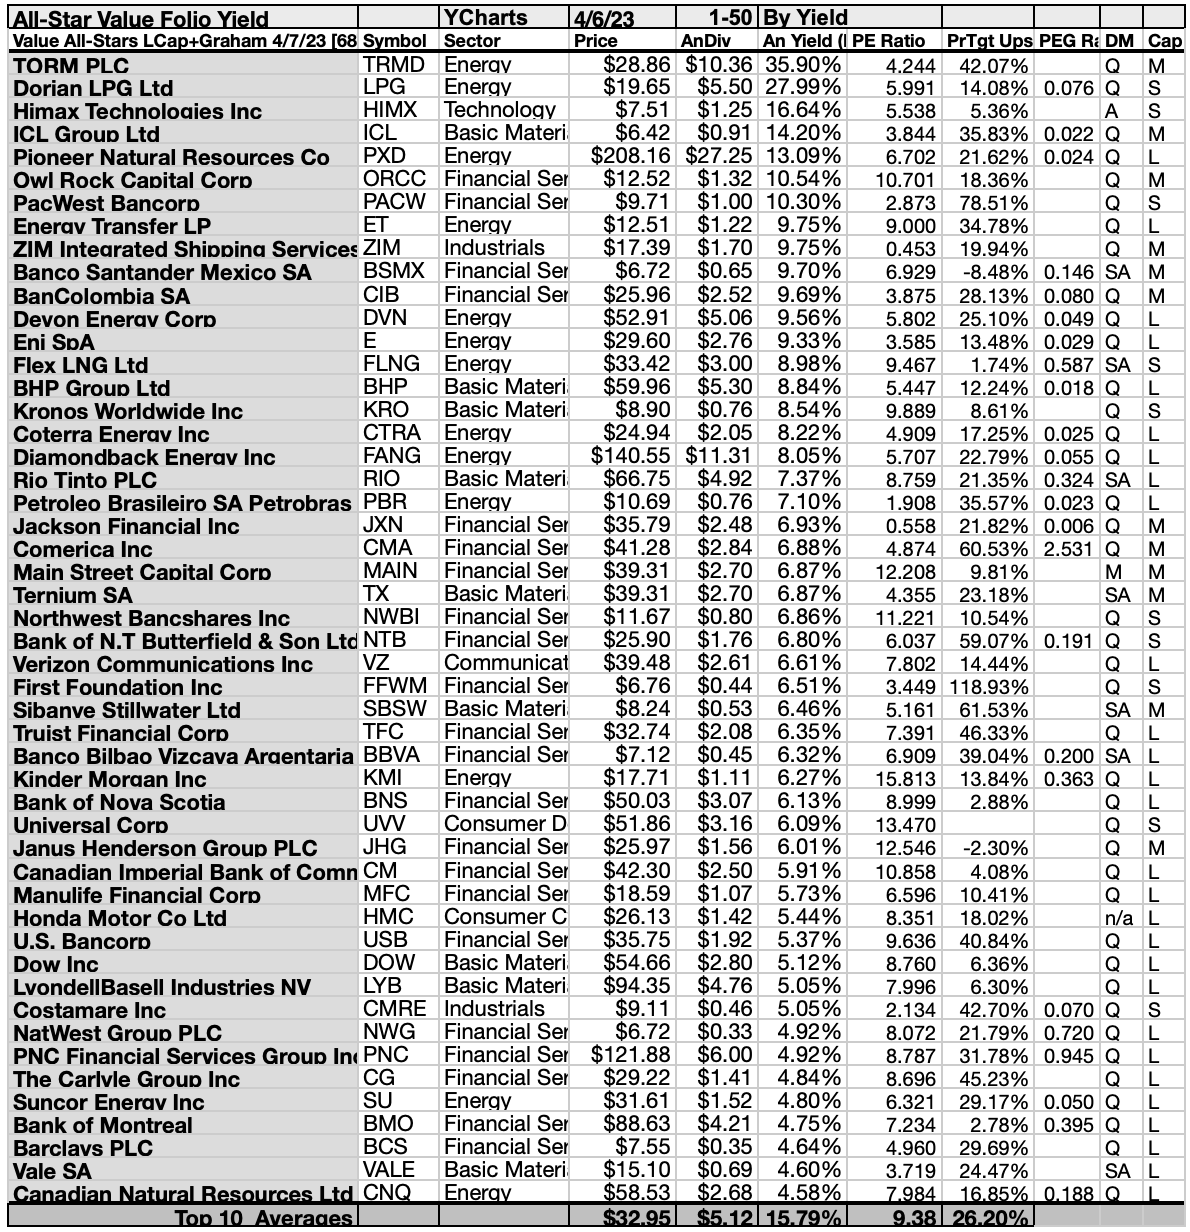
Actionable Conclusions (11-20): Ten Top Stocks By Yield Are The April Dogs of The All-Star-Value Pack
Top ten All-Star-Value stocks selected on 4/6/23 by yield represented four of eleven Morningstar sectors. First place was secured by the first of four energy sector representatives, TORM plc (TRMD), followed by Dorian LPG Ltd (LPG) [2]. Others placed fifth and eighth, Pioneer Natural Resources Co (PXD) [5], Energy Transfer [8].
The lone technology member, placed third, Himax Technologies Inc (HIMX) [3]. Then, one basic materials representative placed fourth, ICL Group Ltd [4].
Three financial services representatives placed sixth, seventh, and tenth, Owl Rock Capital Corp (ORCC) [7], PacWest Bancorp [7], and Banco Santander Mexico SA (BSMX) [10].
Finally, the lone industrial member in the top ten laced ninth, ZIM Integrated Shipping Services Ltd (ZIM) [9] to complete this All-Star-Value top ten, by yield, for April.
Source: YCharts.com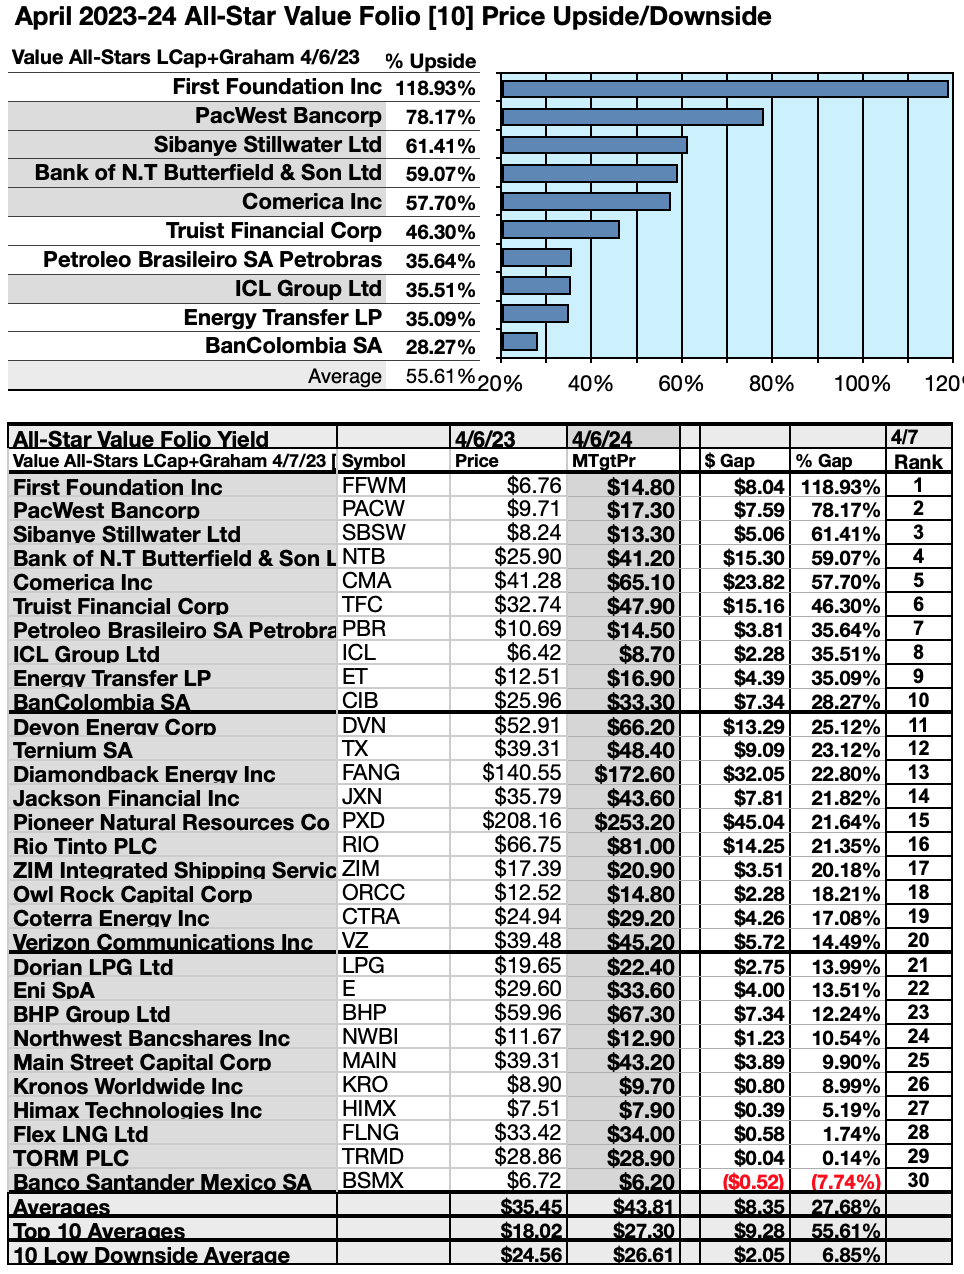
Actionable Conclusions: (21-30) Ten All-Star-Value Dividend Stocks Showed 28.27% To 118.93% Upsides To April 2024, With (31) One -7.74% Loser
To quantify top-yield rankings, analyst median price target estimates provided a "market sentiment" gauge of upside potential. Added to the simple high-yield metrics, analyst median price target estimates became another tool to dig out bargains.
Analysts Estimated A 9.61% Advantage For 5 Highest Yield, Lowest Priced of Top Ten All-Star-Value Dogs To April 2024
Ten top All-Star-Value stocks were culled by yield for this monthly update. Those (dividend/price) results provided by YCharts did the ranking.
Source: YCharts.com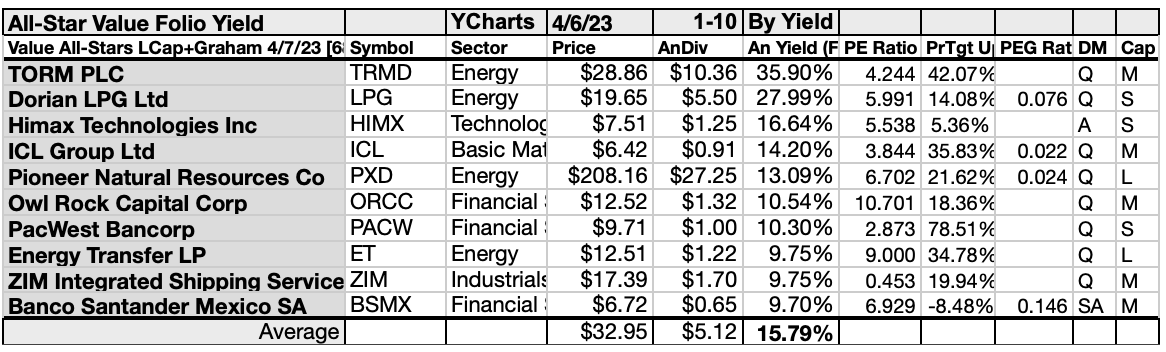
As noted above, top ten All-Star-Value Dogs selected on 4/6/23, showing the highest dividend yields, represented six of eleven sectors in the Morningstar scheme.
Actionable Conclusions: Analysts Estimated The 5 Lowest-Priced Of Ten Highest-Yield All-Star-Value Dividend Stocks (33) Delivering 40.36% Vs. (34) 36.83% Net Gains by All Ten by April 2024
Source: YCharts.com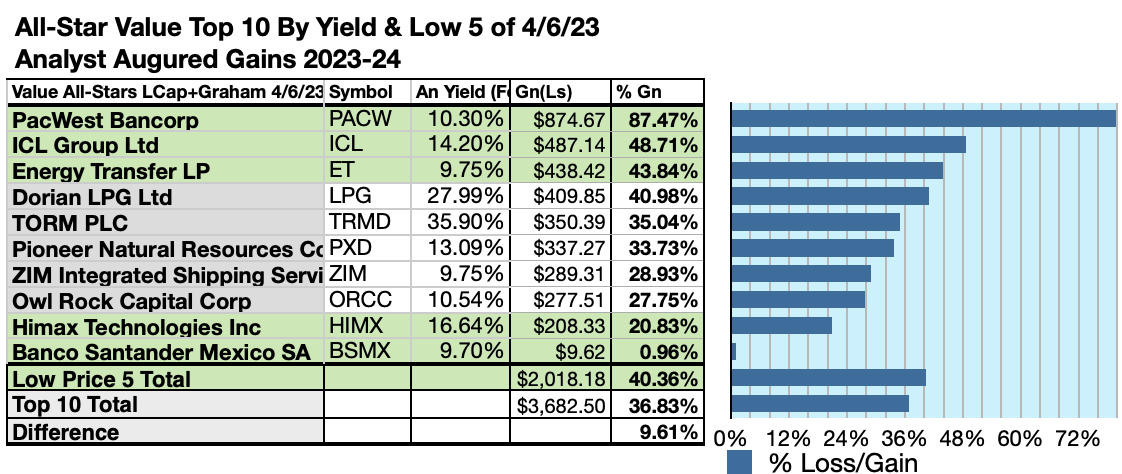
$5000 invested as $1k in each of the five lowest-priced stocks in the top ten All-Star-Value dividend pack, by yield, were predicted by analyst 1-year targets to deliver 9.81% more gain than $5,000 invested as $.5k in all ten. The fourth lowest-priced All-Star-Value top-yield stock, PacWest Bancorp, was projected to deliver the best net gain of 87.47%.
Source: YCharts.com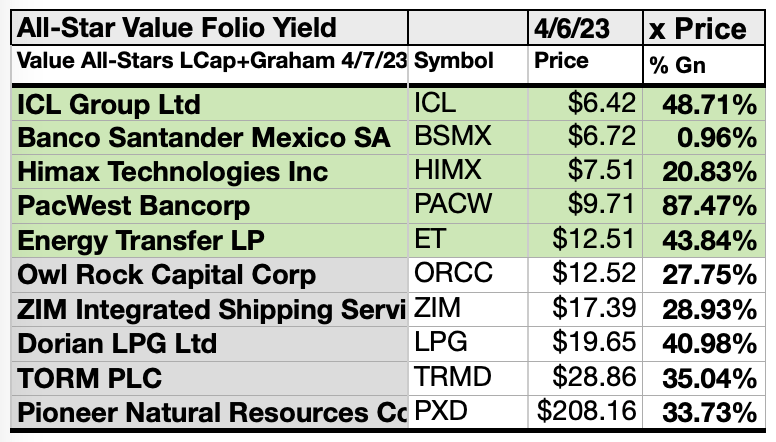
The five lowest-priced top-yield All-Star-Value dividend stocks for April 6 were: ICL Group Ltd; Banco Santander Mexico SA; Himax Technologies Inc; PacWest Bancorp; Petróleo Brasileiro S.A. - Petrobras; Energy Transfer LP, with prices ranging from $6.42 to $12.51.
The five higher-priced top-yield All-Star-Value dividend stocks for April 6 were: Owl Rock Capital Corp; ZIM Integrated Shipping Service Ltd; Dorian LPG Ltd; TORM PLC; Pioneer Natural Resources Co, whose prices ranged from $12.52 to $208.16.
This distinction between five low-priced dividend dogs and the general field of ten reflected Michael B. O'Higgins' "basic method" for beating the Dow. The scale of projected gains based on analyst targets added a unique element of "market sentiment" gauging upside potential. It provided a here-and-now equivalent of waiting a year to find out what might happen in the market. Caution is advised, since analysts are historically only 20% to 85% accurate on the direction of change and just 0% to 15% accurate on the degree of change.
Afterword
If somehow you missed the suggestion of the forty-eight stocks ripe for picking at the start of the article, here is a repeat of the list at the end:
Source: YCharts.com
In the current market bounce, dividends from $1K invested in the forty-nine stocks listed above met or exceeded their single share prices as of 4/6/23.
As we are over three years past the 2020 Ides of March dip, the time to snap up some top-yield All-Star-Value dogs is now... unless another big bearish drop in price looms ahead. (At which time, your strategy would be to add to your holdings.)
Recent vs Break-Even Top Ten All-Star-Value Stock Prices
Since nine of the top ten All-Star-Value Dividend shares are now priced less than the annual dividends paid out from a $1K investment, the following top chart shows the dollar and percent variants to all ten top dogs conforming to (but not exceeding) the dogcatcher ideal.
Those at recent prices are the subject of the middle chart with the break-even pricing of all ten is delivered in the bottom chart.
Source: YCharts.com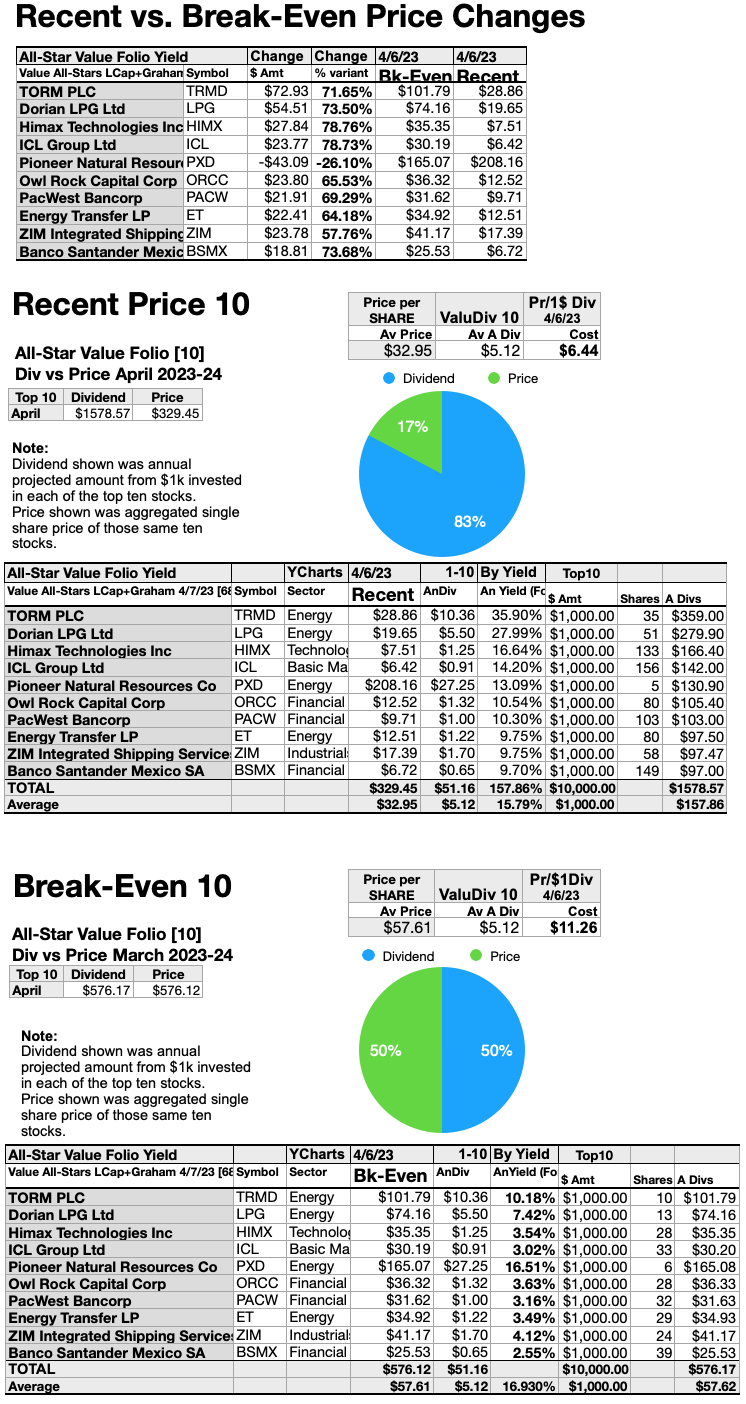
You could look at the top chart as an indicator of how high each stock might rise or fall in the coming year or two. However, it also shows how much the price must rise or fall (in either dollars or percentage) before it exactly conforms to the standard of dividends from $1K invested equaling the current single share price.
Net gain/loss estimates above did not factor in any foreign or domestic tax problems resulting from distributions. Consult your tax advisor regarding the source and consequences of "dividends" from any investment.
Stocks listed above were suggested only as possible reference points for your All-Star-Value Dividend dog stock purchase or sale research process. These were not recommendations.
Disclaimer: This article is for informational and educational purposes only and should not be construed to constitute investment advice. Nothing contained herein shall constitute a solicitation, recommendation or endorsement to buy or sell any security. Prices and returns on equities in this article except as noted are listed without consideration of fees, commissions, taxes, penalties, or interest payable due to purchasing, holding, or selling same.
Graphs and charts were compiled by Rydlun & Co., LLC from data derived from www.indexarb.com; YCharts.com; finance.yahoo.com; analyst mean target price by YCharts. Dog silhouette: Open source dog art from dividenddogcatcher.com.
Get The Entire Ben Graham 'Safer' Dividend Dog Story
Click here to subscribe to The Dividend Dogcatcher. Get more information, the follow-up to this article, and a free two week trial.
Catch A Dog On Facebook the evening before every NYSE trade day on Facebook/Dividend Dog Catcher, A Fredrik Arnold live video highlights a portfolio candidate in the Underdog Daily Dividend Show!
Root for the Underdog. Comment below on your favorite or most worrisome stock tickers to make them eligible for my next FA follower report.
This article was written by

Analyst’s Disclosure: I/we have no stock, option or similar derivative position in any of the companies mentioned, and no plans to initiate any such positions within the next 72 hours. I wrote this article myself, and it expresses my own opinions. I am not receiving compensation for it (other than from Seeking Alpha). I have no business relationship with any company whose stock is mentioned in this article.
Seeking Alpha's Disclosure: Past performance is no guarantee of future results. No recommendation or advice is being given as to whether any investment is suitable for a particular investor. Any views or opinions expressed above may not reflect those of Seeking Alpha as a whole. Seeking Alpha is not a licensed securities dealer, broker or US investment adviser or investment bank. Our analysts are third party authors that include both professional investors and individual investors who may not be licensed or certified by any institute or regulatory body.