CDL: Exposure To Low Volatility Dividend Stocks

Summary
- The CDL ETF uses a non-traditional method of weighing holdings based on trailing volatility instead of market cap or dividend yield.
- The CDL ETF is currently paying a 3.4% trailing distribution yield.
- While the index methodology is novel, the result is not particularly impressive as it delivers middle-of-the-pack returns and risk.
- Overall, I still prefer the SCHD ETF.
gopixa
The VictoryShares US Large Cap High Div Volatility Wtd ETF (NASDAQ:CDL) provides a novel way to construct a high dividend index. Instead of focusing on market cap or dividend yield, the CDL ETF uses a stock's trailing 180-day volatility to determine its index weight.
Although the methodology is novel and interesting, the result is a middle of the pack fund that does not perform particularly well. Overall, I continue to prefer the Schwab U.S. Dividend Equity ETF (SCHD) as my go-to dividend investment vehicle.
Fund Overview
The VictoryShares US Large Cap High Div Volatility Wtd ETF ("CDL") provides exposure to dividend-yielding large-cap U.S. stocks weighted by trailing volatility.
The CDL fund has $384 million in assets and charges a 0.35% net expense ratio.
Strategy
The CDL ETF tracks the Nasdaq Victory US Large Cap High Dividend 100 Volatility Weighted Index ("Index"), an index that measures the performance of U.S. large-cap stocks that are portfolio-weighted by volatility, instead of traditional market-cap weighting methodologies.
The index construction methodology starts with the 500 largest U.S. companies by market capitalization with positive earnings over the past twelve months. It then identifies the 100 highest dividend yielding stocks out of the 500. The 100 stocks are then weighted based on their daily standard deviation (a measure of volatility) over the last 180 trading days. Stocks with lower volatility receive a higher weighting and vice versa.
The index is reconstituted every March and September based on information as of the prior month-end. Sector exposure is limited to 25%.
Portfolio Holdings
Figure 1 shows the sector allocation of the CDL ETF as of December 31, 2022. Using the index selection criteria mentioned above, the CDL ETF's largest sector weight is Financials at 22.2%, Utilities at 18.2%, and Health Care at 11.7%.
Figure 1 - CDL sector allocation (CDL factsheet)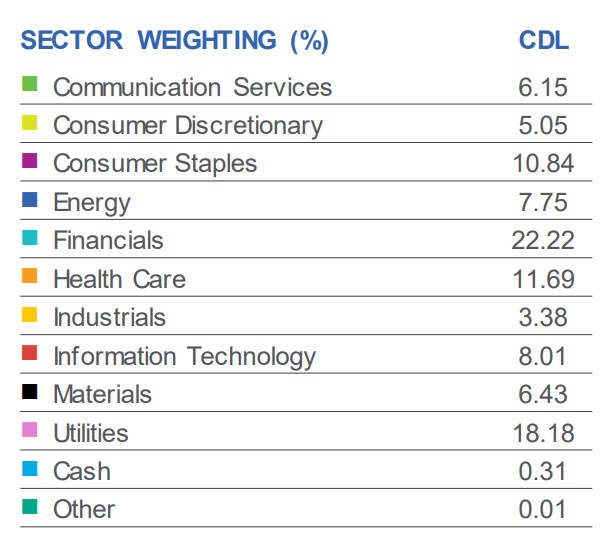
Compared to the market as represented by the SPDR S&P 500 Trust ETF (SPY), the CDL ETF is overweight Financials (22.2% vs. 12.8% for the SPY), Utilities (18.2% vs. 3.0%) and Energy (7.8% vs. 4.8%). It is underweight Information Technology (8.0% vs. 25.8%), Health Care (11.7% vs. 14.7%), and Consumer Discretionary (5.1% vs. 9.9%) (Figure 2).
Figure 2 - SPY sector allocation (ssga.com)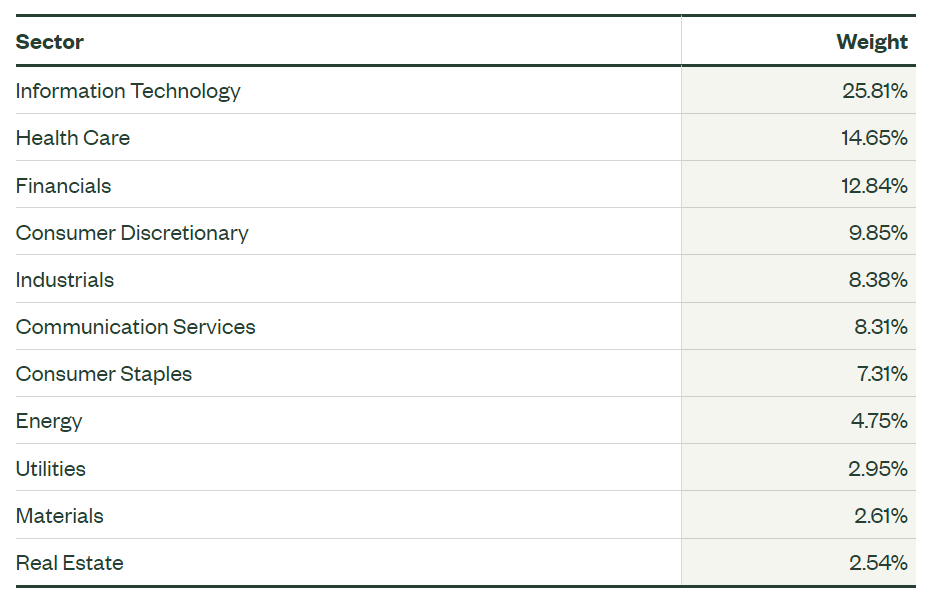
Distribution & Yield
The CDL ETF pays a modestly high monthly distribution, with a trailing 12 month distribution of $1.96 or 3.4% yield. CDL's distribution has grown at a 8.5% 5Yr CAGR (Figure 3).
Figure 3 - CDL distribution (Seeking Alpha)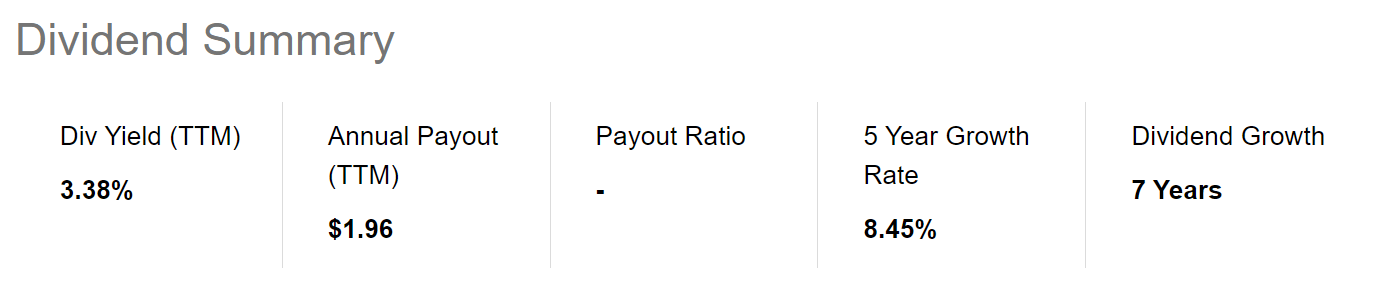
Returns
Figure 4 shows the historical returns for the CDL ETF. The fund has an eye-popping 3yr average annual total returns of 21.7%, but more modest long-term 5Yr average annual return of 8.9%.
Figure 4 - CDL historical returns (morningstar.com)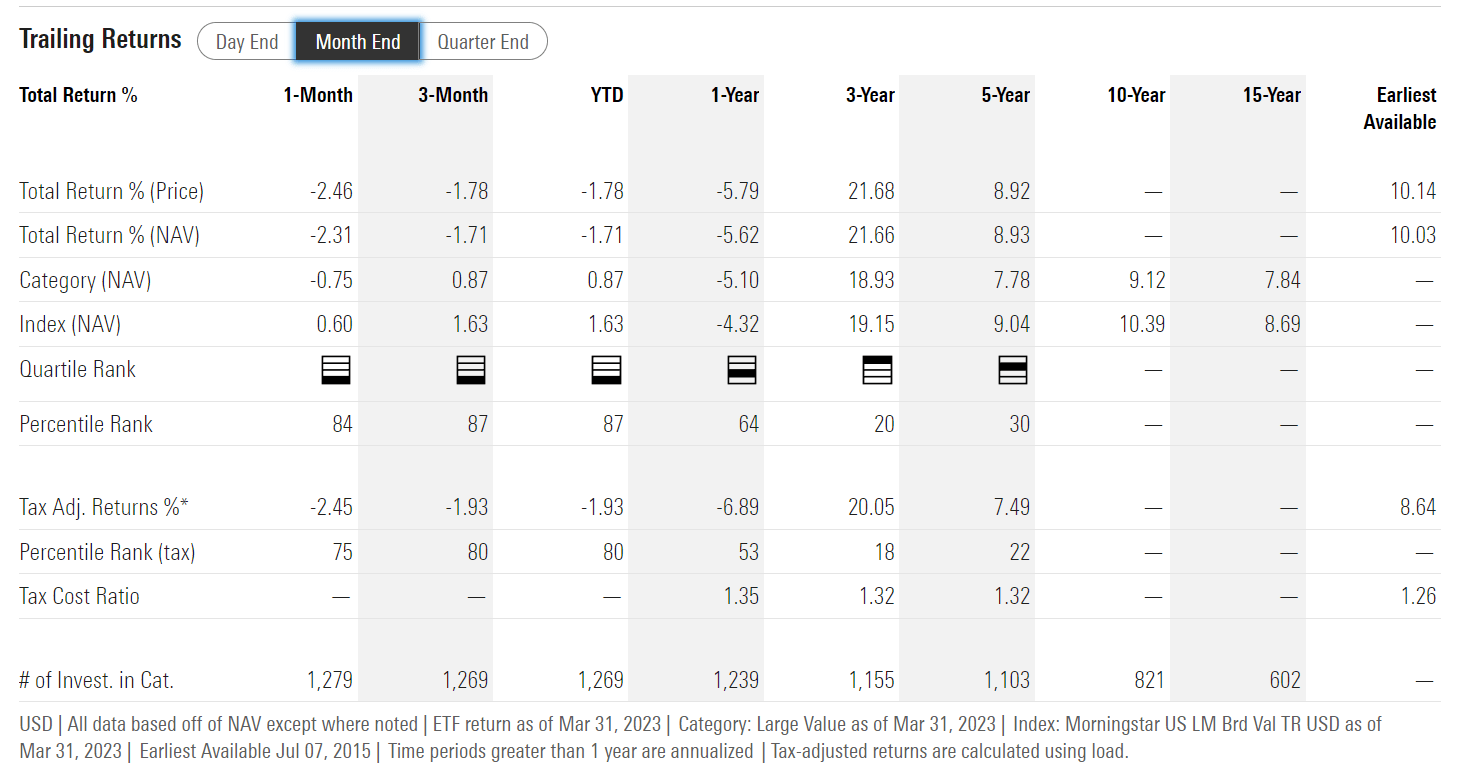
Investors should note that due to the timing of the data, most funds would show strong 3Yr average annual returns as the starting period was March 31, 2020, which coincided with the COVID-pandemic lows. Therefore, when analyzing and comparing investment funds, it is important to look at more than just a single number (for example the 3Yr average annual total return), to ensure we do not get fooled by the data.
CDL vs. Peer Dividend Funds
Figure 5 compares the CDL ETF against peer dividend funds using a proprietary scorecard that I developed, which analyzes multi-period returns and risk metrics.
Figure 5 - CDL vs. peer dividend ETFs (Author created with fund and distribution details from Seeking Alpha and returns and risk from Morningstar)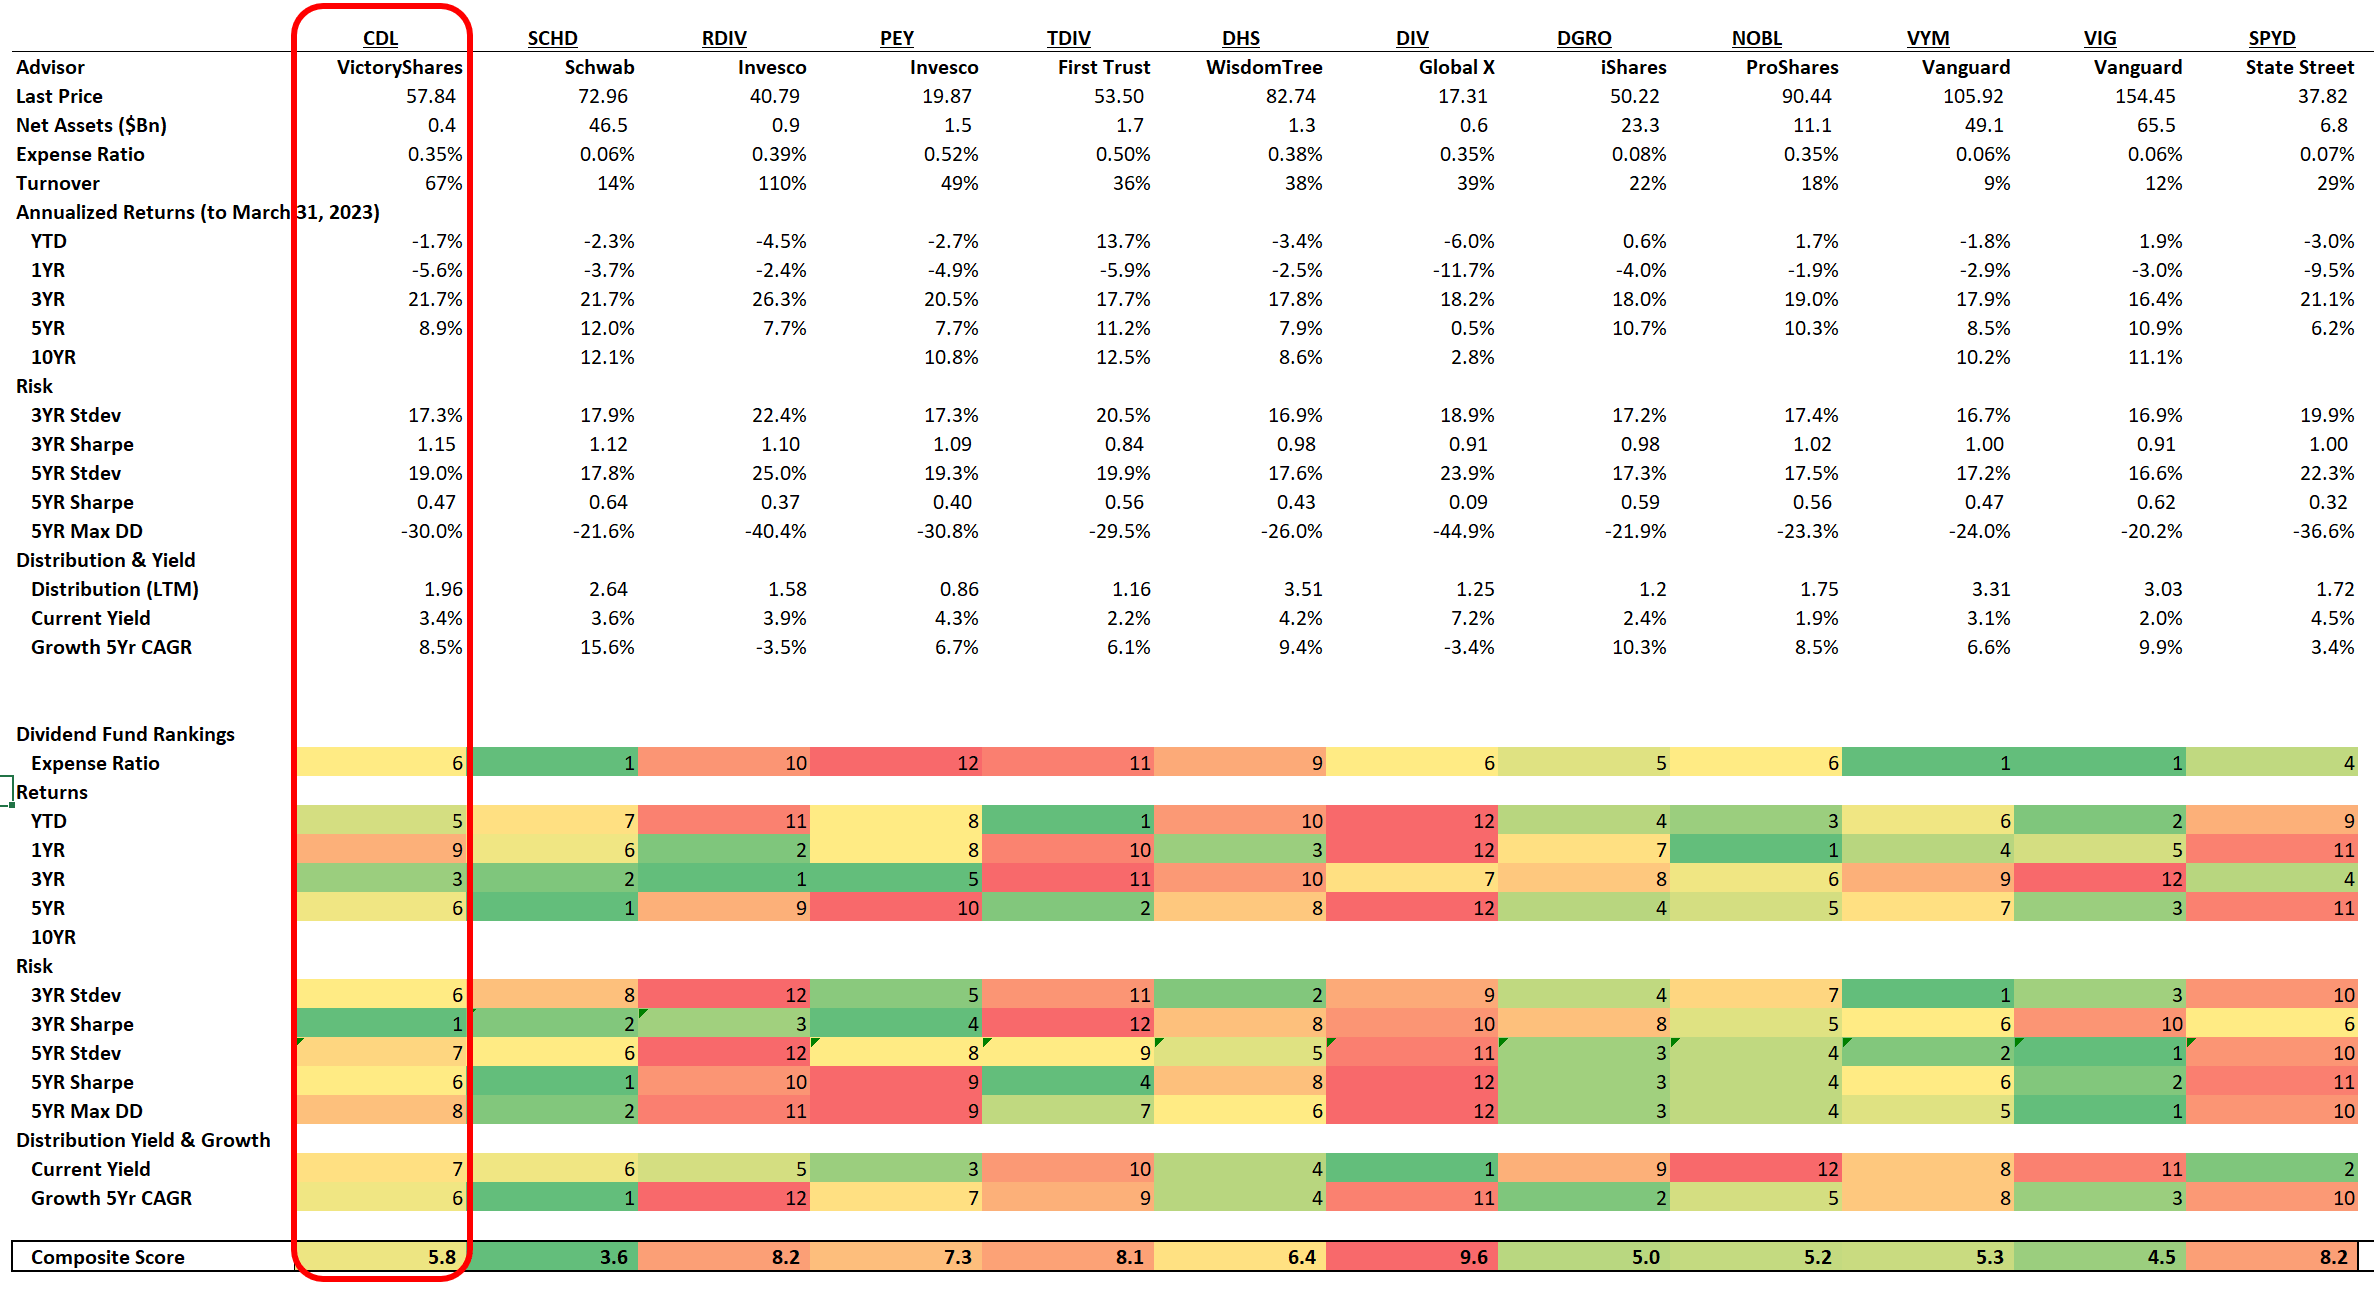
First, looking at the fund structure, the CDL ETF is relatively expensive, charging a net expense ratio of 0.35% versus low-cost peers like that Schwab U.S. Dividend Equity ETF (SCHD) or the Vanguard Dividend Appreciation Index Fund ETF (VIG) that charge 0.06%. All things equal, investors should choose lower cost funds, as returns are variable, but costs are fixed.
With respect to returns, the CDL ETF scores well on the 3Yr average annual return metric. However, its returns in other time frames such as 1Yr and 5Yr are more middle-of-the pack. As mentioned above, it is important to compare fund returns over different time-frames, because a strategy can 'get lucky' and deliver strong returns given a particular set of circumstances. However, as investors, we want to invest with a strategy that can consistently deliver solid returns.
On risk, despite a strategy that explicitly weighs its constituents on trailing realized volatility, the CDL ETF does not rank the best in terms of having the lowest returns volatility. This is because CDL's index construction methodology is backwards looking; what had low volatility on a trailing 180 day basis may not necessarily have low volatility on a forward basis.
For example, the recent turmoil from the regional banking crisis may have increased the trailing realized volatility of stocks in the Financial sector. However, due to the timing of the crisis (mid-March) versus CDL's index reconstitution cut-off dates of February month-end, the latest reconstituted index may not have incorporated the rise in Financial stock volatilities.
Finally, with respect to its distribution, the CDL ETF is again middle of the pack in terms of distribution yield and dividend growth rate.
In summary, the CDL ETF is a middle of the pack dividend ETF that scores well on the 3Yr average annual total return metric. However, when looking at the entirety of its performance, I still prefer the Schwab U.S. Dividend Equity ETF, which has scored better in multiple categories.
SCHD's selection criteria of cash flow to debt, return on equity, dividend yield, and 5-year dividend growth rate appears to be the superior strategy overall.
Conclusion
The VictoryShares US Large Cap High Div Volatility Wtd ETF provides a novel way to construct a high dividend index. Instead of focusing on market cap or dividend yield, the CDL ETF uses a stock's trailing 180-day volatility to determine its index weight.
Although the methodology is novel and interesting, the result is a fund that delivers only modest performance compared to peers. The CDL ETF excelled on the 3Yr average annual total return metric, but other time frames and risk metrics are middle of the pack.
Overall, for dividend investing, I prefer the SCHD ETF overall, as SCHD has consistently outperformed in multiple categories.
This article was written by

Analyst’s Disclosure: I/we have a beneficial long position in the shares of SCHD either through stock ownership, options, or other derivatives. I wrote this article myself, and it expresses my own opinions. I am not receiving compensation for it (other than from Seeking Alpha). I have no business relationship with any company whose stock is mentioned in this article.
Seeking Alpha's Disclosure: Past performance is no guarantee of future results. No recommendation or advice is being given as to whether any investment is suitable for a particular investor. Any views or opinions expressed above may not reflect those of Seeking Alpha as a whole. Seeking Alpha is not a licensed securities dealer, broker or US investment adviser or investment bank. Our analysts are third party authors that include both professional investors and individual investors who may not be licensed or certified by any institute or regulatory body.