International Diversification: The Recent Experience

Summary
- Diversification is unquestionably a good idea for investors.
- But what about international diversification?
- We take a look at the recent evidence.
- While international diversification may work well in the future, its performance since the early 1990s has been less than stellar.
urfinguss
Overview
In their classic textbook on investing, Bodie, Kane, and Marcus write
Although we in the United States customarily use a broad index of U.S. equities as the market-index portfolio, the practice is increasingly inappropriate. U.S. equities represent less than 40% of world equities and a far smaller fraction of total world wealth. (Investments, 10th edition)
International diversification has, justifiably, received much attention from academics and practitioners. For example, this piece from Vanguard shows the risk-reduction benefits of international diversification. And this one from MFS gives a nice overview of the recent performance of U.S. and international asset classes, as well as some examples of internationally diversified portfolios.
Our interest in this question is a practical one. For a U.S.-based investor, from the perspective of finance theory and using recent data, how much international diversification would have been optimal?
Our analysis assumes that the investor’s home market is the U.S. and that the two core domestic asset classes available to the investor are the S&P 500 index and the Bloomberg US Treasury Index, a diversified portfolio of U.S. Treasuries with an average maturity of roughly 8 years. The international asset classes are the MSCI World Index that excludes the U.S., which is tilted towards developed market stocks, and the Bloomberg Global Aggregate ex USD Index, which owns investment grade debt from 24 international markets with an average maturity of roughly 9 years. (These asset classes are accessible using low-cost exchange traded funds.)
Basic asset allocation theory suggests that a reasonable first pass at a balanced portfolio requires an investor to identify a targeted annual return and then find the portfolio that has historically achieved this return target with the least amount of volatility. The data we use for this exercise are the monthly returns of the four indexes starting in 1990. These four indexes provide diversification across two dimensions:
The stock-bond dimension allows investors to take advantage of the historically low correlations between stock and bond returns, as well as to tailor their portfolios towards desired risk-return levels (more stocks mean more risk and more return historically, and more bonds means the opposite).
The U.S.-international dimension allows investors to diversify away from U.S.-based assets into broad indexes involving securities of many international markets. From the perspective of a U.S. investor, allocating to these international asset classes involves two sources of risk: first, investors are exposed to fluctuations of the underlying securities in their domestic currencies (e.g., a French stock in euros), and, second, investors are exposed to fluctuations in the values the foreign currencies versus the U.S. dollar (a strong dollar means that the dollar price of foreign assets falls).
Asset class returns
The next chart shows the cumulative returns for a U.S. investor from investing $1 in each of the four asset classes starting in January of 1990. A $1 investment in the S&P 500, including dividends and price appreciation, would now be worth $24.66. For international stocks excluding the U.S., the investment would now be worth $5.35. The two bond portfolios would now be worth $4.89 (U.S.) and $4.22 (international) respectively.
Returns of $1 invested in each asset class from January of 1990. SPX = S&P 500; MXWOU = MSCI World ex U.S.; USTREAS = Bloomberg U.S. Treasury index; WBNDXUS = Bloomberg Global Bonds index ex U.S. (QuantStreet, Bloomberg)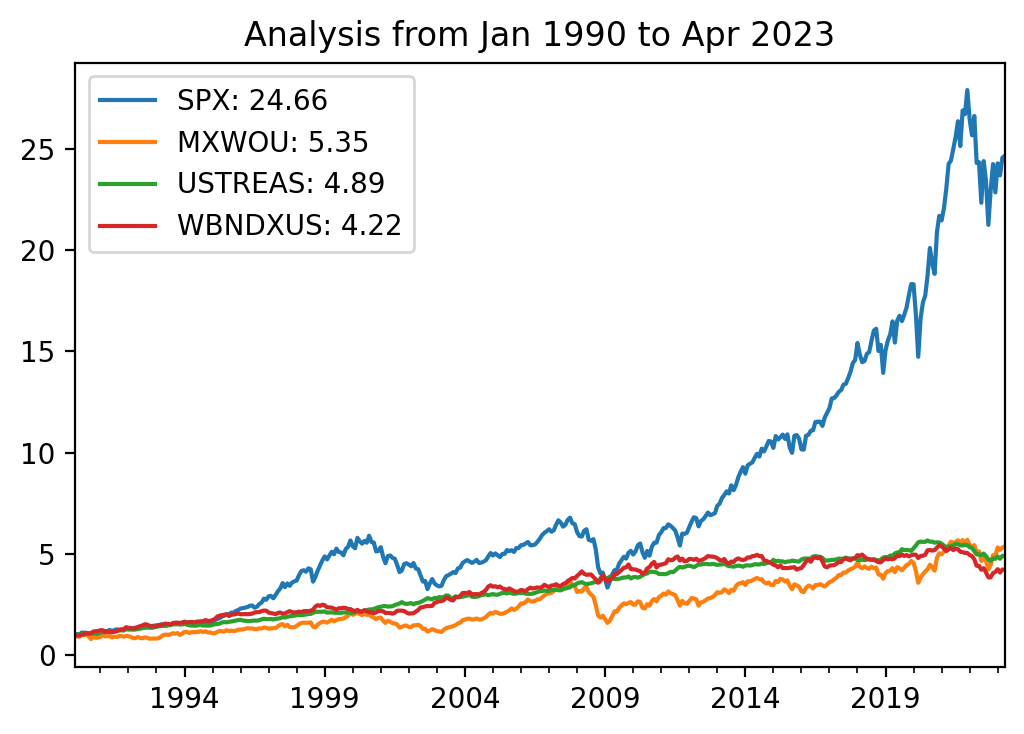
This cumulative performance translates into the following annualized returns and volatilities:
QuantStreet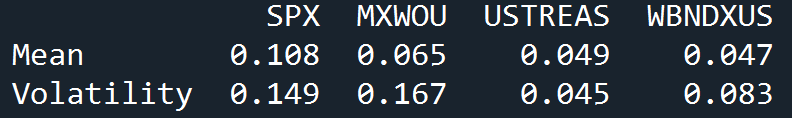
U.S. stocks have had the highest returns over the sample, while international stocks have had the highest volatility. U.S. Treasuries have had the highest return to volatility ratio, and international high quality bonds have had the lowest returns.
The other important aspect of historical performance is the correlation of asset class returns. Portfolios which combine less than perfectly correlated assets afford investors diversification benefits, as some of the individual asset class return fluctuations gets partially cancelled out at the portfolio level. The correlations of monthly returns for these four asset classes are:
Asset class correlations (QuantStreet)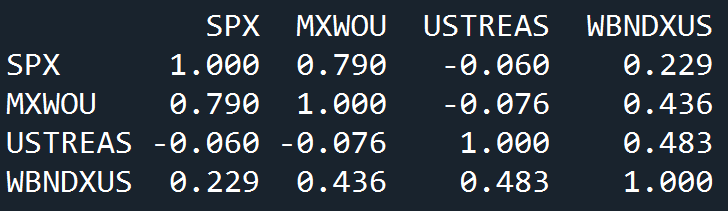
U.S. and international stocks have a relatively high correlation of 79%. This reflects a strong tendency for U.S. and international stocks to comove (e.g., in months when U.S. stocks are down, international stocks are likely to be down too, though the correlation isn’t 100%). U.S. and international bonds are less highly correlated at 48.3%. Interestingly, over this time period, U.S. Treasuries have had a negative correlation with both U.S. and international stocks suggesting that Treasuries provide a strong diversification benefit at the portfolio level. International bonds are positively correlated with U.S. and international stocks (22.9% and 43.6% respectively), but these correlations are lower than the 79% U.S. stock-international stock correlation. Overall, the less-than-perfect correlations suggest that diversification across the four asset classes may be beneficial.
Optimal portfolios
Using the above historical average returns, volatilities, and correlations, we can use mean-variance optimization methods to find the lowest volatility portfolio that would, historically, have earned a given targeted return. The problem with the basic version of this methodology is that it produces portfolios that involve short selling international stocks and using leverage to invest in U.S. stocks, U.S. Treasuries, and international bonds. This is clearly inappropriate for most investors, so we modify the optimization problem to disallow short-selling. The portfolios that result from this modified optimization are:
Each row shows the optimal allocations for a portfolio that would have achieved an annual historical return given in the "Mean" column. The "SD" column gives the annual volatility of that portfolio. (QuantStreet)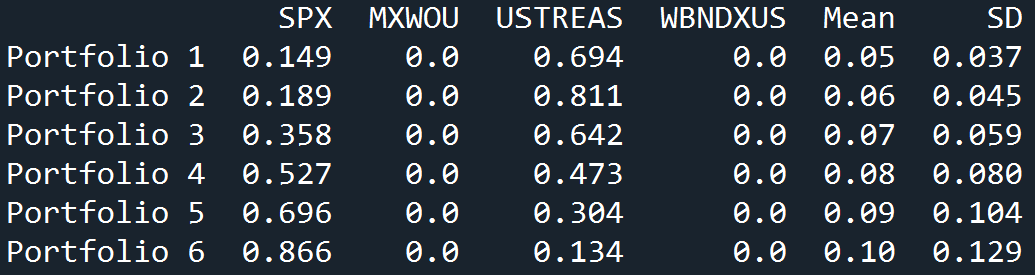
Each row of this table corresponds to a particular historical return target. For example, the second row, labeled Portfolio 2, corresponds to an annual return target of 6% (shown in the Mean column). This return target would have been achieved by a portfolio that invested 18.9% in U.S. stocks and 81.1% in U.S. Treasuries. The realized annual volatility of the portfolio would have been 4.5%. Without short-selling, this is the portfolio that would have achieved a 6% historical annual return with the smallest possible volatility. All other portfolios that returned 6% over our sample would have been riskier. Similarly, Portfolio 6 corresponds to the lowest possible volatility portfolio that would have returned 10% per year over this sample. This portfolio would have held 86.6% in U.S. stocks and 13.4% in U.S. Treasuries. Its annual volatility would have been 12.9%.
Notably, none of these risk-optimized portfolios would have allocated any money to international stocks or international bonds when using returns data from 1990 through April of 2023. This somewhat surprising outcome is due to the fact that over this time period, the outperformance of U.S. assets (helped by recent U.S. dollar outperformance) has outweighed the diversification benefit of investing internationally.
Takeaways
Despite this finding, we do not believe that U.S. investors should own only domestic assets. There is a lot of work suggesting that international diversification is helpful, either for downside risk mitigation or when applied to emerging market stocks. Furthermore, the past 30 years may have been a unique time period in financial markets and the coming decades may reward international diversification more. This analysis raises questions that we plan to address in future work:
What are the diversification benefits of industry exposures?
What is the track record of international diversification over a longer time period than since 1990?
How does adding emerging market stocks into the mix affect the conclusions?
Does international diversification mitigate tail risk?
You will hear from us on these questions in future work. But the takeaway from our analysis thus far is that international diversification — while good on paper — hasn’t worked all that well over the last 30 years.
Disclaimer
Investing in financial markets involves risks. Investors may lose money. No investment strategy can ensure a profit or protect against loss in adverse or unexpected market conditions. This is educational content that does not contain legal, tax, or investing advice. We recommend consulting with the appropriate professional before making legal, tax, or investing decisions.
This article was written by

Analyst’s Disclosure: I/we have a beneficial long position in the shares of VOO, IGOV, VGIT either through stock ownership, options, or other derivatives. I wrote this article myself, and it expresses my own opinions. I am not receiving compensation for it. I have no business relationship with any company whose stock is mentioned in this article.
Seeking Alpha's Disclosure: Past performance is no guarantee of future results. No recommendation or advice is being given as to whether any investment is suitable for a particular investor. Any views or opinions expressed above may not reflect those of Seeking Alpha as a whole. Seeking Alpha is not a licensed securities dealer, broker or US investment adviser or investment bank. Our analysts are third party authors that include both professional investors and individual investors who may not be licensed or certified by any institute or regulatory body.