QYLG Or QQQ + QYLD: Which Is A Better Investment?

Summary
- QYLG invests in Nasdaq-100 components and sells covered calls on 50% of its holding.
- The fund's strategy is extremely similar to 50% QQQ plus 50% QYLD, but there are some differences.
- A look at these two strategies, their differences and similarities, follows.
- This idea was discussed in more depth with members of my private investing community, CEF/ETF Income Laboratory. Learn More »
Michael M. Santiago
The Nasdaq 100 Covered Call & Growth ETF (NASDAQ:QYLG) invests in the underlying components of the Nasdaq 100 index, and sells covered calls on 50% of its holdings. Doing so serves to increase the fund's yield to 5.2%, while reducing upside potential by around 50%. Doing so is also extremely similar to a 50% allocation to the Invesco QQQ ETF (QQQ) plus a 50% allocation to the Global X NASDAQ 100 Covered Call ETF (QYLD). Due to reader interest, thought to do an article comparing QYLG to a 50/50 QQQ/QYLD investment.
QYLG is a bit more expensive than QQQ plus QYLD, with a 0.60% expense ratio versus a 0.40% average for the two other funds (0.20% plus 0.60%).
QYLG is a much smaller, illiquid fund, with only $73M in AUMs, versus $171B for QQQ, and $7B for QYLD. QYLG sometimes trades with a small spread and / or discount, while the same is almost never true for QQQ and QYLD.
QYLG automatically rebalances itself so as to consistently approximate 50% QQQ plus 50% QYLD. If you invest in QQQ and QYLD directly, rebalancing would have to be done manually by the investor.
In my opinion, going 50/50 QQQ/QYLD is slightly better than going QYLG. The first choice is slightly cheaper, and investors don't have to worry about illiquidity issues. Sporadic rebalancing are simple enough to do, can be funded with QYLD's distributions, and are not strictly necessary either.
QYLG - Quick Overview
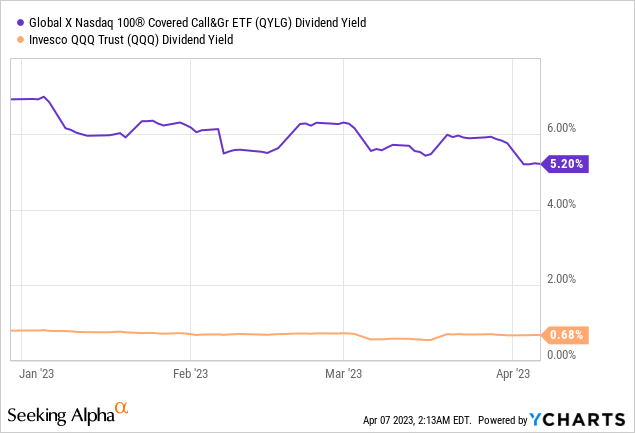
QYLG invests in underlying Nasdaq-100 components, and sells covered calls on 50% of its holdings. Said strategy serves to boost the fund's yield to 5.2%, significantly higher than QQQ's yield, and a good yield all around.
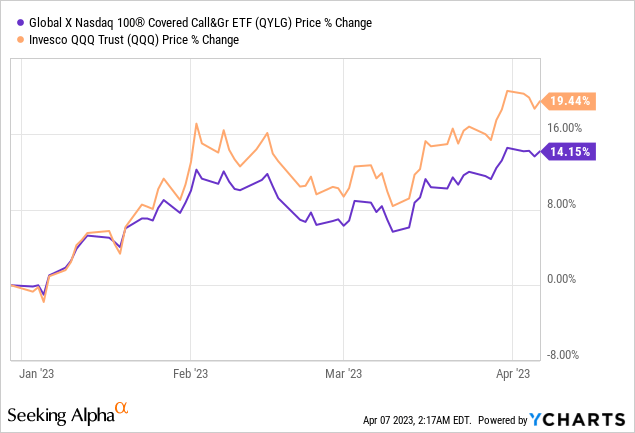
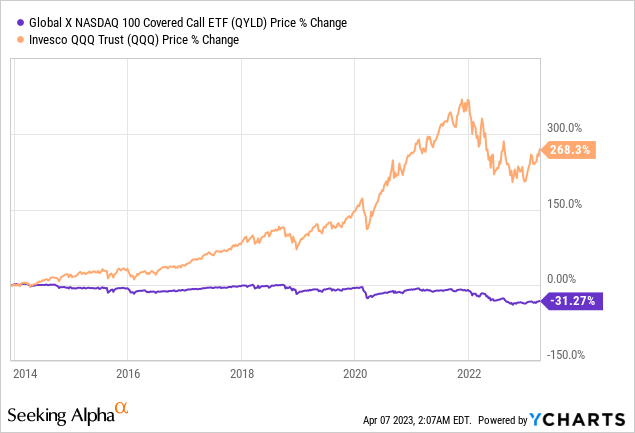
Said strategy also serves to moderately reduce upside potential. The call options themselves reduce upside by around 50%, although distribution policies and partial retaining of distributions somewhat reduce this percentage. As an example, QYLG's share price has increased by 14.2% YTD, compared to 19.4% for QQQ.
On a total return basis, QYLG tends to outperform when equity capital gains are low to non-existent, as has been the case since early 2022.

On the flipside, QYLG tends to underperform when capital gains are strong, as was the case in 2021.
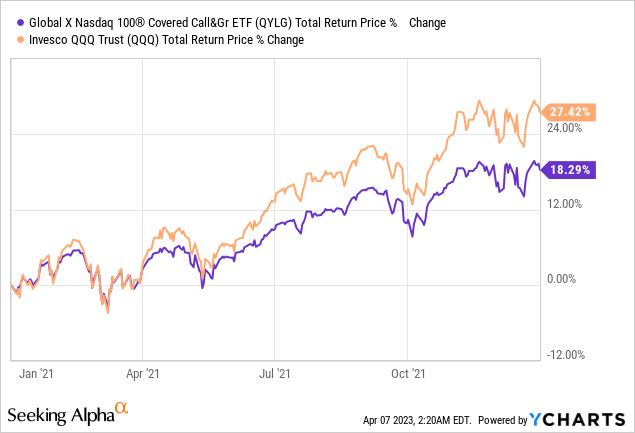
QYLG's long-term performance is dependent on several factors, including equity capital gains and option prices. Covered call funds tend to underperform, as has been the case for QYLG since inception.
There are several other covered call funds out there, with similar, although not identical, strategies and holdings to QYLG. One of these is QYLD, which invests in the underlying components of the Nasdaq-100 index, but sells covered calls on 100% of its holdings, versus 50% for QYLG. As is hopefully obvious, QYLG is basically the same as 50% QYLD plus 50% QQQ. In case it is not, a quick table showing why this is the case.
Seeking Alpha - Chart by Author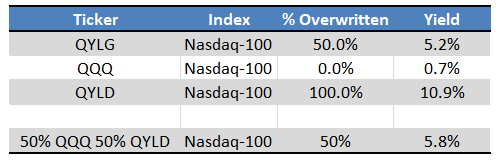
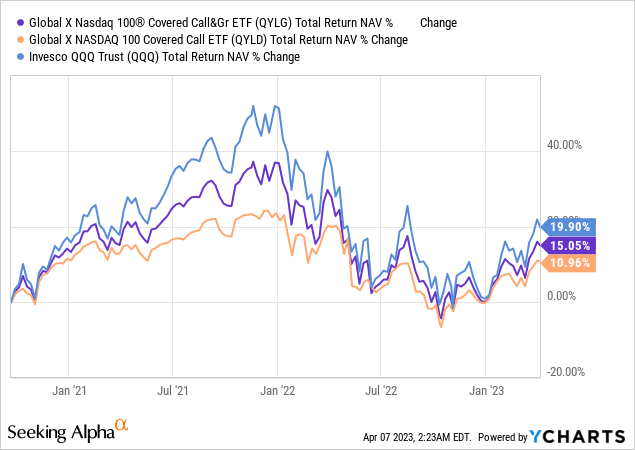
Looking at the total returns of these funds is also instructive. QYLG's returns are in the middle of QQQ and QYLD.
QYLG is very similar QQQ plus QYLD, but there are some differences. Let's have a quick look at these.
QYLG versus QQQ and QYLD
Expenses
QYLG is a bit more expensive than QQQ, same expenses as QYLD. Due to this, investing in QYLG is a bit more expensive than in a portfolio of QQQ plus QYLD.
Fund Filings - Chart by Author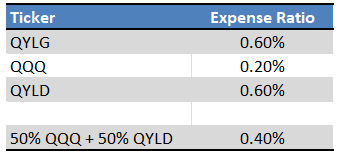
QYLG's higher expenses directly reduce shareholder returns, a negative for the fund and its shareholders. Expect QYLG to slightly underperform, as has been the case for the past year, and since inception. Underperformance is extremely similar to the difference in expenses, as expected.
Seeking Alpha - Chart by Author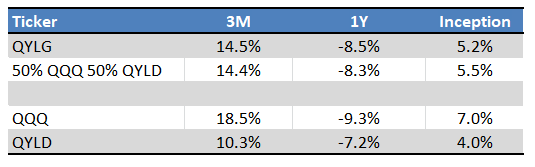
Avoiding expensive funds and focusing on cheaper ones is almost always a good idea. In this case, that means avoiding QYLG, and choosing QQQ plus QYLD instead.
Liquidity and AUMs
QYLG is a relatively small, illiquid fund. QQQ, on the other hand, is a mammoth. QYLD is somewhere in between, but reasonably large by industry standards.
Seeking Alpha - Chart by Author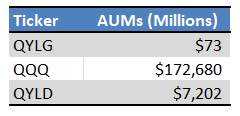
QYLG's small size leads to low liquidity, with two important implications for investors.
Illiquid funds tend to have higher bid-ask spreads, so investors get worse prices when investing in these. Spreads are particularly important for short-term traders, or for investors with high portfolio turnover rates. QYLG's spreads are higher than those of its peers, although not terribly high on an absolute basis.
Fund Filings - Chart by Author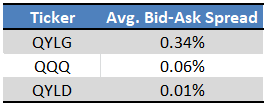
Illiquid ETFs sometimes trade with small discounts or premiums to NAV, liquid ETFs almost never do. Comparing QYLG's discounts to QQQ might prove instructive.
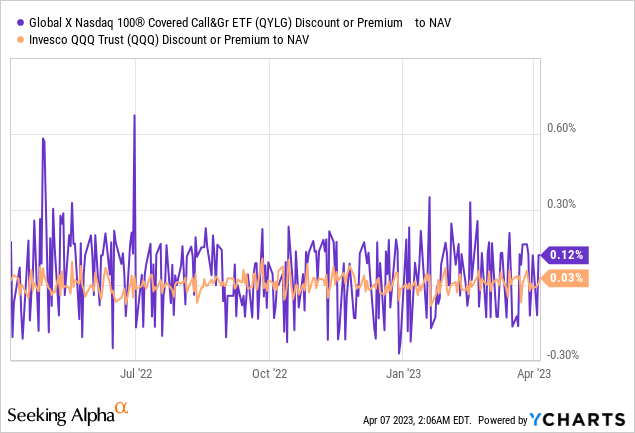
QYLG's more volatile discounts and premiums means investors might get a worse price when buying and selling compared to QQQ or QYLD. As these discounts are volatile and short-lived, it is difficult to purposely take advantage of them. By the time investors notice the fund is trading with a discount, the discount might very well be gone. As such, these discounts are simply a form of excess volatility, and should be construed as a negative.
Rebalancing
QYLG sells covered calls on 50% of its holdings, and its strategy is such that it is effectively always 50%, without any sort of investor intervention. Investing in QQQ and QYLD is effectively the same in the short-term, but the exact percentages will vary as share prices move through time. In practice, QYLD has significantly reduced potential capital gains, so QQQ weights should rise through time, QYLD weights should decrease for the same.
Due to the above, if investors wish to approximate an investment in QYLG using QQQ and QYLD, they would need to rebalance their portfolios every now and then. Although this isn't too complicated, some investors might wish to avoid the hassle, and invest in QYLG instead.
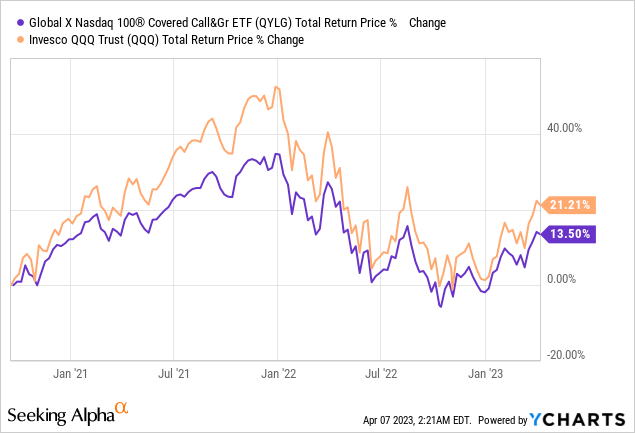
From what I've seen, rebalancing have not been necessary since QYLG's inception in late 2020. Meaning, the performance of QQQ plus QYLD without rebalancing closely tracks that of QYLG. Figures below are without rebalancing, and there does not seem to be any issues.
Seeking Alpha - Chart by Author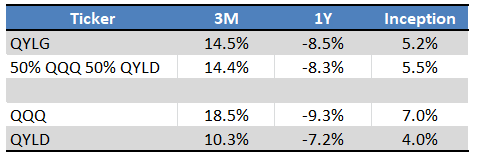
Conclusion
QYLG's strategy and holdings are extremely similar to a 50/50 investment in QQQ and QYLD. QYLG is a bit more expensive and illiquid, so choosing the portfolio is a slightly better choice, in my opinion at least.
Profitable CEF and ETF income and arbitrage ideas
 At the CEF/ETF Income Laboratory, we manage ~8%-yielding closed-end fund (CEF) and exchange-traded fund (ETF) portfolios to make income investing easy for you. Check out what our members have to say about our service.
To see all that our exclusive membership has to offer, sign up for a free trial by clicking on the button below!

This article was written by

Juan has previously worked as a fixed income trader, financial analyst, operations analyst, and economics professor in Canada and Colombia. He has hands-on experience analyzing, trading, and negotiating fixed-income securities, including bonds, money markets, and interbank trade financing, across markets and currencies. He focuses on dividend, bond, and income funds, with a strong focus on ETFs, and enjoys researching strategies for income investors to increase their returns while lowering risk.
---------------------------------------------------------------------------------------------------------------
I provide my work regularly to CEF/ETF Income Laboratory with articles that have an exclusivity period, this is noted in such articles. CEF/ETF Income Laboratory is a Marketplace Service provided by Stanford Chemist, right here on Seeking Alpha.
Analyst’s Disclosure: I/we have no stock, option or similar derivative position in any of the companies mentioned, and no plans to initiate any such positions within the next 72 hours. I wrote this article myself, and it expresses my own opinions. I am not receiving compensation for it (other than from Seeking Alpha). I have no business relationship with any company whose stock is mentioned in this article.
Seeking Alpha's Disclosure: Past performance is no guarantee of future results. No recommendation or advice is being given as to whether any investment is suitable for a particular investor. Any views or opinions expressed above may not reflect those of Seeking Alpha as a whole. Seeking Alpha is not a licensed securities dealer, broker or US investment adviser or investment bank. Our analysts are third party authors that include both professional investors and individual investors who may not be licensed or certified by any institute or regulatory body.