IJR: Small Caps Offer Excellent Relative Value

Summary
- Following the recent weakness in small cap banks, the small cap discount relative to the S&P500 is now close to its highest level seen since the late-1990s.
- US small caps may outperform the S&P 500 by as much as 10% annually over the coming years as they did following the tech bubble.
- I am initiating a long position on the iShares Core S&P Small Cap ETF, which has a strong track record of outperforming its small cap peers and the S&P 500.

syahrir maulana
US small cap stocks are now attractively priced and should provide annual returns of around 6% over the coming 5-10 years. Following the recent weakness in small cap banks, the small cap discount relative to the S&P500 is now close to its highest level seen since the late-1990s, and is 3-standard deviations above its mean. These conditions suggest US small caps should significantly outperform the S&P 500 over the coming years as was the case following the 1990s tech bubble, and I am initiating a long position on the iShares Core S&P Small-Cap ETF (NYSEARCA:IJR).
The IJR ETF
The IJR tracks a market-cap-weighted index of primarily small-cap US stocks. The S&P Committee selects 600 stocks representing about 3% of the publicly available market. The IJR is often compared with the Russell 2000 ETF (IWM), which until recently was larger in terms of assets under management. However, the IJR is far superior in my view, with the S&P SmallCap 600 having strongly outperformed the Russell 2000 index over time, reflecting the stricter criteria regarding the profitability of firms included in the index. This also explains why the trailing PE on the Russell 2000 is double that of the S&P600. The IJR also has a lower expense ratio of 0.06% versus the IWM's 0.19%. The dividend yields are similar at around 1.6%, although we should see the yield on the IJR move higher as the underlying index trades at a dividend yield of 2.0%.
Relative Value Is Back At Historic Extremes
The S&P Small Cap 600 index now trades at a P/E ratio of 15x, while the forward P/E trades at 13.8x, which is close to the lows seen at the height of the global financial crisis in 2009. While the relatively low PE ratio partly reflects temporarily high profit margins which will almost certainly mean revert lower over the coming years, other valuation metrics still suggest the IJR is undervalued.
Taking an average of the PE ratio, price-to-sales ratio, price-to-book ratio, and dividend yield, the S&P Small Cap 600 is trading around 0.7 standard deviations below its long-term average going back to the mid-1990s. From similar valuations in the past, the index has posted above average returns of over 15% annually over the subsequent 5 years.
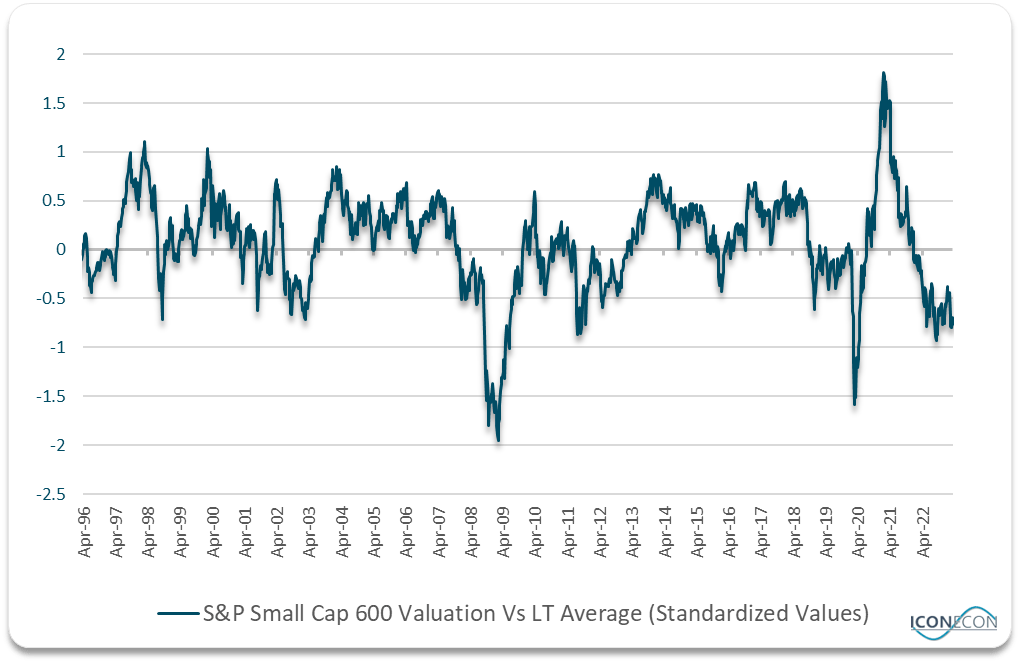
Bloomberg, Author's calculations
A repeat of such a performance over the coming years is highly unlikely in my view. Small caps are unlikely to be able to maintain the 7-8% trend growth rate of sales in the face of slowing nominal GDP growth, which is likely to cap earnings and dividends growth at around 4% annually. Nonetheless, with the dividend yield also at a respectable 2%, the IJR is now finally priced for reasonable long-term returns.
This is especially the case on a relative basis. The valuation discount of the S&P Small Cap 600 index relative to the S&P 500 is near its widest level on record depending on the valuation metric used. Taking an average of the valuation metrics above, small caps trade at 43% or 1.6 standard deviation discount to the S&P 500. This is the largest small cap discount seen since the height of the US tech bubble in 1999, following which the S&P Small Cap 600 outperformed the S&P 500 significantly for several years.
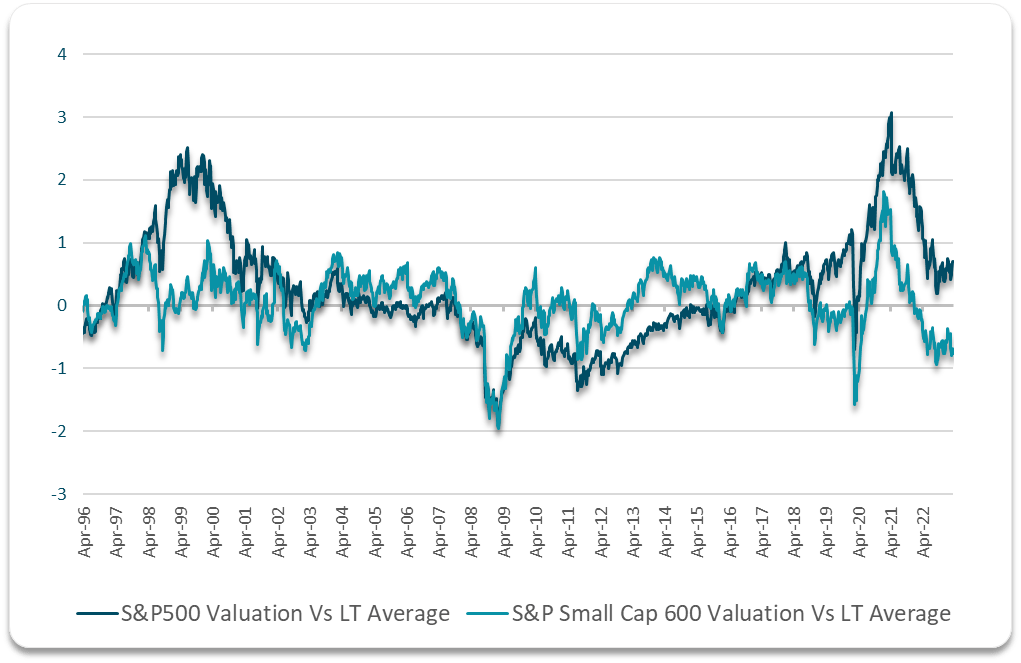
Bloomberg, Author's calculations
The close historical correlation between the two markets means that the current undervaluation of small caps is an extremely rare event. The respective dividend yields on the small cap index and the S&P 500 illustrate this point. While the S&P Small Cap 600 yields just 18% more than the S&P 500, the ratio is a staggering 3.2 standard deviations above its long-term average. A gradual mean reversion back to the long-term average dividend yield ratio would be enough to see the IJR outperform the S&P 500 by over 10% a year over the next 5 years, which I think is highly likely.
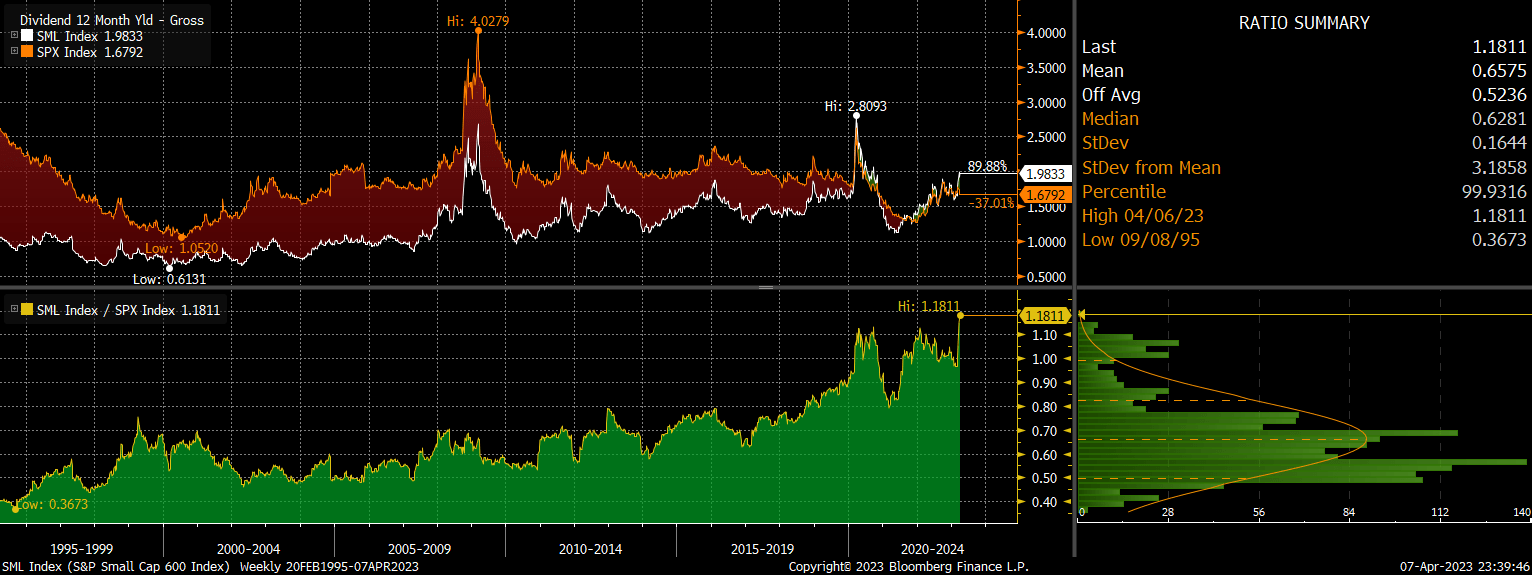
S&P Small Cap 600 Dividend Yield vs S&P 500 (Bloomberg)
Near-Term Risks But We Are Likely Close To A Bottom
The main risk when making bets based on long-term valuation mean reversion is that there is nothing to prevent an extreme valuation discount from becoming even more extreme. If we were to see the composite valuation discount shown above return to its 1999 extreme before ultimately reversing, this could mean another 20% underperformance in the IJR as small cap stocks tend to be more susceptible to economic downturns and deflationary shocks, partly due to their higher weighting of financial stocks, we may not yet be at the point of reversal. However, from a multi-year perspective, we should see the S&P Small Cap 600 resume its long-term outperformance relative to the S&P 500, allowing the IJR to outperform.
This article was written by

Analyst’s Disclosure: I/we have a beneficial long position in the shares of IJR either through stock ownership, options, or other derivatives. I wrote this article myself, and it expresses my own opinions. I am not receiving compensation for it (other than from Seeking Alpha). I have no business relationship with any company whose stock is mentioned in this article.
Seeking Alpha's Disclosure: Past performance is no guarantee of future results. No recommendation or advice is being given as to whether any investment is suitable for a particular investor. Any views or opinions expressed above may not reflect those of Seeking Alpha as a whole. Seeking Alpha is not a licensed securities dealer, broker or US investment adviser or investment bank. Our analysts are third party authors that include both professional investors and individual investors who may not be licensed or certified by any institute or regulatory body.