The Retirees' Dividend Portfolio: John And Jane's March 2023 Taxable Account Update

Summary
- The Taxable Account generated $2,203.31 of dividend income for March 2023 compared with $2,038.95 of dividend income for March 2022.
- The Taxable Account had a balance of $524.6K as of March 31, 2023, vs. $543.8K on March 31, 2022. The annualized cost basis yield is 5.25%.
- Three companies in the Taxable portfolio paid increased dividends or paid a special dividend during the month of March.
- The Taxable Account had a cash balance of $14.5K as of March 31, 2023, vs. $32.8K as of March 31, 2022. The 2023 cash balance does not include $20K of funds held in brokered CDs.
- The Taxable Account had an unrealized gain/loss of $99.6K as of March 31, 2023, vs. $127.4K as of March 31, 2022.
Artur
Watchlist
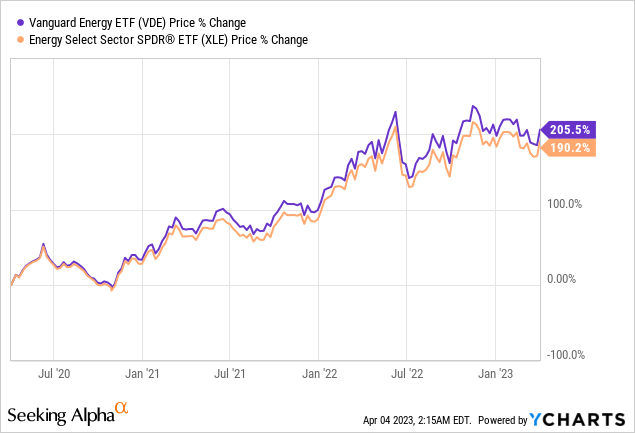
In the most recent article retirement account update my watchlist section focused on adding EOG Resources (EOG) and Suncor (SU) after energy prices were beaten down when crude oil prices reached a 15-month low. During this time, we were finally starting to see oil prices that were sustainable for smaller companies to begin justifying drilling and producing more oil since prior to that the cost of producing one barrel of oil was approximately what could be sold for on the open market. Consider the following graph where 15 months ago (December 2021/January 2022) two of the largest energy ETFs were sitting at share prices that were approximately 100% higher than in April 2020 when Covid lockdowns first began. Since then, the same ETFs have doubled and are now sitting at 200% plus gains over where the share prices were in April 2020.
When we compare the share prices of the watchlist on March 20 vs April 3 we can see the share price of all, but two stocks improved during this two-week period of time.
Watchlist - Share Price Comparison - 2023-4-3 (SeekingAlpha)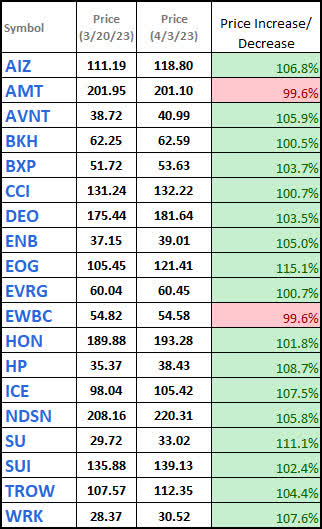
The addition of EOG and SU was very timely because both of these stocks saw the most significant increase in share price. A major contributor to the share price increase was the surprise decision by OPEC+ to cut oil production by a combined 1.16 million bbl/day.
We have also updated the rest of the table and will be looking to remove Boston Properties (BXP) during next week's update because after further research the dividend safety is not as strong as originally believed. This was pointed out by fellow contributor Paul Drake who reminded me that an AFFO calculation for dividend coverage would be more appropriate for taking into consideration the cost of maintenance. The original payout ratio under FFO calculations came in at approximately 50% while the payout under AFFO comes in closer to 80%. Given the challenges for office REITs in the current and potential upcoming recession, there is not enough potential upside to warrant investing in BXP at this time.
Valuation
Watchlist - Reasonably Priced - 2023-4-3 (Seeking Alpha)
Dividends
Watchlist - Dividend - 2023-4-3 (Seeking Alpha)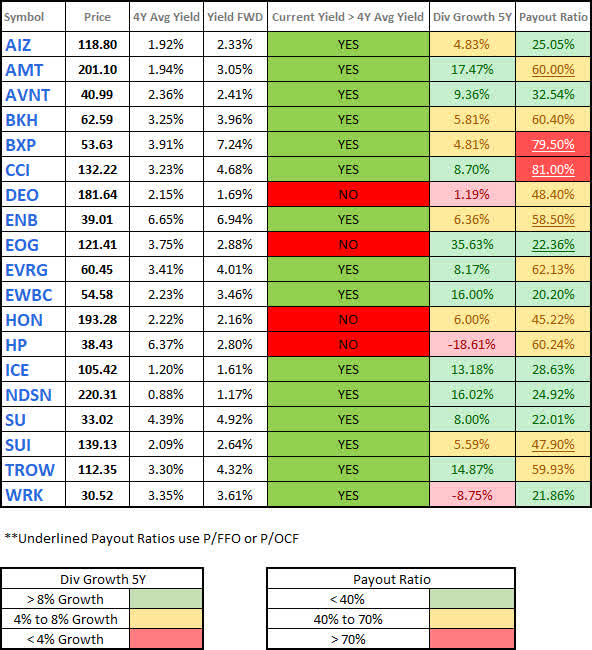
Debt Profile
Watchlist - Debt Metrics - 2023-4-3 (Seeking Alpha)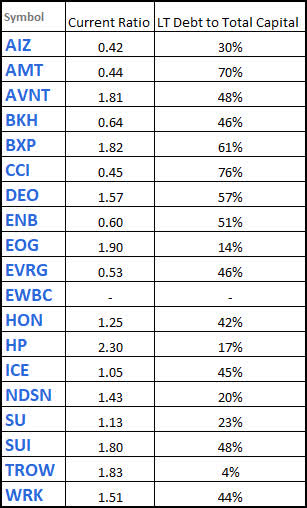
Watchlist Conclusion
I think the opportunity in the energy field has largely passed with the exception of Suncor (SU), Enbridge (ENB), and MLPs like Energy Transfer (ET) and Enterprise Production Partners (EPD). We recently added EOG to Jane's retirement account with an initial cost per share of $108.64/share.
We will be doing some updates to the watchlist by removing (BXP) from the list.
Background
For those interested in John and Jane's full background, you can find at least three articles a month published for the last five years detailing the performance of their portfolio. I have continued to evolve the report over time by adding and removing information/images to make the updates more useful to the average investor. Here are the key details that should be understood when reading these updates.
- This is a real portfolio with actual shares being traded. This is not a practice portfolio which is why I include screenshots from Charles Schwab to document every change that is made.
- I am not a financial advisor and merely provide guidance based on a relationship that goes back several years.
- John retired in January 2018 and has collected Social Security income as his regular source of income. John also currently withdraws $1,000/month from his Traditional IRA.
- Jane retired at the beginning of 2021 and decided to begin collecting Social Security early and has not made any withdrawals from her retirement accounts yet.
- John and Jane began drawing funds from the Taxable Account in 2022 at $1,000/month. After speaking with them this amount has been increased to $1,700/month. This withdrawal is still covered entirely by dividend and interest income.
- John and Jane have other investments outside of what I manage. These investments primarily consist of minimal-risk bonds and low-yield certificates.
- John and Jane have no debt or monthly payments other than basic recurring bills such as water, power, property taxes, etc.
The reason why I started helping John and Jane with their retirement accounts is that I was infuriated by the fees they were being charged by their previous financial advisor. I do not charge John and Jane for anything that I do.
The only request I have made of John and Jane is that they allow me to publish their portfolio anonymously because I want to help as many people as I can while holding myself accountable and improving my thought process.
I started this series to address issues I have had when reading other authors with similar types of updates (I am not saying they are wrong, but I found myself questioning their actual performance because they never provided enough information to cover loose ends).
Here is my promise to readers:
- I aim to give as much information as needed so readers can feel confident that what I do is real.
- Even if you agree the results are real this does not mean I expect you to agree with me and I will always answer constructive criticism whenever possible. I will respond with the same genuine intent that the question was asked with.
- I am very transparent about the portfolio and consistency is a significant goal of mine. All of my data points (unless noted otherwise) are derived from month-end statements from Charles Schwab. Even when things aren't looking great (Spring 2020 for example) you will know because I provide enough information that it would be impossible for me to manipulate.
- This article is not intended to be advice or a call to action and is for informational purposes only (I am not a financial advisor, and I don't claim to be one). My goal is to challenge conventional thinking and empower you to take control of your investments (if that's something you want to do).
While many authors require paid subscriptions to see their portfolio, I do not want to go that route and will continue to publish this series for free as long as there is enough interest to make it worth my time (and I spend A LOT of time on these articles).
Generating a stable and growing dividend income with an emphasis on capital preservation has become the primary focus of this portfolio. I am least concerned about capital appreciation which is why the decisions made will seem pretty conservative most of the time. I may measure the performance of the portfolio relative to indexes and ETFs but the key metric I am focused on is delivering a more stable source of cash flow to John and Jane over time that allows them to live a comfortable retirement that includes minimal stress related to finances.
Dividend Decreases
One company in John's and Jane's Taxable account reduced their dividend during the month of March.
- VF Corp. (VFC)
VF Corp - VFC has faced a number of setbacks including losing its coveted 50-year track record of consistent yearly dividend increases. VFC is not the kind of company you want to be throwing money at but if there was ever a bet to make for a turnaround situation VFC would definitely be that company. With the dividend reset and now at sustainable levels, it is easily covered through the profit generated by its core brands and will give the company time to get the new CEO settled. One of the key metrics I am looking for is to see the improvement in the sales of numbers for its Vans brand and stronger growth from Dickies. I think that the dividend cut was necessary and provides the company with the financial flexibility it needs.
The difference between this dividend cut and those from other companies is that VFC has legendary brands with the ability to grow market share instead of a business models/brands that are dying. The dividend cut is the reset the company needs as a wake-up call and indicates that management accepts the changes that need to be made moving forward.
VFC cut its dividend from $.51/share per quarter to $.30/share per quarter. The annualized payout was previously $2.04/share while the new payout is $1.20/share. This represents a dividend reduction of -41.2%.
Dividend Increases
Three companies paid increased dividends/distributions or a special dividend during the month of March.
Archer-Daniels-Midland - The recent dividend increase is marked by recently reaching a share price that double the common peak share price of $50/share commonly seen (split adjusted) prior to 2020. As a result, the dividend was bringing in a yield of just under 2% even though the historical trend is 2.75% - 3.00%. For this reason, we chose to trim back exposure in Jane's Retirement portfolio because the stock was priced beyond perfection. The recent dip offers an entry point that makes more sense for building a position or adding to an existing one. Looking at the FastGraphs chart below, you can see that the current dividend yield was last seen at the end of 2012 or a decade ago.
The size of the recent increase is also a positive sign given that the ten-year dividend CAGR is 8.72% while the five-year dividend CAGR comes in at 4.96%. Therefore, the most recent increase is essentially a reversal of the developing trend of smaller dividend increases.
ADM - FastGraphs - 2023-4 (FastGraphs)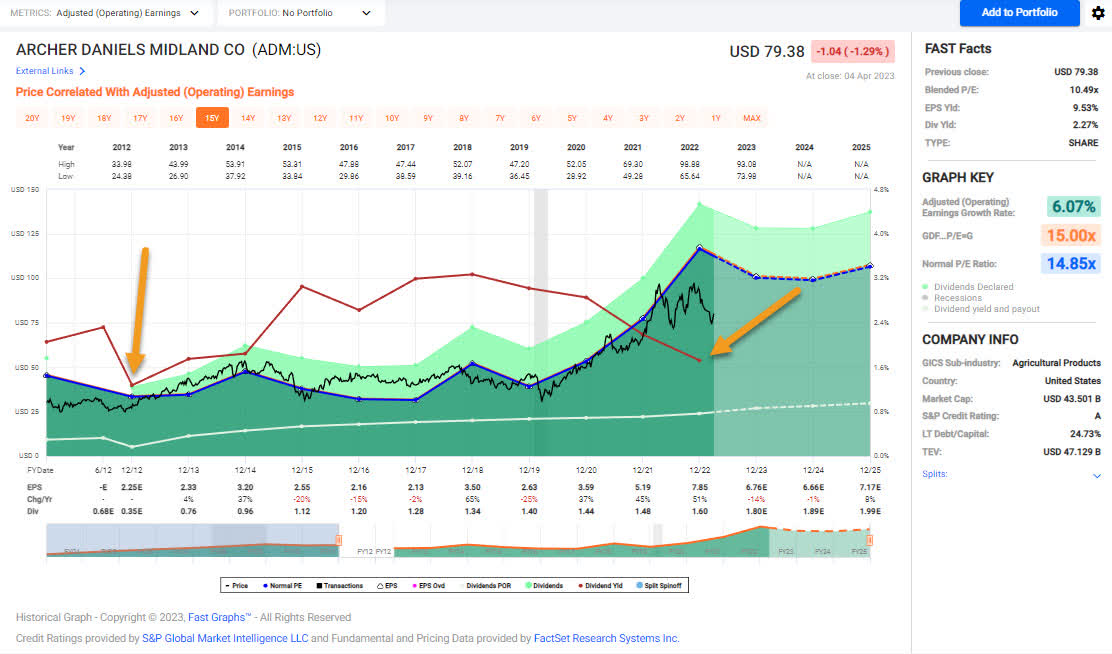
The dividend was increased from $.40/share per quarter to $.45/share per quarter. This represents an increase of 12.5% and a new full-year payout of $1.80/share compared with the previous $1.60/share. This results in a current yield of 2.24% based on the current share price of $79.38.
Old Republic International - The dividend model for ORI is one of my favorites because it emphasizes making conservative annual dividend increases while paying out larger special dividends when times are good. ORI’s business focuses on two divisions of insurance, the first being General Insurance and the second Title Insurance. General Insurance has been the mainstay of the company which generates steady revenue through a wide variety of insurance products for consumers, commercial clients, and government entities. The Title Insurance segment has benefited tremendously from the real estate market (purchases, refinances, sales, etc.) and because of its cyclical nature tends to be part of ORI’s operations that generates the earnings and allows them to pay a special dividend.
Shareholders should expect that the special dividend payouts will be significantly reduced heading into a recessionary environment especially when we consider the slowdown in refinances, purchases, and sales in the real estate market. Even without the special dividend, ORI currently offers a dividend yield close to 4% and offers significant downside protection through its stable business model. The run-off business that ORI has focused on writing private mortgage insurance policies which made it a higher-risk business model. As a run-off business, there are policies that the company must still honor but it is a nearly non-existent part of the company's operations. ORI has made the changes necessary to put itself in a very strong financial position to be able to maintain and increase its 42-year history of consecutive dividend increases.
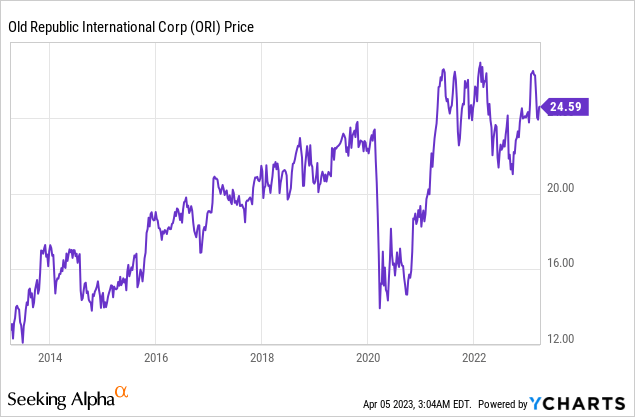
The dividend was increased from $.23/share per quarter to $.245/share per quarter. This represents an increase of 6.5% and a new full-year payout of $.98/share compared with the previous $.92/share. This results in a current yield of 3.93% based on the current share price of $24.59.
Realty Income - The conservative dividend model for Realty Income takes things to a whole new level with four quarterly increases of .2% (typically) and one larger dividend increase that represents the more meaningful annual increase. Much like these dividend increases, Realty Incomes earnings reports can be summarized as "slow and steady wins the race" because they are consistently meeting or slightly beating expectations. Q4-2022 earnings announcement in February was very positive with occupancy hitting 99% and normalized FFO beating the consensus by a penny.
We have found that $60/share is a worthwhile entry point for Realty Income with the share price over the last three years rarely dipping below this mark, and if so, only doing so for a very limited period of time. At this level, the dividend yield increases above 5%, which has historically been an excellent yield for shareholders. Remember that purchasing shares that maximize the yield on a reasonable stock that isn’t demonstrating dangerous levels of volatility indicates that an investor is maximizing the funds invested.
Realty Income - FastGraphs -2023-4 (FastGraphs)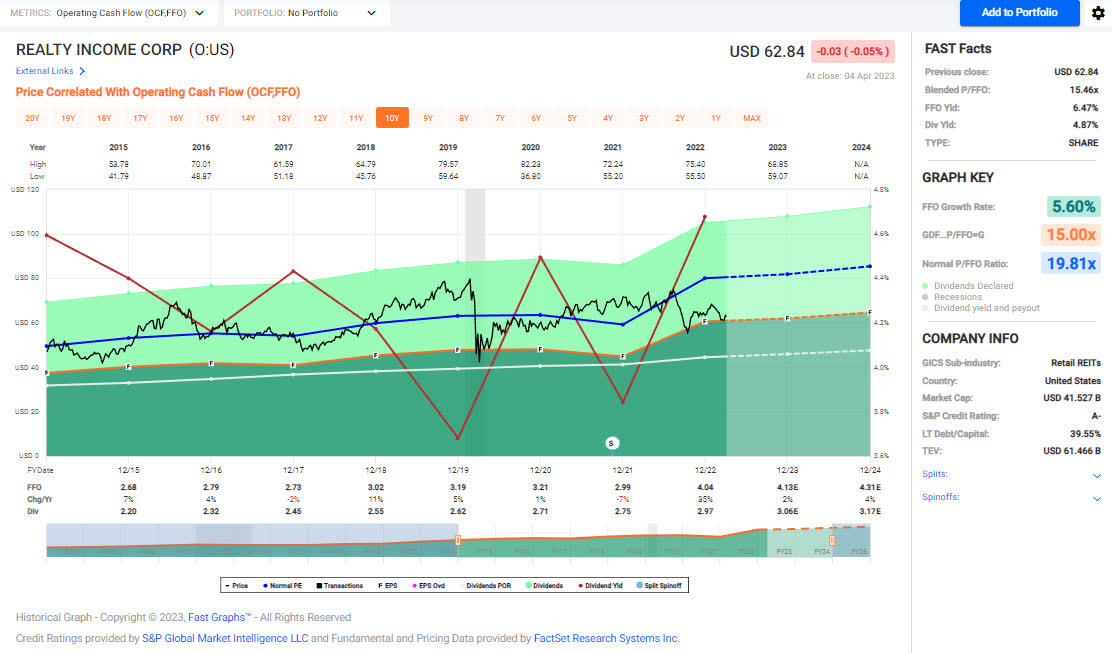
The dividend was increased from $.2485/share per month to $.2545/share per month. This represents an increase of 2.4% and a new full-year payout of $3.054/share compared with the previous $2.982/share. This results in a current yield of 4.87% based on the current share price of $62.84.
Positions
The Taxable Account currently consists of 43 unique positions (44 if you count the brokered certificate) at market close on April 4, 2023. There was one sale and two purchases that took place in the month of March.
2023 - March Taxable Transaction History (Charles Schwab)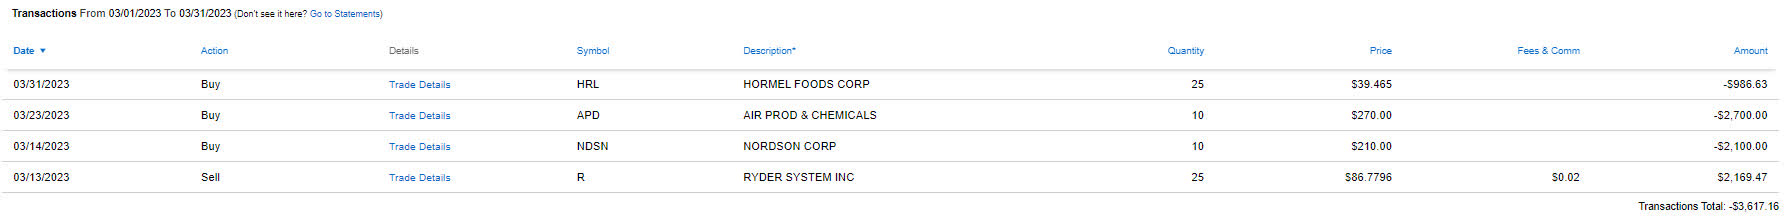
March Income Tracker - 2022 Vs. 2023
The Taxable Account is expected to generate an average of $1,790.33/month of dividend income in 2023 compared to the average monthly income of $1,792.62 generated in FY-2022. Once dividend increases are factored in and the additional interest income from CDs I expect we will see a very light increase in dividend income of 3-4%.
2022 also represented the first year of major withdrawals from the Taxable Account with no new funds flowing into it. The withdrawals John and Jane made were set at $1,000/month for a total of $12,000 withdrawn. After speaking with me they have decided to increase this amount to $1,700/month or a total of $20,400/year. The main reason for increasing the withdrawals from the Taxable Account is that they are taxed whether they take the money or not. This means I will need to be even more conscientious about capital deployment because I will have very limited excess funds to reinvest.
SNLH = Stocks No Longer Held - Dividends in this row represent the dividends collected on stocks that are no longer held in that portfolio. We still count the dividend income from stocks no longer held in the portfolio, even though it is non-recurring. All images below come from Consistent Dividend Investor, LLC. (also referred to as CDI as the source below).
The tables below represent which companies paid dividends in March and how that income source has changed relative to the same month last year.
2023 - March - Taxable Dividend Breakdown (CDI)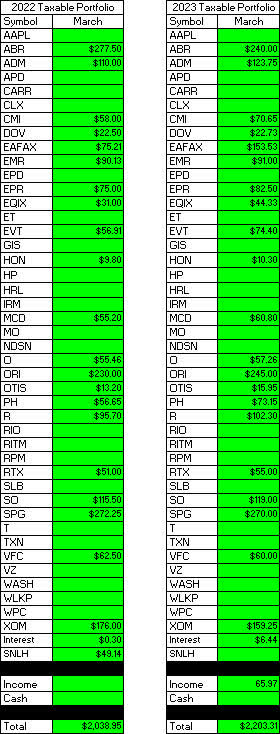
*The income category in the image above represents the certificate of deposit income.
The table below represents all income generated in 2022 and collected/expected dividends in 2023.
2023 - March - Taxable Annual Estimate (CDI)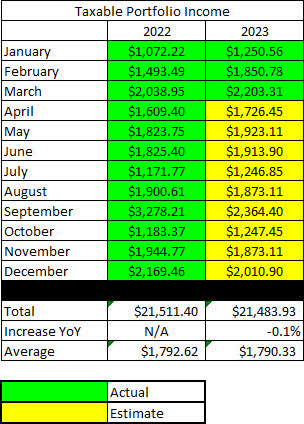
Below gives an extended look back at the dividend income generated when I first began writing these articles. I find this table to be most useful when comparing how dividend income has improved for a specific month over the course of six years.
2023 - March - Taxable Dividend History (CDI)
The Taxable Account balances below are from February 28, 2023, and all previous month balances are taken from the end-of-month statement provided by Charles Schwab.
2023 - March - Taxable Month End Balance (CDI)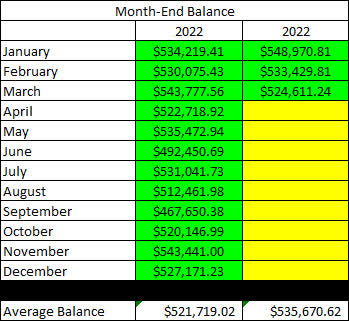
The next image is also pulled from the end-of-month statement provided by Charles Schwab which shows the cash balance of the account.
**Please note that cash balances may fluctuate based on CD renewal dates because I only count the cash that is 100% liquid. There were larger fluctuations in 2019 and 2020 that we the result of deposits and withdrawals being made. The Taxable Account has not had a deposit put into it since early 2020 but funds have been used for Traditional/Roth IRA Contributions and for withdrawals in 2022 and will be increasing in 2023.
2023 - March - Taxable Cash Balance (CDI)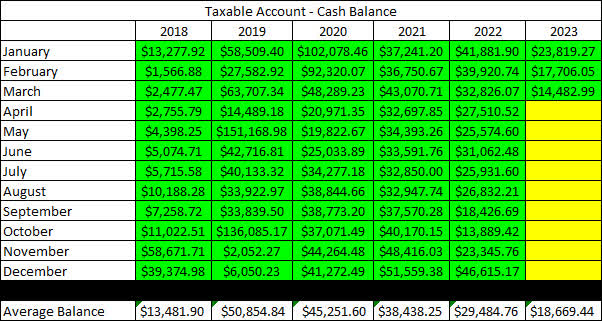
The next image provides a history of the unrealized gain/loss at the end of each month going back to the beginning of January 2018.
2023 - March - Taxable Unrealized Gain-Loss (CDI)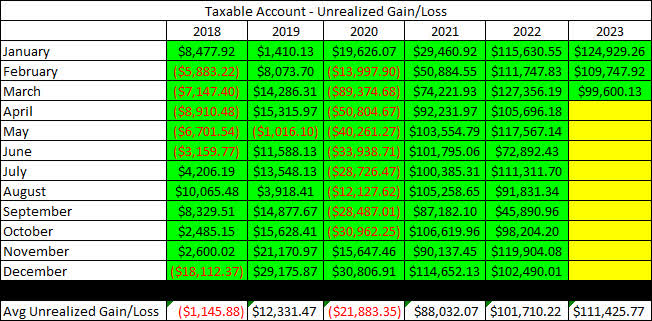
I think the table above is one of the most important for readers to understand because it paints a story of volatile markets and why we employ the strategy of generating consistent cash flows to overcome the uncertainty of the market. If we were dependent on selling shares to generate income for John and Jane's retirement, they would have to be much more considerate of when they withdraw and how much they choose to withdraw.
For example, a withdrawal in 2020 where shares must be sold would destroy more value by locking in losses or poor performance by stocks being sold compared to making the same withdrawal in 2021.
It appears that I forgot to include the withdrawal table in the January update. The image below shows funds that are withdrawn from the account. This is especially important to consider because now the amount of dividend income generated is just enough to cover the amount being withdrawn.
2023 - March - Taxable Withdrawals (CDI)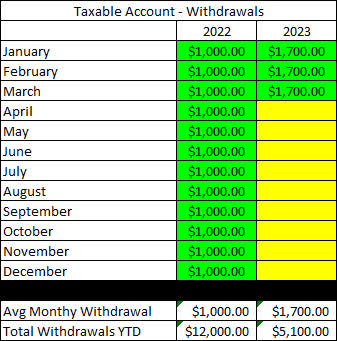
In an effort to be transparent about John and Jane's Taxable Account, I like to include an unrealized Gain/Loss summary. The numbers used are based on the closing prices from April 3, 2023.
2023 - March - Taxable Gain-Loss Update (CDI)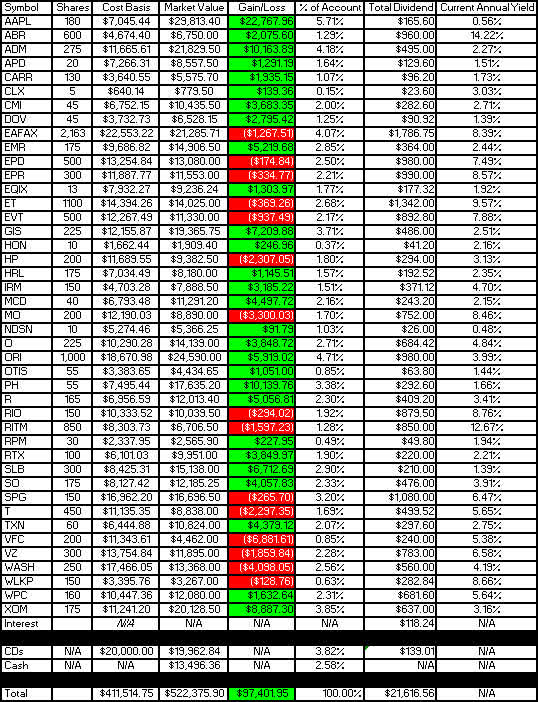
It is worth noting in the table above that the yield column is most accurate at the start of the year but if I reduce the size of positions it may inflate the yield because it is based on how much dividend income is collected. At the same time, it may report excessively low dividends for positions added or significantly increased at the end of the year.
Conclusion
Even with the dividend cut at VFC we have no plans to sell with one exception: if we choose to take capital gains from the sale of other shares we may choose to sell off the high-cost shares of VFC.
VFC - 2023-4 - Cost Basis (Charles Schwab)
Highlighted above are the shares that we would consider selling to take the loss and counterbalance the gains from some of the other investments. We have talked about it before but the focus of stocks to be sold are going to be higher-risk stocks with higher yields as well as stocks that have reached peak value and are likely to revert towards more reasonable values in a recessionary environment. Here are some examples of companies that fit these descriptions:
- Arbor Realty (ABR) - High yield/high risk.
- Dover (DOV) - Low yield/low risk.
- Emerson (EMR) - Low yield/low risk.
- Mcdonald's (MCD) - Low yield/low risk.
- Raytheon (RTX) - Low yield/low risk.
All of the stocks above are sitting on a fair amount of gains but selling these positions would only be a certain amount of the position (typically we retain the lowest cost portion of the position). If anything, ABR would be the company that we would liquidate altogether but at 1.27% of the portfolio, there aren't a lot of risks presented to the portfolio by this position.
The unique challenge I am working with now is balancing out taking advantage of opportunities to build on existing positions with managing the cash withdrawals going to John and Jane to fund their retirement. John and Jane's retirement income is priority number one so that is a shift from previous years when they did not need the cash flow from these accounts and I was able to reinvest all funds.
In John and Jane's Taxable Account, they are currently long the following mentioned in this article: Apple (NASDAQ:AAPL), Arbor Realty (NYSE:ABR), Archer-Daniels-Midland (NYSE:ADM), Air Products and Chemicals (APD), Carrier Global Corporation (NYSE:CARR), Clorox (NYSE:CLX), Cummins (NYSE:CMI), Dover Corporation (NYSE:DOV), Eaton Vance Floating-Rate Advantage Fund A (MUTF:EAFAX), Emerson Electric (EMR), Enterprise Products Partners (NYSE:EPD), EPR Properties (NYSE:EPR), Equinix (NASDAQ:EQIX), Energy Transfer (NYSE:ET), Eaton Vance Tax-Advantaged Dividend Income Fund (NYSE:EVT), General Mills (NYSE:GIS), Honeywell (NASDAQ:HON), Helmerich & Payne (NYSE:HP), Hormel (NYSE:HRL), Iron Mountain (NYSE:IRM), McDonald's (MCD), Altria (NYSE:MO), Nordson (NDSN), Realty Income (O), Old Republic International (ORI), Otis Worldwide Corporation (NYSE:OTIS), Parker-Hannifin (NYSE:PH), Ryder System (NYSE:R), Rio Tinto (RIO), Rithm Capital (RITM), RPM International (RPM), Raytheon Technologies (NYSE:RTX), Schlumberger (NYSE:SLB), Southern Company (NYSE:SO), Simon Property Group (SPG), AT&T (NYSE:T), Texas Instruments (NASDAQ:TXN), V.F. Corporation (VFC), Verizon (NYSE:VZ), Washington Trust (NASDAQ:WASH), Westlake Chemical (NYSE:WLKP), W. P. Carey (NYSE:WPC), and Exxon Mobil (XOM).
Editor's Note: This article discusses one or more securities that do not trade on a major U.S. exchange. Please be aware of the risks associated with these stocks.
This article was written by

Analyst’s Disclosure: I/we have a beneficial long position in the shares of AAPL, ADM, APD, EMR, EPR, EQIX, HON, MCD, NDSN, O, RPM, T, TXN, VFC either through stock ownership, options, or other derivatives. I wrote this article myself, and it expresses my own opinions. I am not receiving compensation for it (other than from Seeking Alpha). I have no business relationship with any company whose stock is mentioned in this article.
This article reflects my own personal views and I am not giving any specific or general advice. All advice that is given is done so without prejudice and it is highly recommended that you do your own research. This article was written on my own and does not reflect the views or opinions of my employer.
Seeking Alpha's Disclosure: Past performance is no guarantee of future results. No recommendation or advice is being given as to whether any investment is suitable for a particular investor. Any views or opinions expressed above may not reflect those of Seeking Alpha as a whole. Seeking Alpha is not a licensed securities dealer, broker or US investment adviser or investment bank. Our analysts are third party authors that include both professional investors and individual investors who may not be licensed or certified by any institute or regulatory body.