RPV: 'Pure Value' Is Indeed More Value Than 'Value'

Summary
- Systematic value investors bet that a diversified portfolio of fundamentally "cheap" stocks should outperform a portfolio of "expensive" stocks over the long term.
- The Invesco S&P 500 Pure Value ETF tracks the S&P 500 Pure Value Index and was incepted in March 2006.
- Compared to other "smart-beta" value ETFs, RPV is a more aggressive value-strategy and only invests in the top 20% value stocks of the S&P 500 universe (currently 82 positions).
- With this methodology and three fundamental valuation ratios as value signals, the investment process underlying RPV incorporates several best-practices from the academic literature on the value-factor.
- RPV is well positioned in a value-peer group and (in my opinion) a very good instrument for investors seeking concentrated exposure to the value-factor.
Wirestock/iStock via Getty Images
In a recent article, I already introduced the value methodology of S&P for the iShares S&P US Value ETF (IUSV). In this article, we will become one step more aggressive and examine the Invesco S&P 500 Pure Value ETF (NYSEARCA:RPV). In many respects, the underlying methodologies are very similar but there is one important difference in the portfolio construction of S&P Value and Pure Value indices. Apart from that, the universe is of course different. IUSV overweights value stocks from the S&P 900 Index which includes mid caps, whereas RPV (unsurprisingly) only considers large caps from the S&P 500 Index.
For a deeper introduction to (systematic) value investing, I kindly refer you to the "Value Investing - Idea and Evidence" section of my first article and to this post on my website. If you don't want to go there, here is a very brief summary to get everyone on the same page. The general idea of (systematic) value investing is that a diversified portfolio of fundamentally "cheap" stocks should outperform a portfolio of "expensive" stocks over the long-term. Over the years, academic and practitioner research found a lot of evidence for this "value factor" across different sample periods, regions, and even within different asset classes.
S&P Indices - Pure Value vs. Value
To see whether RPV is a reasonable implementation of the value factor, I will (as usual) start with the underlying investment process. In case of RPV, Invesco already provides a fairly comprehensive description on the ETF‘s website:
The Invesco S&P 500® Pure Value ETF (Fund) is based on the S&P 500® Pure Value Index (Index). [...] First, each security in the S&P 500 is assigned two “style scores” – one for value and one for growth – based on the characteristics of the issuer. The “value score” is measured using three factors: book-value-to-price ratio, earnings-to-price ratio, and sales-to-price ratio. The “growth score” is measured using three other factors: three-year sales per share growth, the three-year ratio of earnings per share change to price per share, and momentum (the 12-month percentage change in price). The ratio between the growth score and the value score is used to rank each stock as either deep value, blend or deep growth. Only the deep value stocks are selected and are factor weighted such that securities demonstrating the strongest value characteristics receive proportionally greater weights. The Fund and the Index are rebalanced annually.
Source: Invesco S&P 500 Pure Value ETF Website, accessed March 30, 2023; Annotations by the author.
In my opinion, this is a very good summary of the S&P value process and I already covered many of its aspects in my last article on IUSV. I will therefore not re-examine all details but rather focus on the differentiating features of the Pure Value index. In the following table, I summarize the key differences of the two methodologies based on the S&P 500 Value and S&P 500 Pure Value Factsheets from the end of March 2023, and the latest S&P US Style Indices Methodology.
| S&P 500 Value Index | S&P 500 Pure Value Index / RPV | |
Value Signals | Book-Value-to-PriceEarnings-to-PriceSales-to-Price | Book-Value-to-PriceEarnings-to-PriceSales-to-Price |
Portfolio Construction | Overweights Value stocks with respect to parent index but still owns "Growth" stocks | Only invests in 20% of stocks from the parent index that have highest Value score |
Number of Holdings | 405 | 82 |
Weighting Method | Float-Adjusted Market Cap(with practical constraints) | Value-Score(with practical constraints) |
Rebalancing Frequency | Quarterly | Annually |
Price/Earnings(Projected) | 16.53 | 9.24 |
Price/Book | 2.64 | 0.89 |
Price/Sales | 1.64 | 0.51 |
S&P uses three value signals to split the universe of the parent index into "Value" and "Growth". While there are still elements of the (in my opinion) overly simplistic "Value vs. Growth" distinction, S&P does a much better job here than Russell (see my discussion here and here). They don't define "low growth" automatically as "value" and follow the best-practice of the value-literature and use a composite of well-established fundamental valuation ratios as signal. Those signals are identical for both the Value and Pure Value Index and the two only differ when it comes to portfolio construction.
Unsurprisingly, the S&P 500 Value Index is considerably less aggressive than its Pure Value counterpart. I will certainly also write about the iShares S&P 500 Value ETF (IVE), which tracks the S&P 500 Value Index, at some point in the future but I will already include it for comparison here.
With the Pure Value Index, you get a fairly concentrated value-bet and only own the top 20% value stocks from the S&P 500. With the Value Index, you own most of the S&P 500 (incl. non-value stocks) and merely overweight those with high value scores.
In addition to that, the Pure Value Index rebalances only once a year and weights stocks according to their value score instead of market cap. I couldn't find a specific reason for the slower rebalancing but I suspect it is due to some transaction cost / turnover management. In any case, the stronger value-tilt of the S&P 500 Pure Value Index is also observable in the aggregate value-signals of the two portfolios. The P/E ratio, for example, is about 44% lower for the Pure Value Index compared to the Value Index and the same pattern applies to the other two valuation ratios (see table above).
So far to the methodology. The following chart now shows the cumulative performance of the two different methodologies for the longest common period of RPV and IVE. While both value ETFs trail the overall market, the more aggressive Pure Value strategy did considerably better. Starting around 2012/13, RPV outperformed IVE quite consistently and for quite some time, Pure Value was even better than the parent S&P 500 Index.
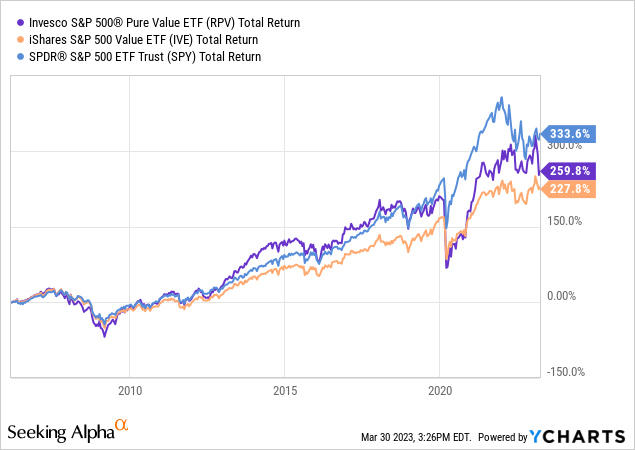
Summing up: RPV tracks the S&P 500 Pure Value Index which is a considerably more aggressive version of the S&P Value methodology. At least historically, this more concentrated value-bet was rewarded as RPV outperformed IVE and sometimes even the parent index.
RPV's Implementation of Value
The following chart shows the cumulative performance of RPV against several benchmarks. As I already mentioned above, the ETF currently trails the overall S&P 500 Index. The outperformance chart (gray area) further shows that RPV, as virtually all systematic value strategies, suffered massively during the sharp value drawdown between 2018 and 2020. It strongly recovered in 2021 and 2022 but suffered again in the growth rebound during the first quarter of 2023.
Own illustration of data from Kenneth French's website and market data. (Tuck School of Business and Microsoft Excel Stock API)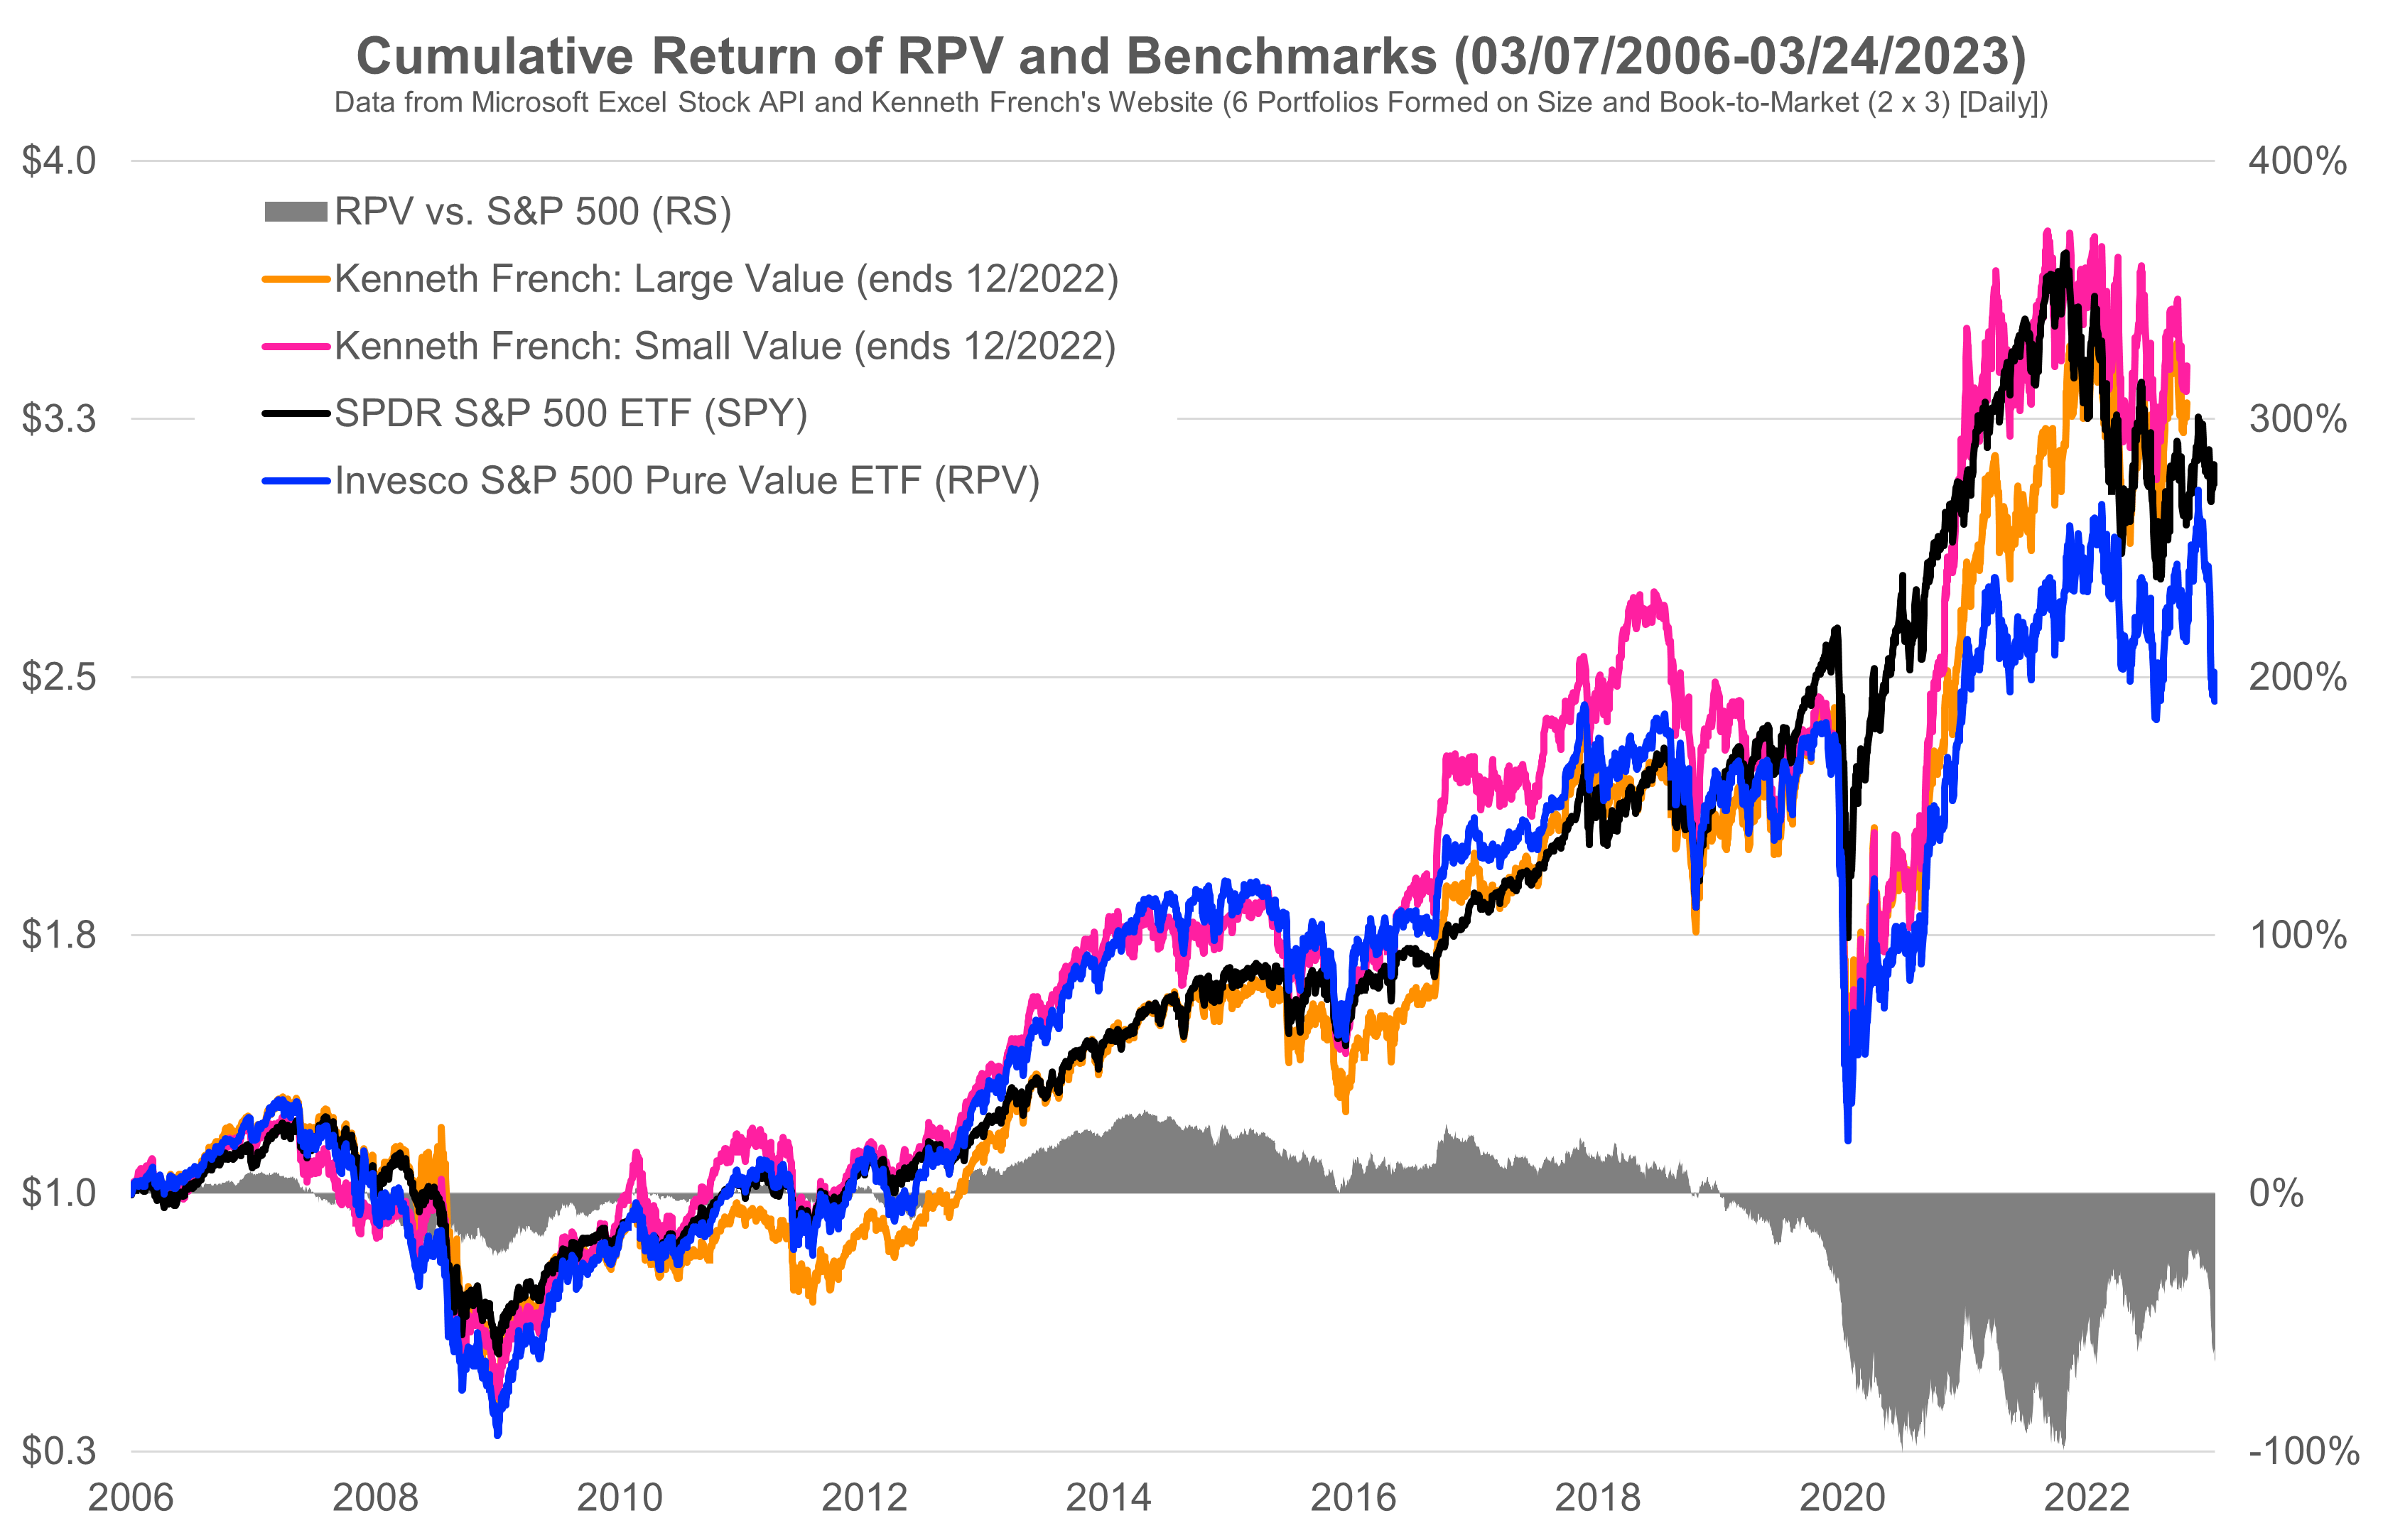
The in my opinion most interesting part of this chart, however, is RPV's performance compared to the "Kenneth French Large Value" benchmark portfolio. At least until the strong value recovery in late 2020, RPV is one of the few ETFs that performed comparable or even better than this simple academic benchmark. Given that most of the value ETFs in my peer group couldn't achieve that, I think this is worth mentioning. Please note, however, that the Kenneth French benchmarks are hypothetical portfolios that don't consider trading costs, management fees, and other practical frictions. So there are not investable and technically not a fair comparison to real-world ETFs.
RPV and Value-Peers
Finally, as regular readers of my articles know, the following table shows the performance of RPV and several (admittedly somewhat arbitrary selected) value-peers for different time periods. Since inception in March 2006, RPV was actually the best value ETF of this group in terms of annualized return. It is also very well-positioned for the longer 10 and 15 year time periods. At the other end, it somewhat trailed the peers over the most recent 3 and 5 years.
Tuck School of Business and Microsoft Excel Stock API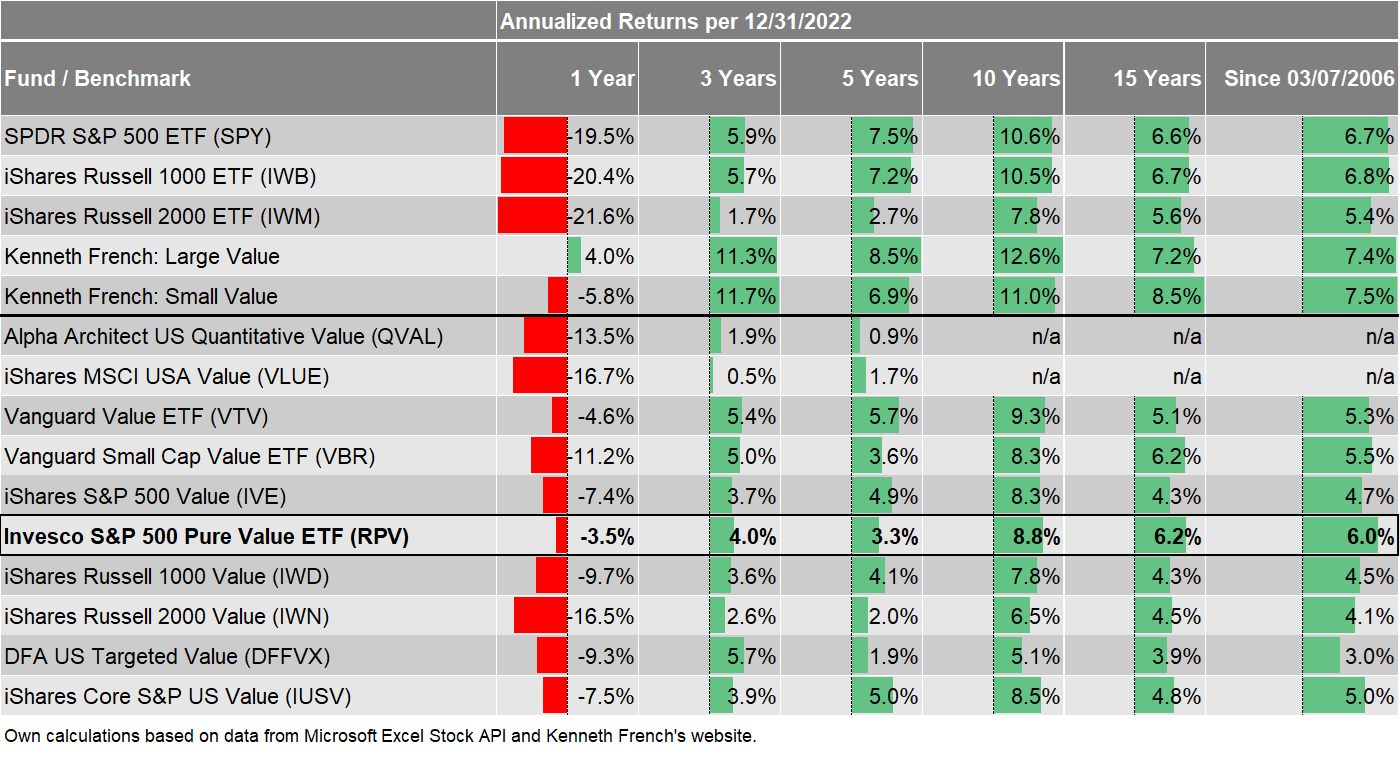
Over the very difficult last year (2022), RPV performed outstandingly well and lost only 3.5% versus a 19.5% loss for the SPY ETF over the same period. From the value-peers, only the Vanguard Value ETF (VTV) achieved comparable results with a loss of 4.6%. Overall, I believe RPV is well-positioned over the long-term and despite some problems still in the upper half of this group over the most recent 3-5 years.
Conclusion
Even though this article is primarily about the Invesco S&P 500 Pure Value ETF, I focused a lot about the underlying index methodology because this is the portfolio that the ETF is actually tracking. With the exception of QVAL, RPV is the most active value strategy that I covered so far. IWN, VLUE, IWD, and IUSV are "smart-beta" ETFs that own most of their parent indices' universe and merely overweight value stocks (some also exclude the strongest "non-value" stocks).
RPV is different. It follows the academic "portfolio sort approach" and only invests in the top 20% value stocks from the S&P 500 universe. As a consequence, investors own a fairly concentrated value portfolio with considerable active share and tracking error. For investors who want to have this value-exposure, I believe the ETF is an excellent implementation and a very good complement to a broad market ETF like VOO or VTI (see my articles here and here).
Given the methodology behind RPV and the strong empirical evidence for the value-premium, I therefore assign a long-term "Buy" rating. Finally, I think S&P deserves credit for the branding of their value style indices because "Pure Value" is indeed more Value than "Value"...
This article was written by

Analyst’s Disclosure: I/we have no stock, option or similar derivative position in any of the companies mentioned, and no plans to initiate any such positions within the next 72 hours. I wrote this article myself, and it expresses my own opinions. I am not receiving compensation for it (other than from Seeking Alpha). I have no business relationship with any company whose stock is mentioned in this article.
This content is for educational and informational purposes only and no substitute for professional or financial advice. The use of any information on this website is solely on your own risk and I do not take responsibility or liability for any damages that may occur. The views expressed in this article are solely my own and do not necessarily reflect the views of any organisation I am associated with. Given that I am based in Germany, I have no access to the mentioned securities for regulatory reasons. However, I do have beneficial long-positions in comparable securities.
Seeking Alpha's Disclosure: Past performance is no guarantee of future results. No recommendation or advice is being given as to whether any investment is suitable for a particular investor. Any views or opinions expressed above may not reflect those of Seeking Alpha as a whole. Seeking Alpha is not a licensed securities dealer, broker or US investment adviser or investment bank. Our analysts are third party authors that include both professional investors and individual investors who may not be licensed or certified by any institute or regulatory body.