Gold Market Commentary: Gold Gears Up For Brewing Crisis

Summary
- Gold rose by 9.2% during Q1, to US$1,980/oz, propelled by fears of an economic crisis and simmering geopolitical tensions.
- Gold closed 2022 in resilient fashion, buttressed by central banks and retail investors as rates and the US dollar soared.
- A bit of complacency, faith in central bankers and equity market resilience makes for an uneasy cocktail in the event of a full-blown crisis.
Oselote
Quarter in review: gold’s all-time high in sight
- Gold gained 9% in Q1 2023, but see-sawed on bond market volatility
- A surge in March to record the highest monthly inflows since 2019, reversed two weak months for global gold ETFs and futures investment
Looking forward
- Gold’s ‘mere’ resilience in 2022 may have been a disappointment to some. Despite crosswinds from unprecedented monetary tightening and spiking inflation, no real crisis materialized. But the risk of one is growing now
- Unprecedented rate hikes have started to break things, most notably in small US banks and the commercial real estate sector. While contained for now, it represents an increasing risk of systemic escalation
- With a US recession still on the cards, growing systemic risk adds to gold’s case.
Gold’s ATH in sight
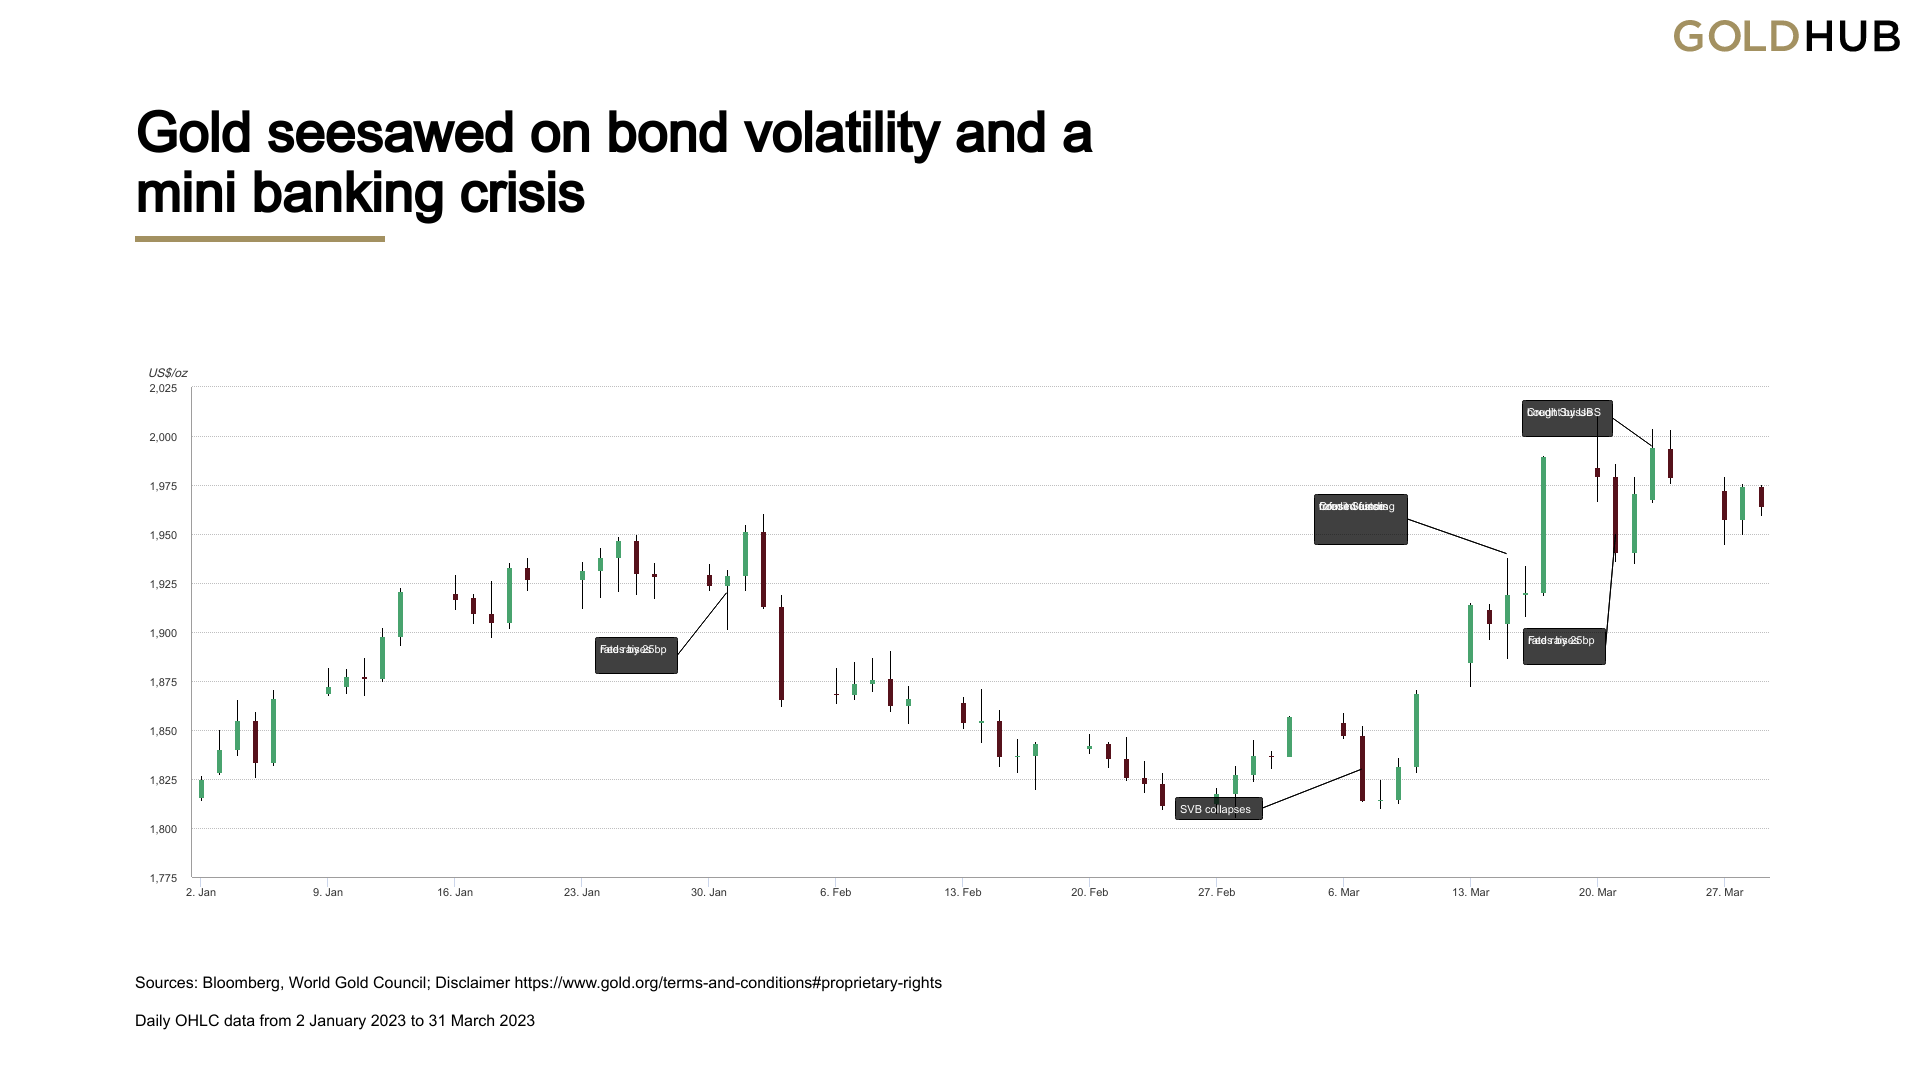
Gold rose by 9.2% during Q1, to US$1,980/oz, propelled by fears of an economic crisis and simmering geopolitical tensions (Table 1). While the sudden banking mini-crisis triggered by the collapse of Silicon Valley Bank (OTC:SIVBQ) drove gold higher towards the end of the quarter, yields (level and volatility) and the dollar remained ever-present drivers.
Chart 1: Gold seesawed on bond volatility and a mini banking crisis
Sources: Bloomberg, World Gold Council; Disclaimer
Note: daily data from 2 January 2023 to 31 March 2023
Towards the end of the quarter, gold was unsuccessful in sustaining momentum above the US$2,000/oz level, which it hit on three separate occasions in March (Chart 1). As concerns over the banking crisis eased, gold fell back somewhat as tactical demand for safe havens abated and gold fell back somewhat.
On a quarterly average basis, gold jumped to US$1,890/oz, just 1% off the record high seen in Q3 2020 (US$1,911/oz). This was against a backdrop of increasing confidence that the cycle of monetary tightening may soon end.
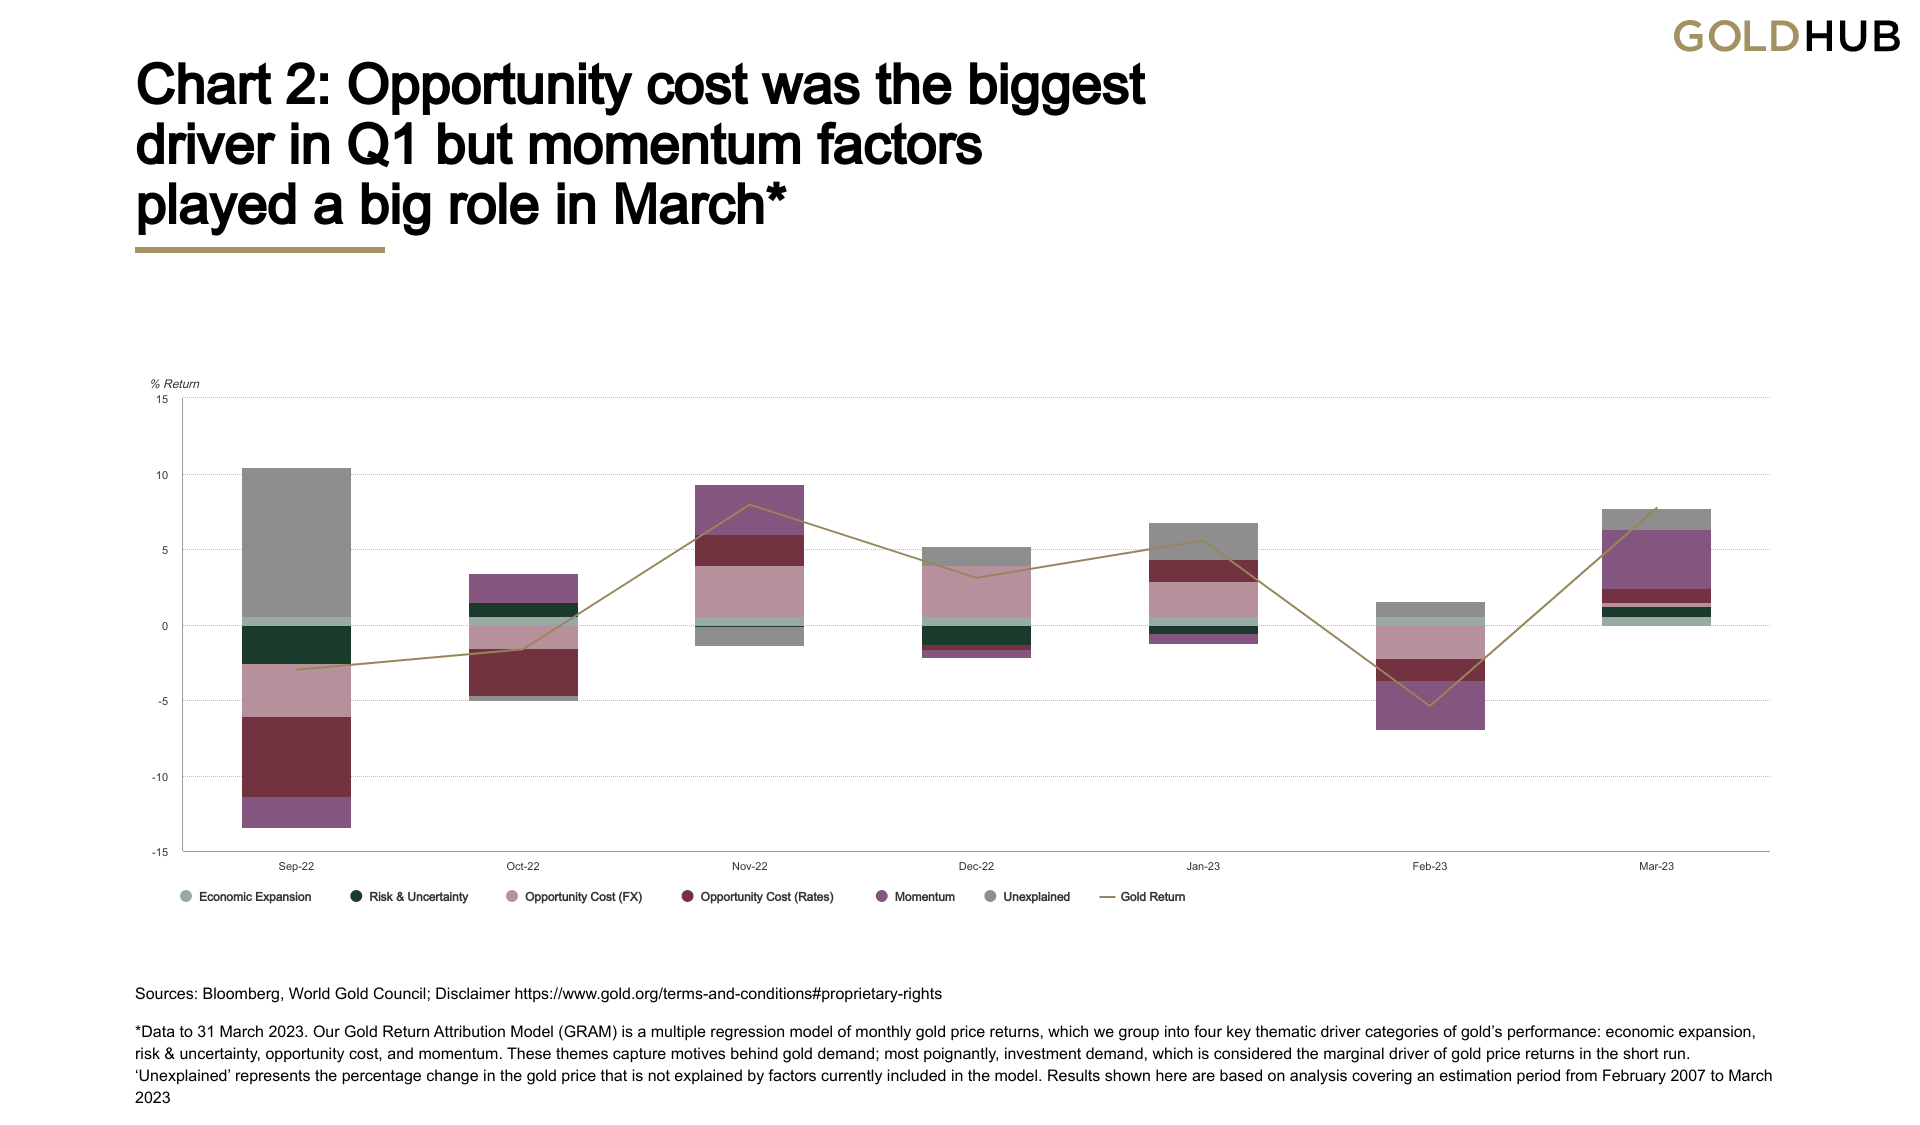
Using our Gold Returns Attribution Model (GRAM), gold found support from lower yields and, to a lesser extent, a weaker US dollar (Chart 2). It was a tumultuous quarter for yields, with a spike in interest rate volatility as rate expectations were repriced in response to the SVB event.
Yields on US 10-year Treasuries fell by 40 basis points, boosting gold’s performance.
We believe that focus should also be placed on the unexplained component of the model which was positive in each of the first three months.
This could, in part, represent the continued strength in central bank demand for gold. Using the rule of thumb from our Qaurum model that it takes c.30t of gold demand to move the price 1%, a 4.8% cumulative residual suggests a figure of about 140t gold, which coincidentally is close to that already reported by central banks so far.
Table 1: A solid quarter for gold in all major currencies
Gold price and return in different periods across key currencies*
| USD (OZ) | EUR (OZ) | JPY (G) | GBP (OZ) | CAD (OZ) | CHF (OZ) | INR (10g) | RMB (G) | TRY (OZ) | AUD (OZ) | |
| 31 March 2023 price | 1,980 | 1,826 | 8,456 | 1,605 | 2,676 | 1,812 | 52,308 | 437 | 37,971 | 2,961 |
| March return | 8.5% | 5.9% | 5.9% | 5.7% | 7.5% | 5.4% | 7.9% | 7.5% | 10.2% | 9.2% |
| Y-t-d Return | 9.1% | 7.8% | 10.6% | 6.9% | 8.8% | 8.1% | 8.4% | 8.8% | 11.9% | 11.2% |
*Data to 31 March 2023. Based on the LBMA Gold Price PM in local currencies
Source: Bloomberg, ICE Benchmark Administration, World Gold Council
Chart 2: Opportunity cost was the biggest driver in Q1 but momentum factors played a big role in March*
Sources: Bloomberg, World Gold Council; Disclaimer
*Data to 31 March 2023. Our Gold Return Attribution Model (GRAM) is a multiple regression model of monthly gold price returns, which we group into four key thematic driver categories of gold’s performance: economic expansion, risk & uncertainty, opportunity cost, and momentum. These themes capture motives behind gold demand; most poignantly, investment demand, which is considered the marginal driver of gold price returns in the short run. ‘Unexplained’ represents the percentage change in the gold price that is not explained by factors currently included in the model. Results shown here are based on analysis covering an estimation period from February 2007 to March 2023
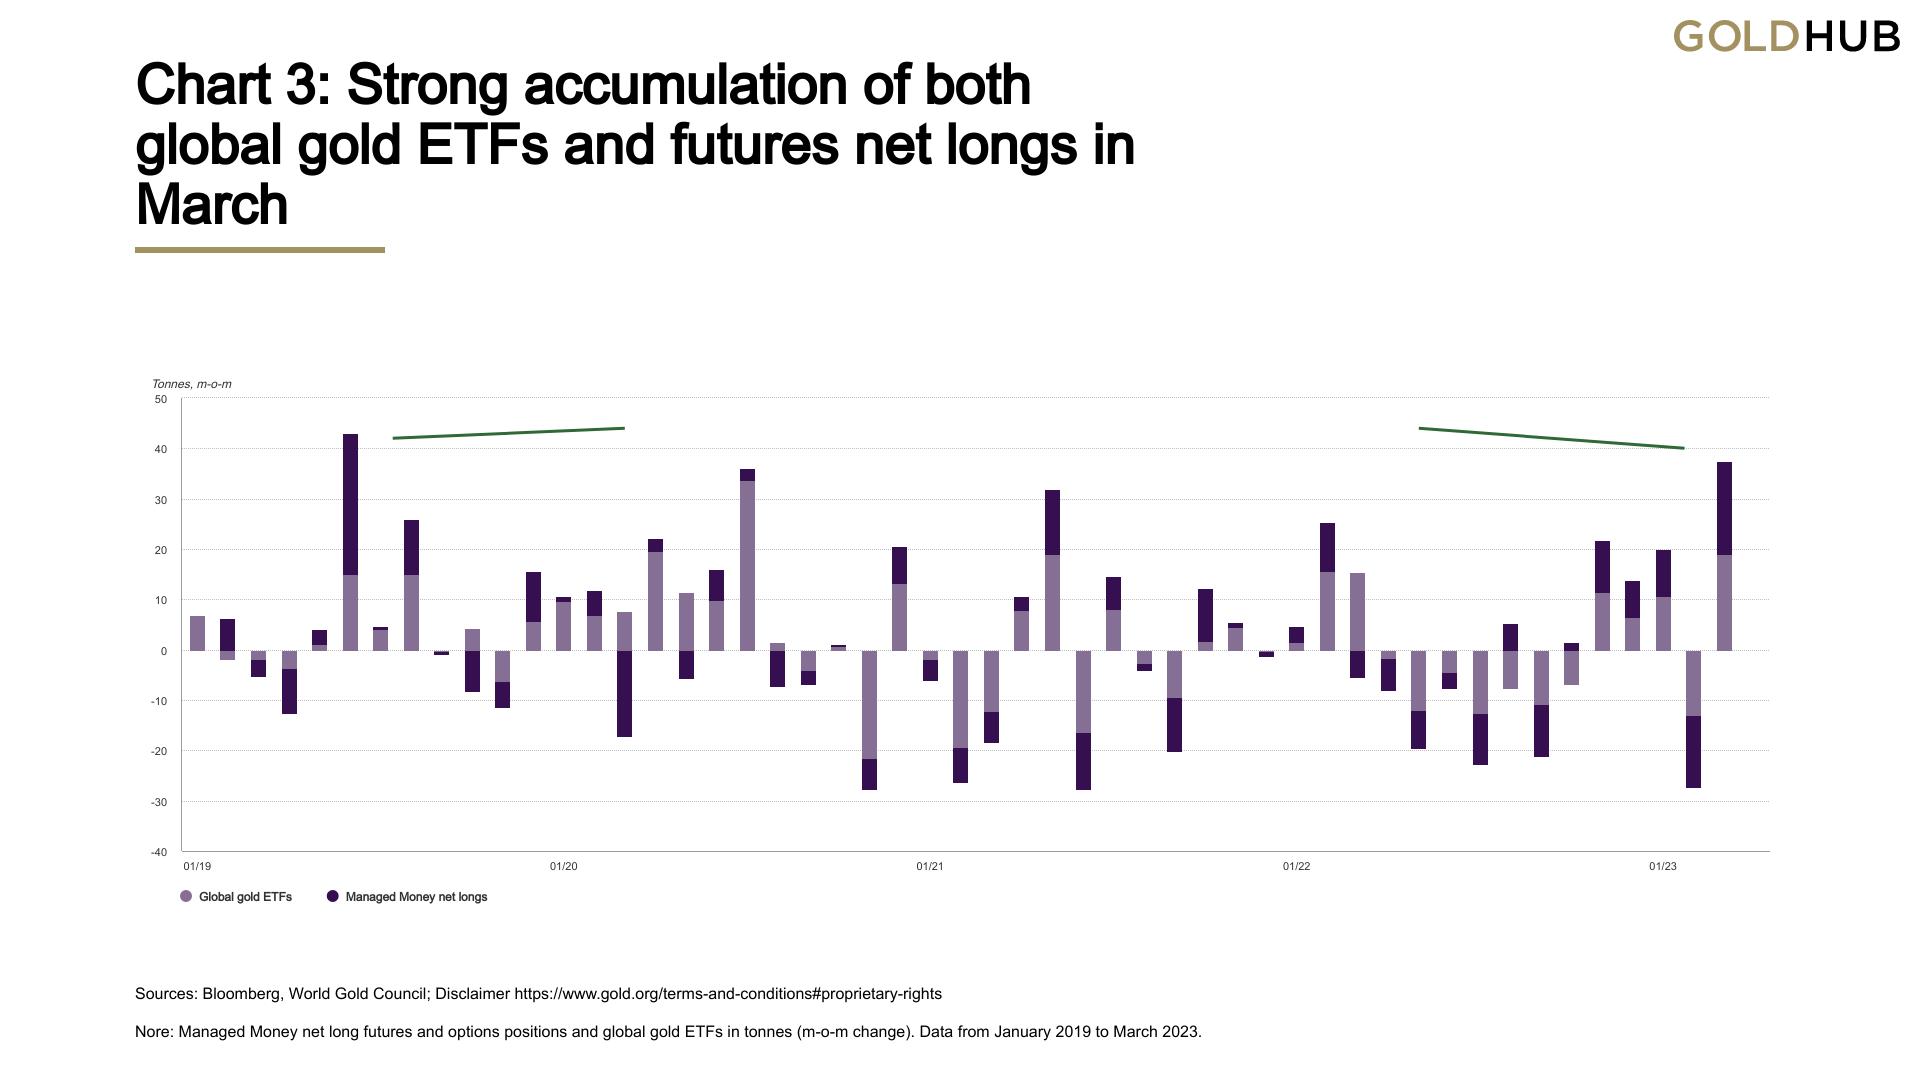
In contrast, global gold ETFs have had a much tougher start to the year. Echoing this was net positioning in COMEX gold futures, which remained relatively subdued for much of the quarter. But March saw combined inflows unmatched since June 2019 (Chart 3).
Chart 3: Strong accumulation of both global gold ETFs and futures net longs in March
Sources: Bloomberg, World Gold Council; Disclaimer
Note: Managed Money net long futures and options positions and global gold ETFs in tonnes (m-o-m change). Data from January 2019 to March 2023.
Crisis, what crisis?
- For some, gold’s ‘mere’ resilience in a challenging 2022 was disappointing, but gold held up because it has diverse sources of demand and 2022 was not a crisis year for growth assets
- But cracks from unprecedented monetary policy are beginning to show, most notably in small US banks and their intertwined commercial real estate sector, although these look controllable for now
- The case for an economic slowdown remains. Gold is handy in a recession as dry powder given that a weakened economy is more exposed to these financial cracks becoming systemic
Gold closed 2022 in resilient fashion, buttressed by central banks and retail investors as rates and the US dollar soared. The first two months of 2023 started in a similar vein.
But gold’s ‘mere’ resilience has been a disappointment to some. The last twelve months of heightened geopolitical tension and a 40-year high in inflation should have been an environment in which gold could thrive, and a flat year left many asking “should gold not have done better?”.
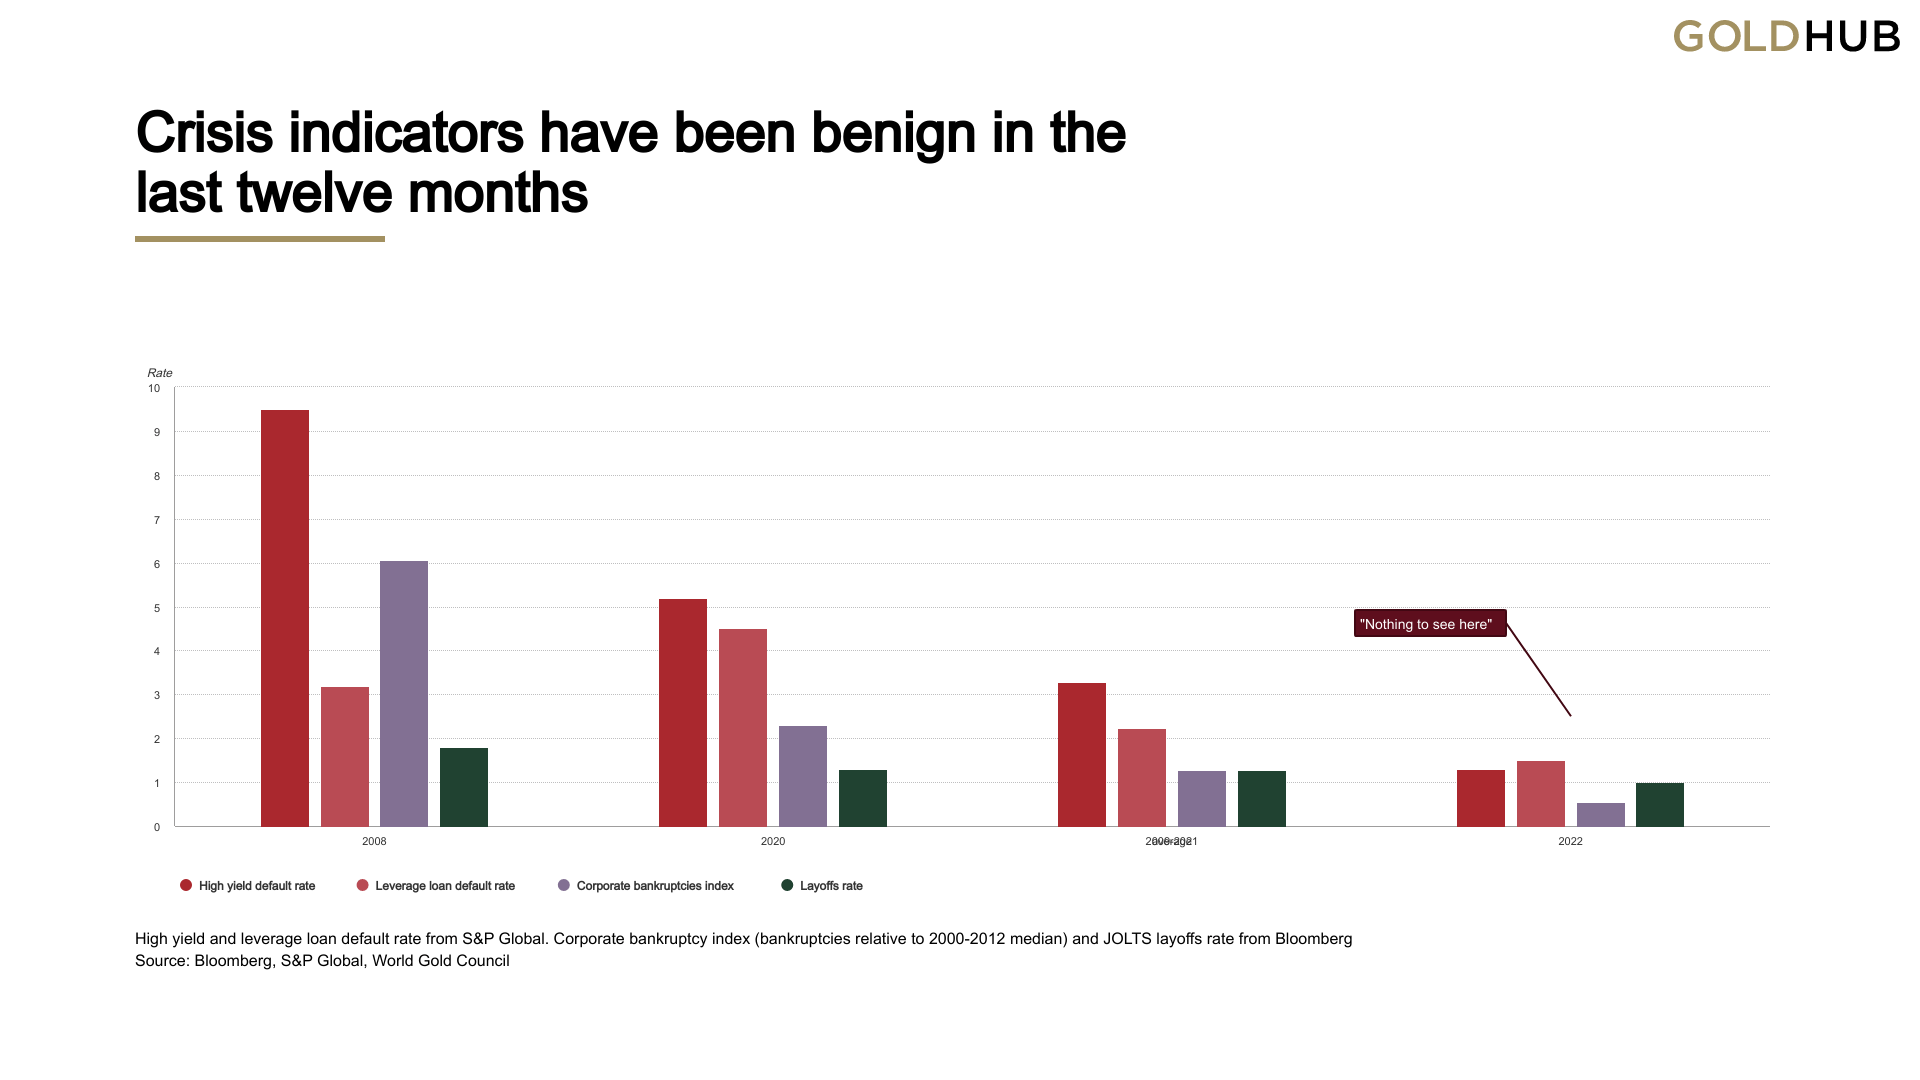
But if this had been the case, the impact on other corners of the markets would have likely been far worse. Although bonds had one of their most dire years for decades, it was barely a ‘bear market’ for equities.1 And 2022 experienced neither recessions, defaults, bankruptcies or large scale layoffs (Chart 4).
Chart 4: Crisis indicators have been benign in the last twelve months
Sources: Bloomberg, World Gold Council; Disclaimer
Note: high yield and leverage loan default rates from S&P Global. Corporate bankruptcy index (bankruptcies relative to 2000-2012 median) and JOLTS layoffs rate from Bloomberg
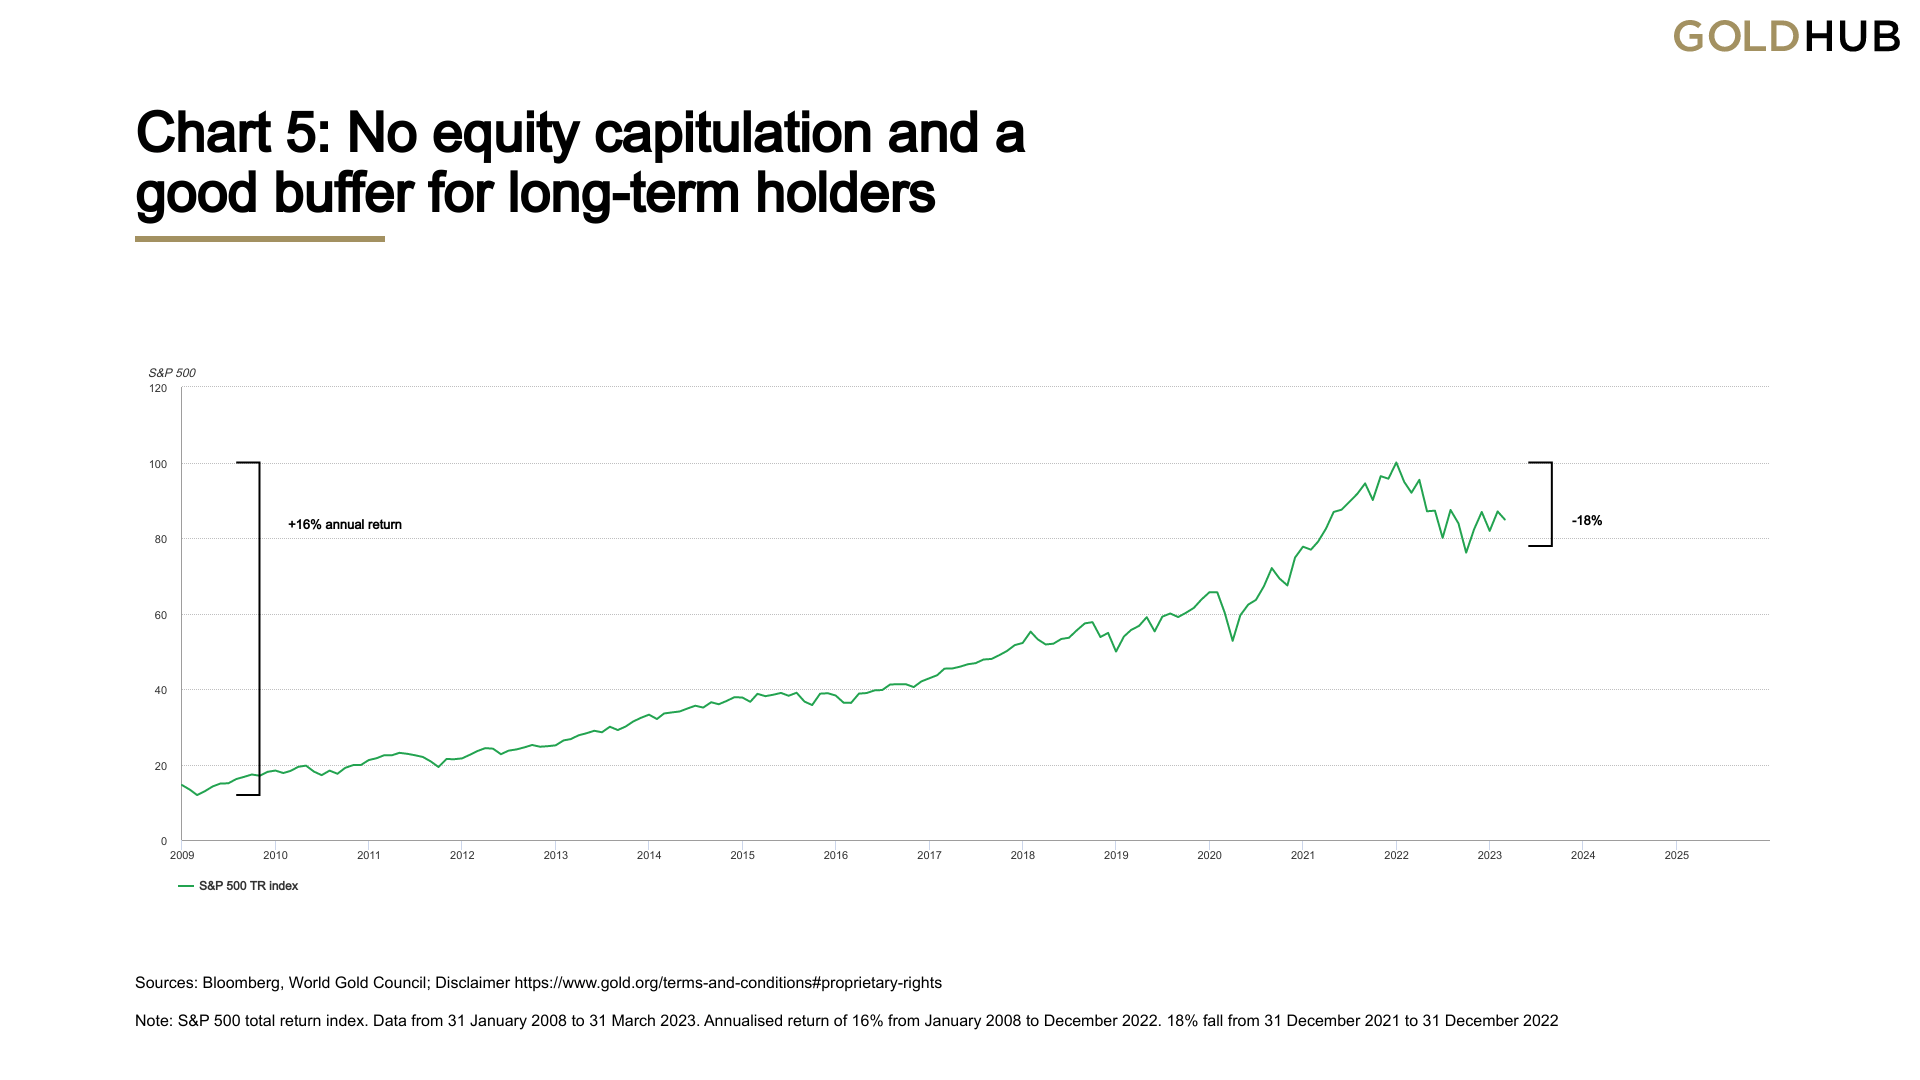
Furthermore, unless you were unfortunate enough to have bought at the beginning of 2022, the drop in equities would have been cushioned by stellar prior returns (Chart 5).
Chart 5: No equity capitulation and a good buffer for long-term holders
Sources: Bloomberg, World Gold Council; Disclaimer
Note: S&P 500 total return index. Data from 31 January 2008 to 31 March 2023. Annualised return of 16% from January 2008 to December 2022. 18% fall from 31 December 2021 to 31 December 2022
The first cracks appear
But during March provided the first cracks in the US economic armour appeared with several small bank failures. It’s not surprising that after such an unprecedented pace of hiking, something had to give. The problem with banks is that they are inherently part of a fragile system. Fractional banking works well until it doesn’t.
For now, the focus is on small banks and the sector they are intrinsically wedded to: commercial real estate (CRE). 2 No doubt, the devil will be in the details and, as yet, the outcome of this mini-crisis episode remains unknown.
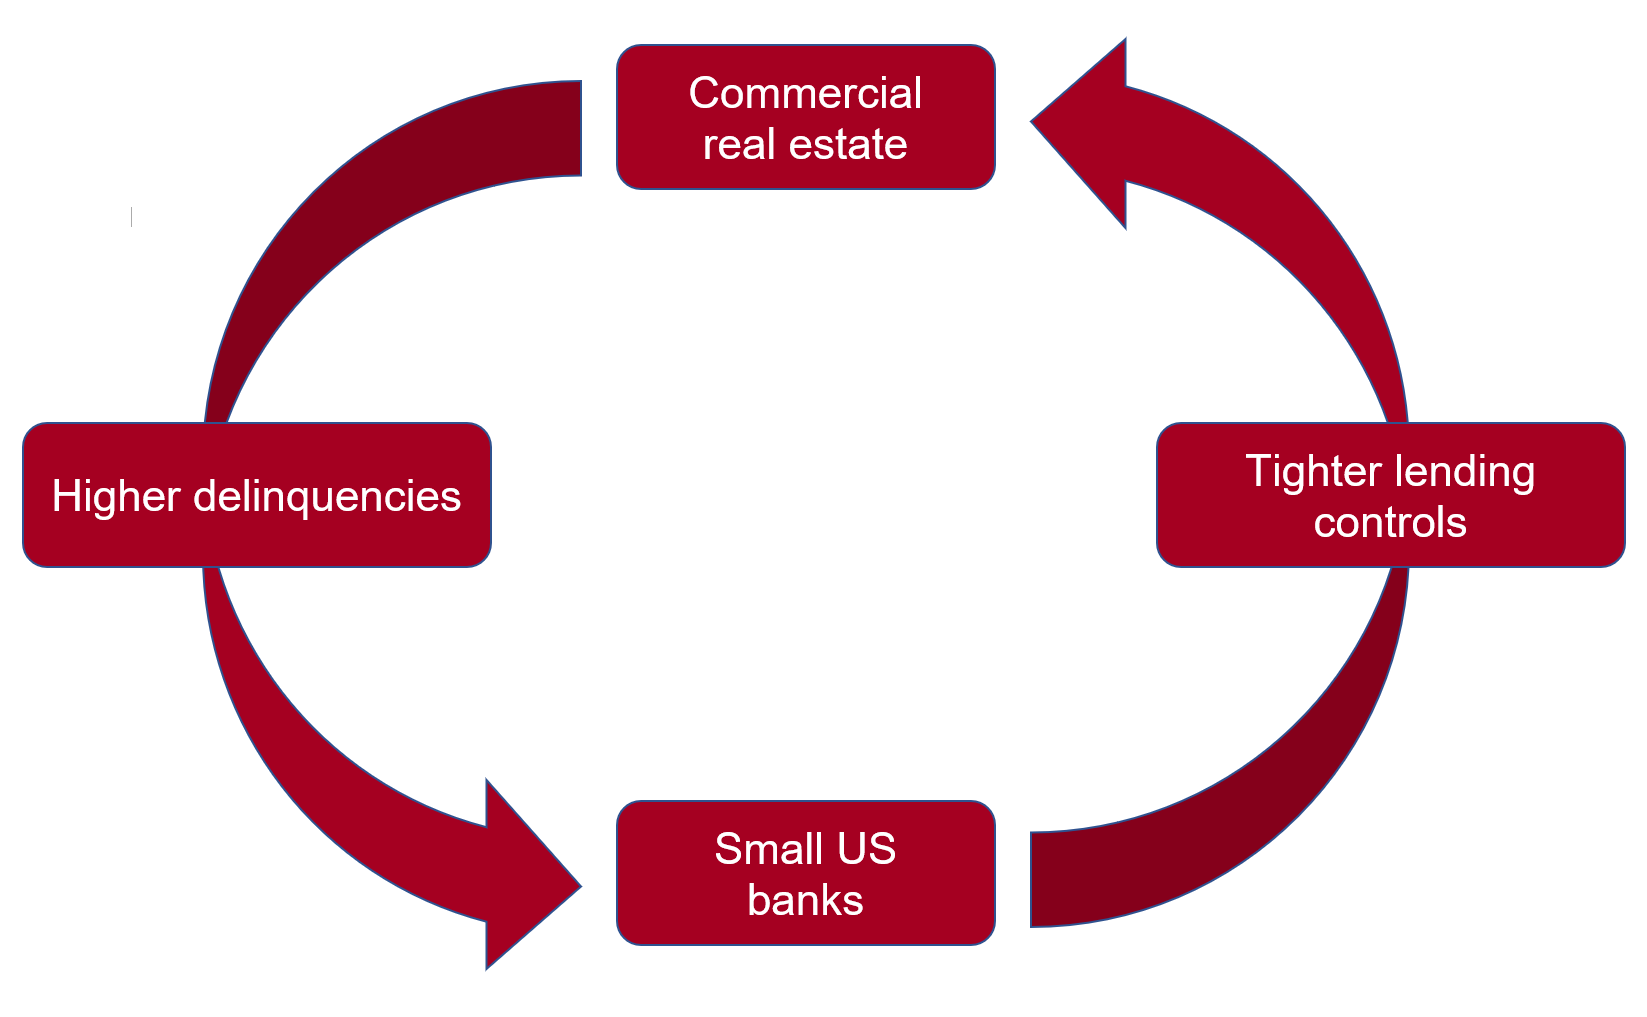
But for now, the Fed and other central banks’ initiatives have prevented an escalation of deposit-flight woes at banks and a full blown CRE doom-loop crisis also looks contained (Figure 1).
- The most visible distress, is evidenced by over supply of office space, largely a consequence of remote working. This is a relatively small part of the CRE sector and represents about 4-5% of debt that needs to be refinanced in 2023 3
- Valuations across the CRE sector are lofty, but lofty valuations, unlike defaults, are not in themselves a systemic issue. The CRE sector remains cushioned for now with loan to value ratios at manageable levels. 4
Figure 1: The dreaded doom loop is not here, yet
Source: Bloomberg, World Gold Council
Note: CRE loans represent 70% of small banks lending. CREs receive 60% of their loans from small banks. Tighter lending standards may force CREs into insolvency, in turn raising lending controls by banks and so on.
Markets aren't positioned for a tail event
And despite the increasing proliferation of tail events over the past two decades, there has been a lull in the last twelve months.
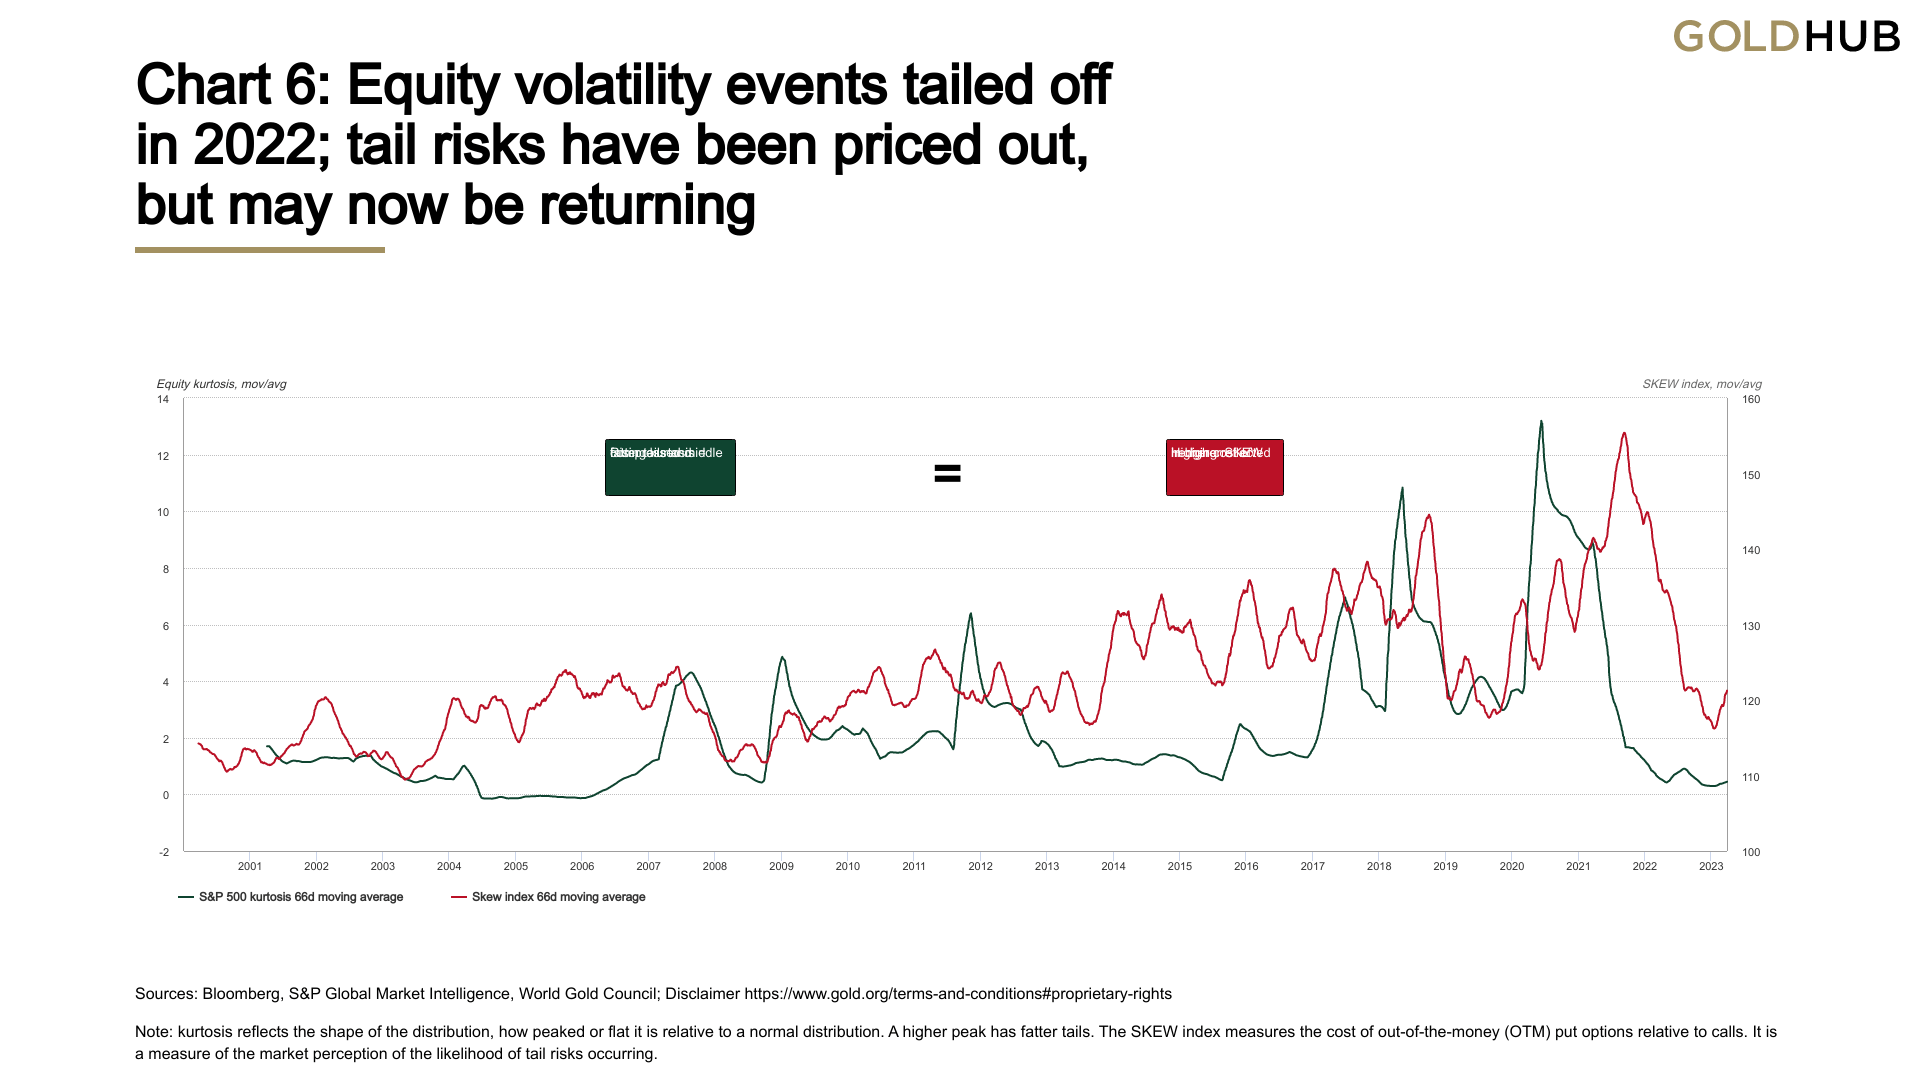
Market complacency about such risks, judging by the SKEW index which measures the market expected likelihood of tail events, is a worry (Chart 6). Sitting with put options in the event of a big drop is an increasingly expensive endeavour. This may explain the rising interest in 0DTE options which let investors avoid the cost of exposure during the calm of normal markets and potentially profit from big moves on specific market risk days, such as CPI releases or Fed meetings.
The share of these options has risen from 19% to 44% of average option volume in a year. 5 Although effective as single-day event risk hedges, they are likely insufficient should something more material transpire and can pose a risk themselves as a proportion of these are not being hedged by market makers.
In summary
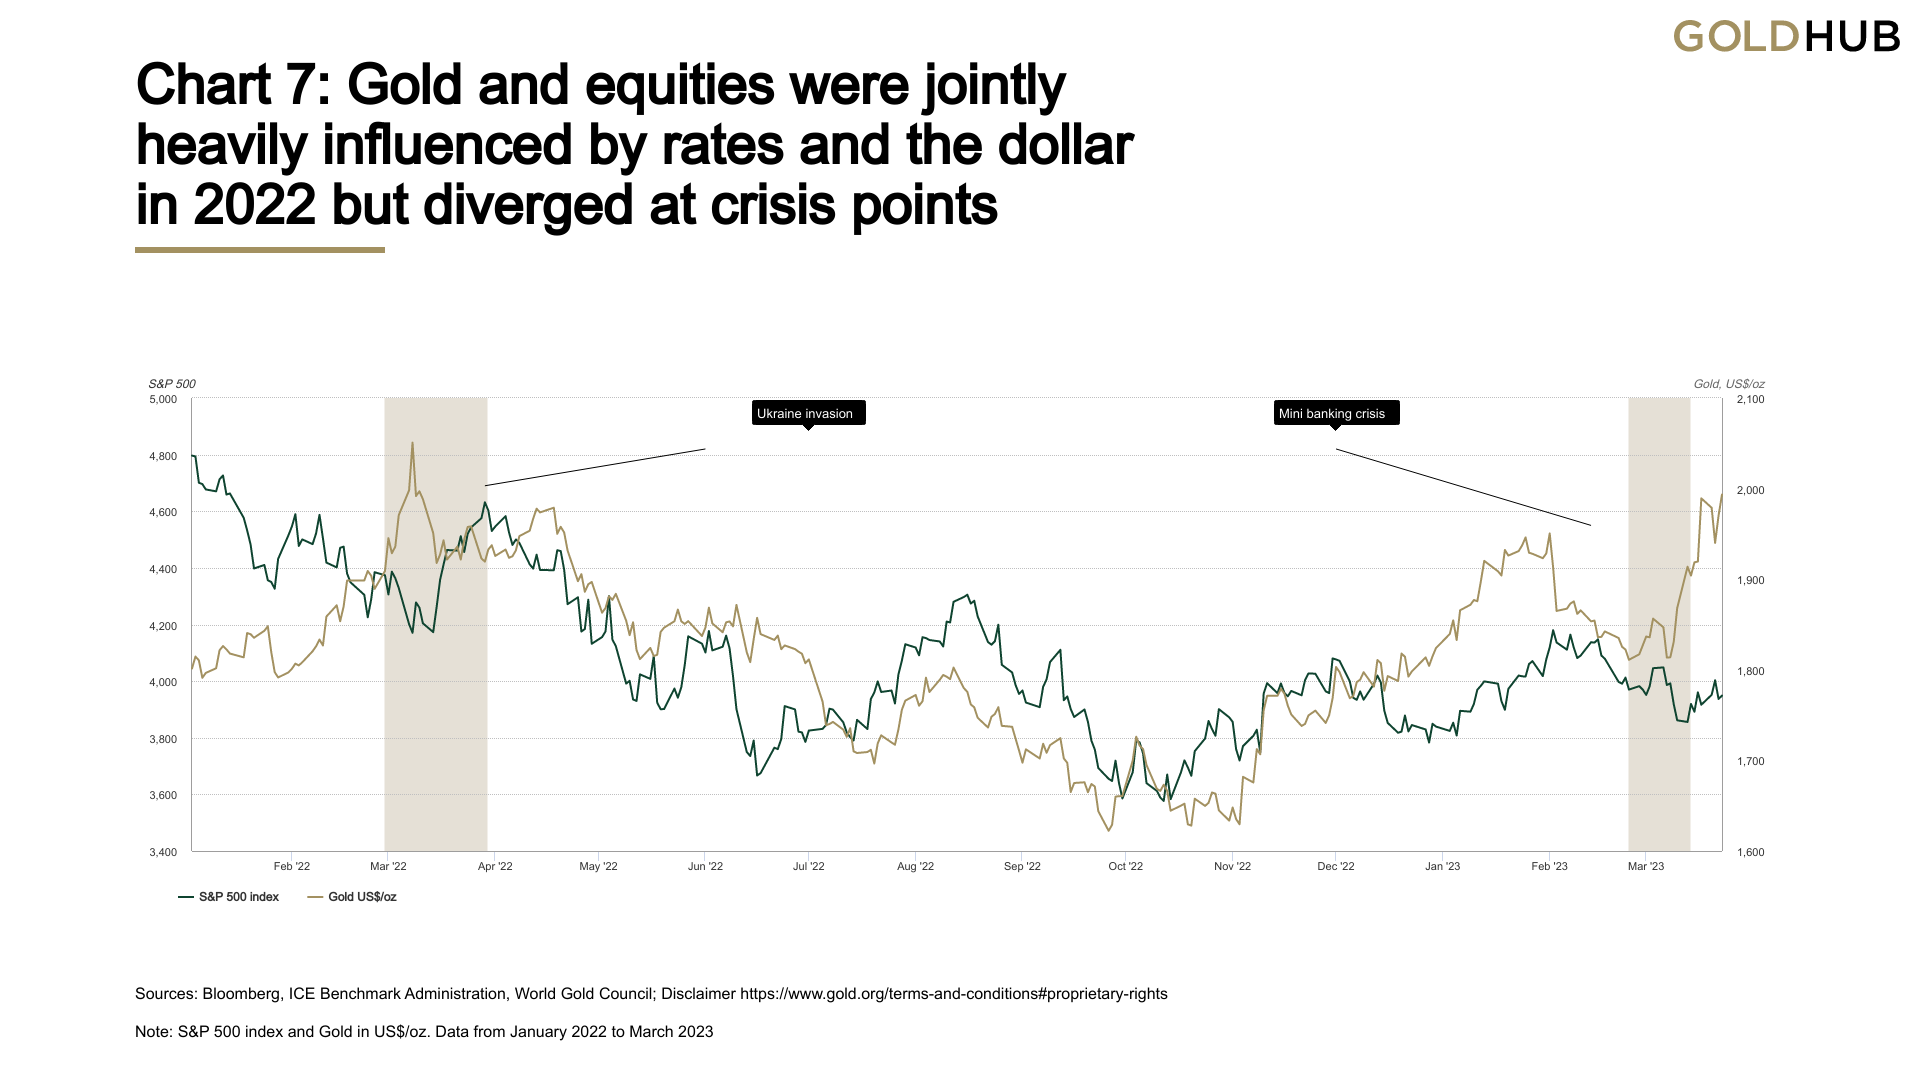
A bit of complacency, faith in central bankers and equity market resilience makes for an uneasy cocktail in the event of a full-blown crisis. But since such crises are almost impossible to time, a strategic holding to gold makes sense. Gold has historically responded well in such scenarios, as it did recently during the Ukraine invasion in February last year and the Silicon Valley Bank collapse in March (Chart 7) - a pattern that is historically proven for gold during such times of volatility
Chart 6: Equity volatility events tailed off in 2022; tail risks have been priced out, but may now be returning
Sources: Bloomberg, S&P Global Market Intelligence, World Gold Council; Disclaimer
Note: kurtosis reflects the shape of the distribution, how peaked or flat it is relative to a normal distribution. A higher peak has fatter tails. The SKEW index measures the cost of out-of-the-money (OTM) put options relative to calls. It is a measure of the market perception of the likelihood of tail risks occurring.
Chart 7: Gold and equities were jointly heavily influenced by rates and the dollar in 2022 but diverged at crisis points
Sources: Bloomberg, ICE Benchmark Administration, World Gold Council; Disclaimer
Note: S&P 500 index and Gold in US$/oz. Data from January 2022 to March 2023
Regional insights
China: China’s wholesale gold demand rebounded in March as the average daily trading volume of Au9999 saw a 3% m-o-m rise. This mirrors historical patterns: manufacturers tend to reload in March before tapering off in Q2, an off season for gold in China. Despite a 7% local gold price rise, which usually weighs on demand, March’s rebound also reflected manufacturers’ optimism for future consumption. Chinese gold ETFs saw their first monthly inflow in 2023, mainly due to improved interests in gold amid the price strength. The monthly average Baidu Index for the keyword “gold” reached the highest in a year.
Europe: Both the ECB and BoE defied calls for a pause in their aggressive monetary tightening – raising interest rates by 50 and 25 basis points respectively in March. Policymakers at both institutions remain laser focused on inflation, despite the concerns around financial stability caused by tighter lending conditions and increased systemic risk in relation to the banking crisis in the US and Switzerland. These worries also led to a change in fortunes for European-listed gold ETFs, which saw inflows of US$927mn (+18t) during March, primarily into UK funds.
United States: The failure of two US regional banks show that the effects of monetary tightening take time to filter through the economy and that the vulnerabilities associated with an aggressive tightening phase often show up in unexpected places. As economic damage and financial instabilities come to light, the US Federal Reserve continues to be faced with an unavoidable trade-off: either suppress economic activity or tolerate inflation. And while the Fed sounded the most dovish for some time during its March meeting, it raised its policy rate by another 25 basis points, clearly separating its response to the banking tumult and its inflation fight.
Central banks: Reported global gold reserves increased by 52t in February – the eleventh consecutive month of net purchases – following January's 74t. This maintains the upward trend (based on the 12-month moving average) that has been in place since June 2022. On a y-t-d basis, central banks have reported net purchases of 125t, the strongest start to a year since at least 2010 when central banks became net buyers on an annual basis. Read more here.
ETFs: Global physically backed gold ETFs witnessed net inflows of US$1.9bn (+32t, +0.9%) in March, the first time since April 2022 (Table 2). The strong gold price performance during the month helped ETF demand. But this was not enough to prevent the net quarterly outflows of US$1.5bn (-29t, -0.8%).
European funds led inflows (+US$927mn, +18t) in March. And they (-US$2.4bn, -40t) also accounted for the bulk of global outflows during the first quarter. In Q1, North America (+US829n, +10t) and the Other region (+US124mn, +2t) saw net inflows while Asia (-US46mn, -1t) experienced mild outflows
Table 2: Global gold ETFs saw net inflows for the first time in ten months
Gold ETF holdings and flows by region*
| Total AUM (BN) | Fund Flows (US$mn) | Holdings (tonnes) | Demand (tonnes) | Demand (% of holdings) | |
| North America | 110.6 | 806.5 | 1,737.40 | 11.5 | 0.67% |
| Europe | 97.1 | 927.1 | 1,525.80 | 18.4 | 1.22% |
| Asia | 7.9 | 202.6 | 117.9 | 3.3 | 2.87% |
| Other | 4 | -62.7 | 62.6 | -1.1 | -1.75% |
| Total | 219.6 | 1,873.60 | 3,443.80 | 32.1 | 0.93% |
| Global inflows /Positive Demand | 5,840.80 | 50.7 | 2.91% | ||
| Global outflows /Negative Demand | -3,967.20 | -18.6 | -1.98% |
*Data to 31 March 2023. On Goldhub, see: Gold-backed ETF flows (Registration Required).
Source: Bloomberg, ICE Benchmark Administration, World Gold Council
Footnotes
The common definition of a bear market is a fall in excess of 20%. The S&P 500 total return index reached a low of -24% but recovered to -18% by year end.
Small banks constitute c.70% of lending to CREs, and CREs make up c.60% of small banks’ loans. Source: Vanda Research
Odd lots, 20 March 2023
FT, Unhedged. 29 March 2023
Reuters, “The Rise of 0DTE stock options and how they could be a risk to markets”
Editor's Note: The summary bullets for this article were chosen by Seeking Alpha editors.
This article was written by
