Making A Case For iBonds High Yield Term Based ETFs

Summary
- Many investors lack appropriate exposure to corporate debt positions.
- iBonds ETFs provide structural and strategic benefits for investors.
- iBonds ETFs mitigate many common risks for investors. Consider your needs before investing.
- High yield corporate bond returns are higher than they have been in over a decade.
- Utilize different bond ladders configurations to increase returns.
Andres Victorero
Thesis
"Rule No. 1 is never lose money, Rule No. 2 is never forget Rule No.1"
- Warren Buffet
Capital preservation and consistent income is a priority for many investors and fixed income products utilized in proper investment vehicles can align well with those priorities. These priorities combined with the uncertainty and fear in today's investment environment should push capital into more stable financial markets like money markets and debt markets. The benefit of this is that current fixed income investment yields have finally returned to more acceptable levels that can actually outperform inflation (investment dependent) and be wealth accretive. Currently, debt returns are projected at a higher rate and it is a good time for many investors whose investment strategies should align with a larger debt position to move into these positions. The options that are presented in this article are to utilize High Yield Term iBonds (IBHC)(IBHD)(BATS:IBHE)(IBHF)(IBHG)(IBHH)(IBHI) as managed by BlackRock (BLK) due to their better returns and risk mitigating structures depending on investor goals and needs.
Identifying The Problem: Most Households Lack Enough Debt Instruments
According to SIFMA market estimates, the fixed income market is substantially larger in comparison to the equity markets as represented in the figure below.
Global Capital Markets (SIFMA)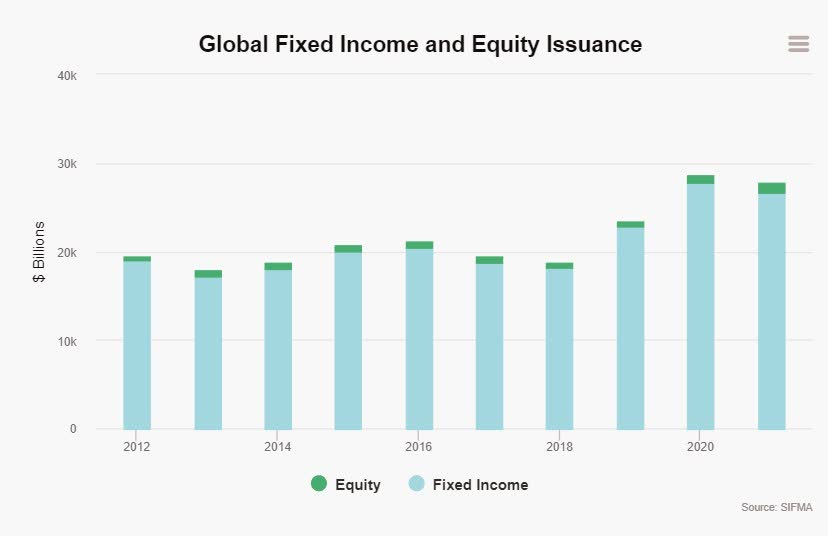
The figure below shows the capital allocation trend of select household assets in the U.S. on a ratio scale (non-linear) as of Q4 2022. The green line representing debt securities represents $4.5 trillion (7.2%) while deposits and equity shares at market value represent $18.2 (29.3%) and $39.4 (63.4%) trillion, respectively.
U.S. household selected assets (Federal Reserve & Yardeni Research)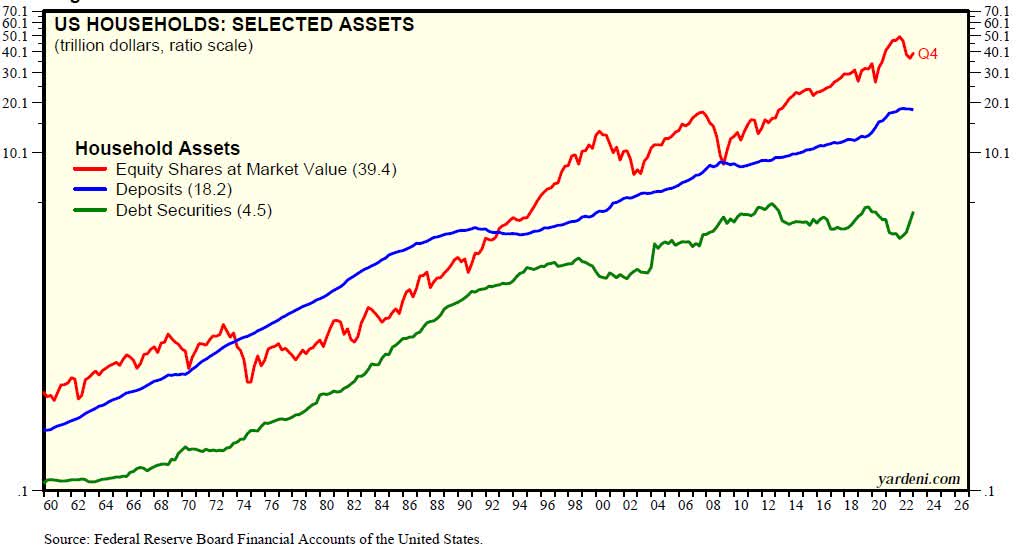
Breaking the types of debt down further, notice that in 2021, U.S. households typically only held a small portion of corporate bonds at 0.2% (excluding the allocation via mutual funds strategies).
Household Financial Assets (SIFMA)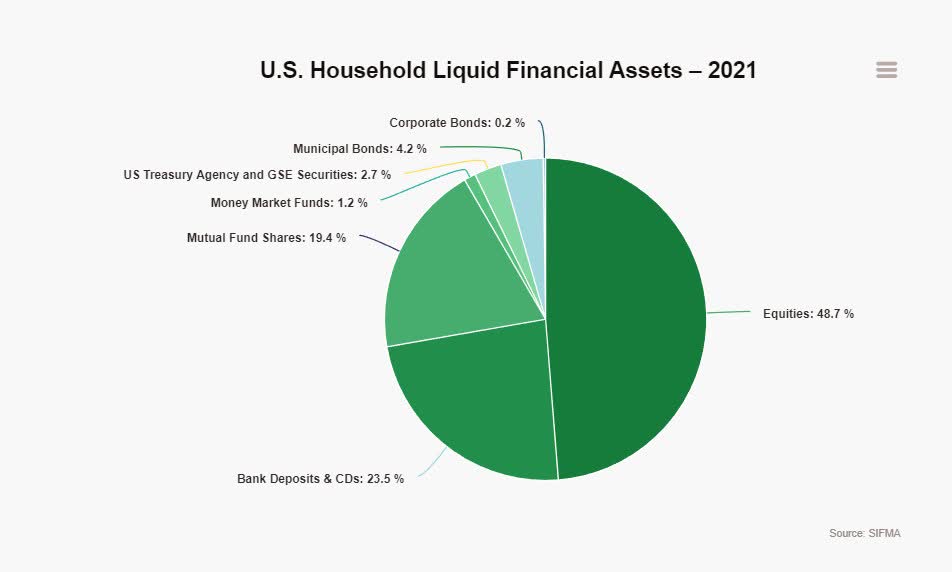
Continuing on the trend of household holdings of debt instruments, notice that most U.S. households corporate debt allocations (prior figures) do not align well with surveyed millionaires (next figure). The millionaires in this study hold other U.S. bonds at 9.6% of their portfolios which when including CDs, money markets, international bonds, and government bonds is cumulatively almost 25%.
Portfolio holdings of surveyed millionaires (Millionaires Speak: What Drives Their Personal Investment Decisions? (Svetlana, Choi, Dyson, & Robertson))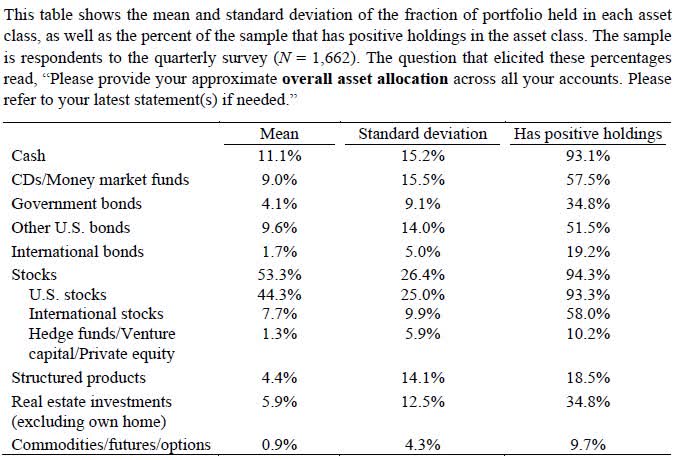
Conclusively, the objective of this was to illustrate that many households and smaller investors likely do not allocate enough of their wealth towards fixed income investments and specifically corporate debt.
Why Don't Households Buy Debt Instruments?
According to a survey conducted by BNY Mellon Investment Management from 2019, many Americans have "little knowledge about various fixed income markets and how to invest in them" and unsurprisingly don't purchase them as a result. The lack of education regarding fixed income securities is probably the largest barrier while other barriers to purchases are likely caused by a lack of access, less product liquidity, associated fees, historically poor returns comparable to other assets, and commonly larger sums needed for individual purchases.
Why Should Investors Allocate Towards Fixed Income?
Fixed income investing should be a part of many portfolios considering the better yields that are to be had presently in comparison to the recent past. The figure below helps illustrate how high quality/investment grade yields have risen back above levels not seen since 2009-2010.
Treasury corporate bond high quality yield curve (Author, U.S. Dept. of Treasury)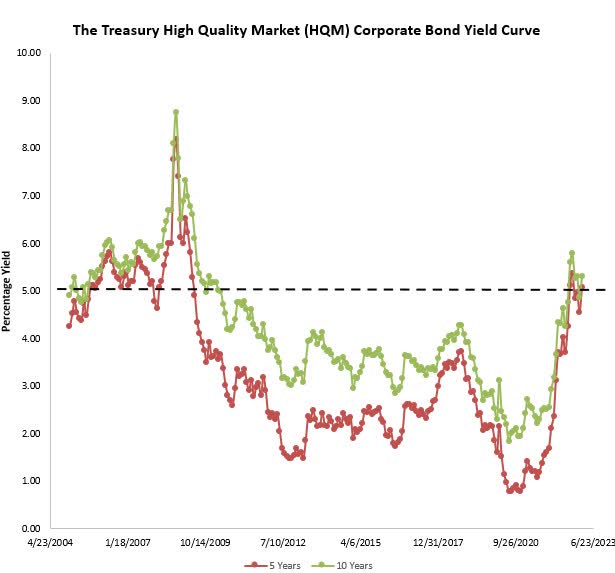
The following figure shows the returns for various debt instruments by year between 2007 and 2021. With the current federal funds rate close to 5%, the yields on these instruments are more comparable to 2007 and 2008 than any time in between. This figure should help clarify investor expectations in the present compared to the past.
For the specifics of this article, observe the Baa corporate rates with a high of 6.48% in 2007 and how they are typically priced 50 to 150 basis points higher than Aaa corporate rates meaning that investors can expect high yield debt (non-investment grade) returns to presently range anywhere between 6% to 8%.
Average returns (SIGMA)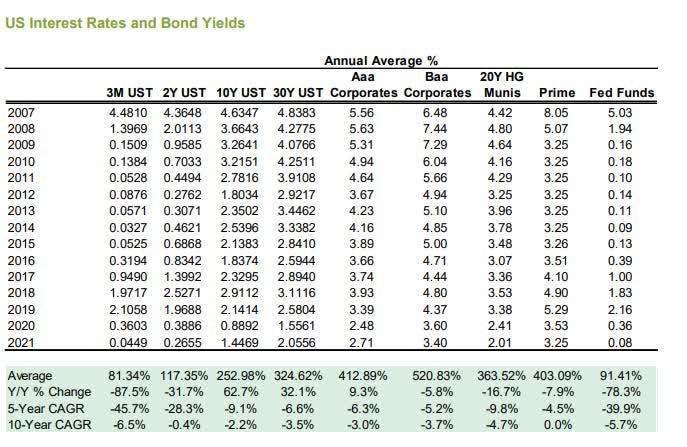
Investors that should be interested in fixed income instruments are those that seek repeating income streams with lower risk and volatility, don't mind smaller returns in respect to equities (theoretically), and those that are less prone to liquidity risks.
The Case For An iBonds High Yield ETF
So the case is now presented as a lot of U.S. portfolios have less than ideal portfolio allocation for corporate debt instruments. More specifically, this article advocates for establishing a position in high yield debt due to current return potential. This is where bond ETFs can be of use to investors. For this article, the focus is on the BlackRock iBonds High Yield series (there are others as well) as there are some benefits to this instrument that may be suitable for investors with certain needs. The structure and design of these products can help mitigate a lot of the risks, capital requirement barriers and educational barriers of buying instruments like this that investors face.
iBonds ETFs combine the benefits of multiple other products for investors as referenced in the figure below. They offer a diversified bond portfolio (mitigate credit risk), multiple debt instruments (treasury, municipal, IG corporate, and HY corporate) that gives monthly distributions (income stream), through an ETF (better costs, access, and liquidity), with a set maturity date at the end of a designated period (mitigate interest rate risk via hold-to-maturity option).
iBonds structure comparison (Blackrock)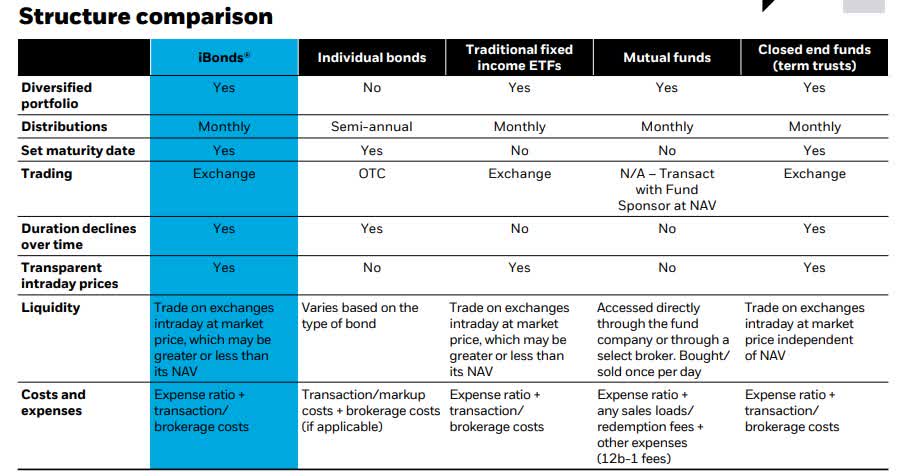
Why High Yield iBonds
High yield debt is accompanied by higher returns compared to other debt higher credit rated debt along with higher risks. The strategy for this class of ETF specifically is to utilize bond ladders to maximize HY returns and decrease risks over a set period of time. The figure below is an example of how to emphasize the yield-to-maturity returns while unequally distributing across multiple high yield iBonds ETFs. Observe how the price-adjusted YTM varies depending on the maturity year and the number of bond holdings in each ETF vary. The intent in this scenario was to capture a wider net of holdings (1600 bonds) and emphasize a higher total yield (7.73%) after adjusting for ETF fees. The ETFs will also mature on a yearly basis which allows for reinvestment decisions at that time period of new information to take place. This does not include exchange fees/commissions as they vary by exchange and will have a significant impact on the yield.
iBonds high yield bond ladder (Author)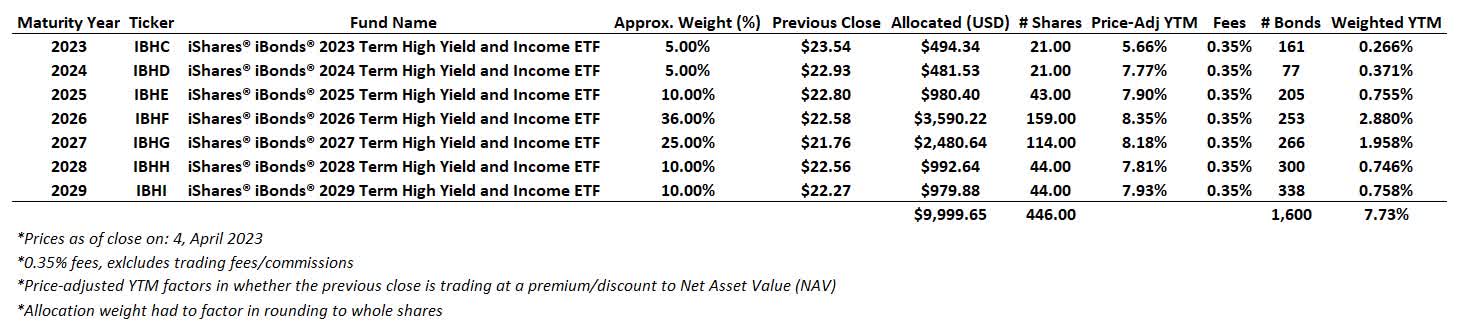
Risks
Country Risk
The combination of these holdings is distributed across geography with a heavy emphasis in the U.S. Notice how the distribution is primarily developed markets which helps to mitigate country specific risks while benefiting investors through more diversification. Being predominantly in the U.S. is also a positive considering the strength of U.S. debt markets in comparison to other countries.
iBonds high yield geography distribution (Blackrock)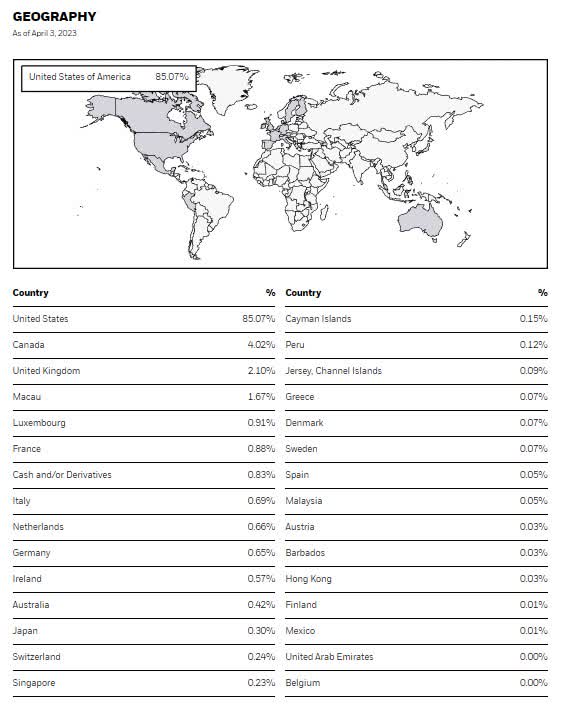
Sector Risk
The sector distribution is allocated more heavily towards certain sectors though there is a diversification aspect benefitting investors. It is important for investors who are seeking less risk to diversify across sectors as it helps to mitigate losses in the underlying securities returns.
iBonds high yield sector distribution (Blackrock)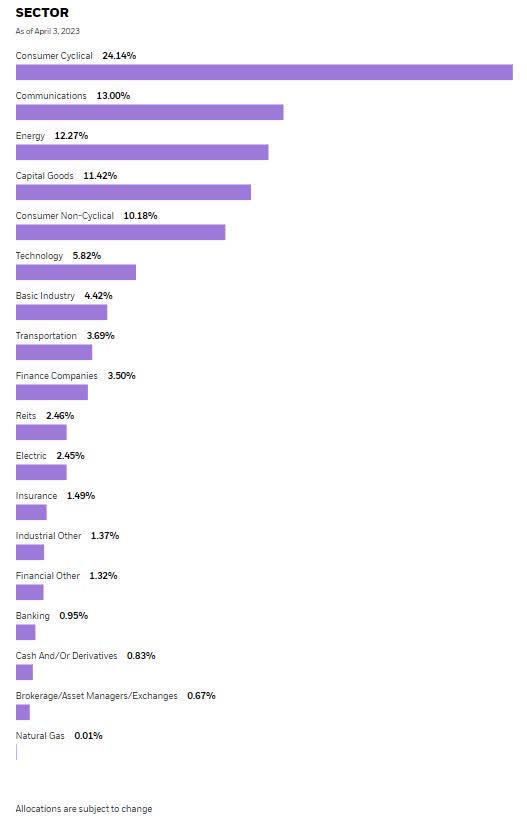
Credit Risk
Credit risk is a risk referring to the inability for the company to fulfill their payment obligation to investors. Fortunately, debt investors are a higher priority than equity investor and holding through a diversified portfolio managed through an institutional manager decreases the risk of loss substantially. The credit quality distribution below is aligned with the high yield goal of being more speculative grade credit quality companies. These lesser credit ratings provide a premium in returns for investors though it is important to diversify credit quality across your portfolio which can be done by adding investment grade debt as well. Having a portfolio of strictly high yield (lower credit quality) instruments is not ideal, though it can be a good addition if positioned appropriately.
iBonds high yield credit quality distribution (Blackrock)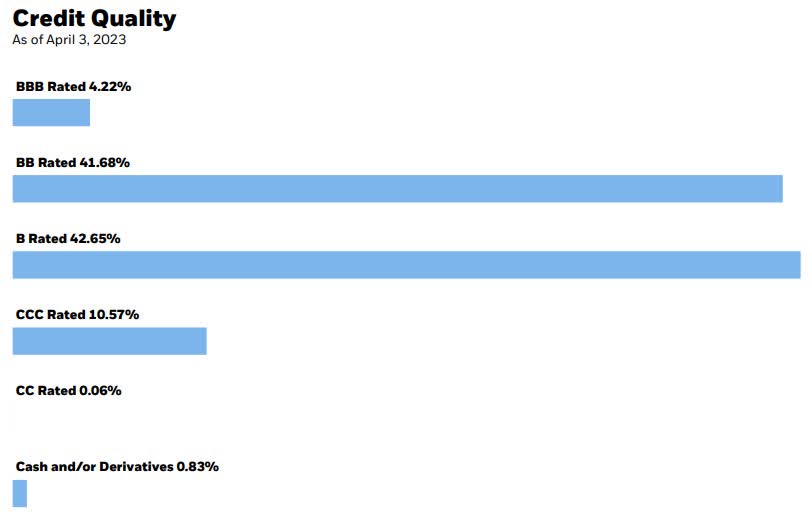
According to Fitch ratings, high yield defaults in the U.S. historically average close to 3.6% across all issuers. The highest default sectors are also typically telecom, broadcasting/media, healthcare/pharma, and retail; some of which are heavy sector exposures in the iBonds holdings discussed above. The figure below shows the sensitivity of the number of holdings in respect to a changing default rate.
Default rate sensitivity analysis (Author)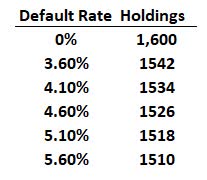
Liquidity Risk
Liquidity risk from an investor perspective is the risk that immediate cash is needed and the investors can't recover the full value of their holding within a short-term time period. This is a common issue for holding debt instruments (like SVB recently found out) in the sense that debt holders may need to sell at a discount to liquidate their holdings. Fortunately, ETFs allow for more liquidity though the price action may not be favorable for the investor at the time they need to sell. One way to mitigate this risk is to ensure that liquidity requirements are met elsewhere and that the security can be held to maturity.
Interest Rate Risk
Interest rate risk is the risk that an increase in interest rates have on debt instruments due to an inverse relationship ultimately decreasing the value at that time. This can also be mitigated by holding the debt instrument to maturity. However, it is important to note that the inverse is true as well, if interest rates decrease then the value of the debt instrument will increase and an investor could sell their holdings earlier at a premium to their cost basis. Thus, the management of interest rate risk now has three exit opportunities for iBonds which are 1) price declines, sell at loss 2) price increases, sell at gain 3) do nothing, bonds mature and investors collects principal at that time. The third option is what separates these types of products from other bond ETFs in the form of an advantage for certain portfolios.
Fees/Costs/Taxation
The fees for iBonds High Yield ETFs are 0.35%. Creating a screener on Seeking Alpha allowed the filtering of 75 High Yield Bond ETFs with the results of their expense ratios in the figure below. This shows that the iBonds HY ETFs are below the median 0f 0.39% and well above the most competitive 0.10%. The fees impact investor yields, so it is critical to find the appropriate tool for the desired strategy.
Expense ratio comparison (Author)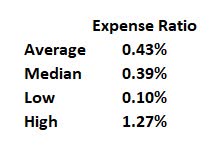
Trading costs and commissions from brokerage firms and exchanges can severely deteriorate the yield to maturity of these holdings. Many firms offer no-commission ETF transactions which should be a consideration as to the investment vehicle utilized.
The returns on these ETFs are taxed as ordinary income which places them at a disadvantage to other assets like qualified dividend equities, treasury securities, and municipal bonds. The figure below shows what the post-tax yield to maturity would be based on the sample calculation above for a staggered bond ladder. As an example, if an investor was at the 22% tax bracket and they achieved a pre-tax 7.73% yield, then they could expect a post-tax return of 6.03% (excluding any other costs). A strategy that could be utilized is to hold these positions in tax advantaged accounts which would allow for greater compounding over time.
Tax sensitivity analysis (Author)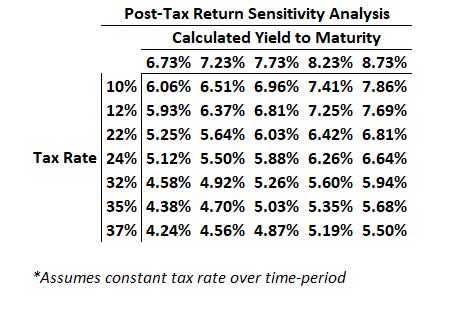
Conclusion
The intent of this article was to identify that most households lack corporate debt instruments in their portfolios for a myriad of reasons. Currently, debt returns are projected at a higher rate and it is a good time for many investors whose investment strategies should align with a larger debt position to move into these positions. The option that is presented in this article was to utilize high yield iBonds (though that is not the only debt instrument that should be in a portfolio) due to their better returns and ETF structure. The benefit of this high yield ETF is that the fund diversifies holdings well, allows better access and liquidity to debt instruments, has fair fees that are lower compared to their peer group median, has monthly cash flows, lower capital requirements, and a set maturity date. Overall, the ETF design provides a good balance between risk mitigation and reward expectation while adding high yield debt to a portfolio could be beneficial.
This article was written by

Analyst’s Disclosure: I/we have a beneficial long position in the shares of IBHD, IBHD, IBHE, IBHF, IBHG, IBHH, IBHI either through stock ownership, options, or other derivatives. I wrote this article myself, and it expresses my own opinions. I am not receiving compensation for it (other than from Seeking Alpha). I have no business relationship with any company whose stock is mentioned in this article.
Seeking Alpha's Disclosure: Past performance is no guarantee of future results. No recommendation or advice is being given as to whether any investment is suitable for a particular investor. Any views or opinions expressed above may not reflect those of Seeking Alpha as a whole. Seeking Alpha is not a licensed securities dealer, broker or US investment adviser or investment bank. Our analysts are third party authors that include both professional investors and individual investors who may not be licensed or certified by any institute or regulatory body.